Recommended
Blog Post

Blog Post
The UK has historically prioritised poverty reduction in its aid spending, focusing finance where it is most needed. In this note, we assess the poverty focus of the UK’s bilateral official development assistance (ODA) over the past decade and compare this to other major donors. To do so, we examine the average income of the UK’s development partners (measured by GNI per capita, adjusted for purchasing power parity) which serves as a good indication of a country’s level of poverty. We also look at the Foreign, Commonwealth and Development Office’s (FCDO’s) most recent aid allocations as outlined in its annual report, to ascertain how the UK’s poverty focus might evolve in the future and how important Africa will remain in the UK’s aid spending plans.
We consider both total UK bilateral ODA (two-thirds of the total in 2020) and the subset of “regionally allocable” ODA (country- or region-specific bilateral ODA, equal to 35 percent of total ODA in 2020). For analysis from 2021 onwards, we are only able to consider the subset of ODA managed by FCDO (FCDO’s bilateral aid was around half of UK’s total ODA in 2020, and FCDO’s regionally allocable ODA was 28 percent of the total).
Key findings:
-
Examining regionally allocable ODA, the UK has historically had the best poverty focus among the top five largest donors. Each has seen a decline in poverty focus in recent years, but this decline has been steeper for the UK, meaning the gap has narrowed.
-
However, an increasing share of UK ODA is spent on projects for which no direct country beneficiary can be identified. When this is accounted for, the UK’s poverty focus falls below that of the US.
-
Among a wider group of countries providing development finance, the poverty focus of UK bilateral ODA was ranked 10th in 2019.
-
More recently, although the poverty focus of UK’s bilateral aid improved in 2020/21, the FCDO annual report suggests that this improvement will unwind in 2021/22, partly as a result of a shift in regional focus, with South and East Asia receiving an increasing share of FCDO’s ODA budget.
-
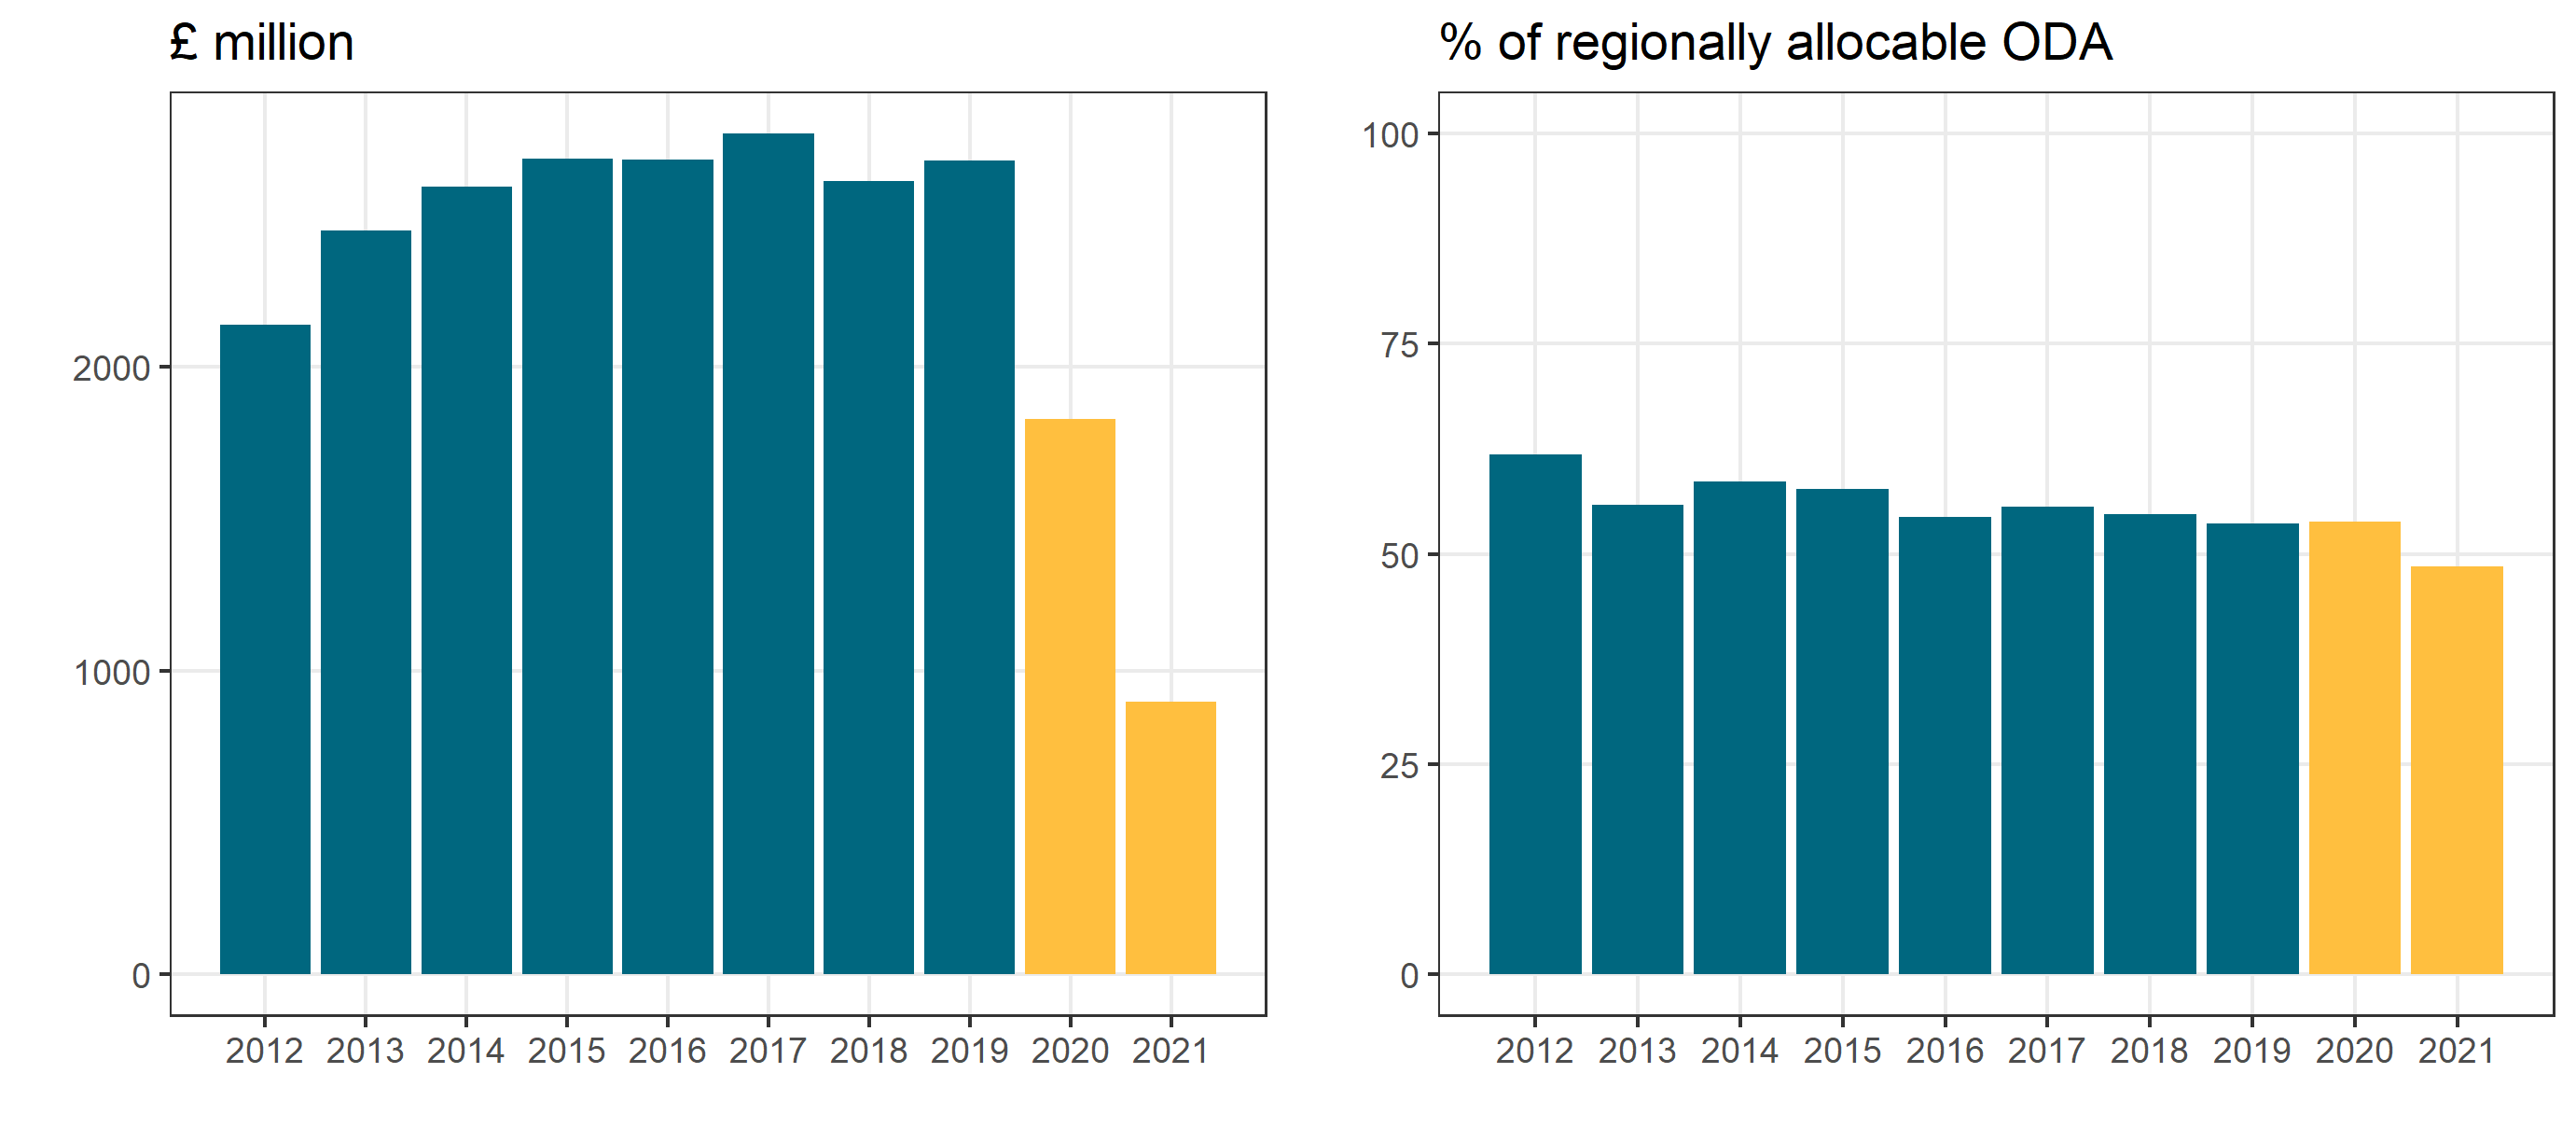
Whereas the percentage of people living in extreme poverty is anticipated to become increasingly concentrated in Africa, the FCDO’s budget for the continent is declining, both in absolute terms and relative to other regions. The FCDO have directly allocated £896 million to Africa in 2021/22. While some additional aid will come from thematic categories, this is likely to represent a reduction of over 50 percent, and in real terms, this would mean the lowest spend by the department (and its predecessors) in over 15 years.
-
Africa’s share of FCDO’s budget in 2021/2022 will fall by 5 percentage points, taking it just below 50 percent for the first time in at least 15 years. This is despite the previous foreign secretary’s commitment that “fully 50% of [the FCDO’s] country bilateral ODA will go to Africa”. By contrast, the budget for the UK’s overseas territories will increase by 2.5 percentage points.
Assessing poverty focus by income, not income groups
This note uses data from the OECD’s Creditor Reporting System and FCDO’s annual report to examine trends in the UK’s poverty focus compared to other providers.
One widely used measure of poverty focus is the distribution of ODA across income groups. Different categorizations of income exist, but one commonly used grouping is the Development Assistance Committee’s (DAC’s) list of ODA recipients, which groups countries into upper middle income (UMIC), lower middle income (LMIC), least developed countries (LDC) and other low income (LIC), with the latter two categories usually grouped together.[1]
Table 1 shows how the UK compares to other DAC countries. By this measure, the UK has a greater poverty focus than the rest of DAC. Between 2010 and 2019, the share of UK bilateral aid directed to LDCs increased from 53 percent to 60 percent, whereas it fell slightly for other DAC countries, hovering around 40 percent.
Table 1. Percent of bilateral (cross-border) ODA by income group
| UK | Other DAC countries | ||||||
|---|---|---|---|---|---|---|---|
| LDC/LICs | LMICs | UMICs | LDC/LICs | LMICs | UMICs | ||
| 2010 | 53.3 | 38.5 | 8.3 | 41.1 | 37.9 | 21 | |
| 2015 | 57.6 | 33.6 | 8.8 | 37.8 | 39.7 | 22.5 | |
| 2019 | 59.8 | 28.7 | 11.4 | 39.5 | 40.9 | 19.6 |
Notes: Excludes ODA for which no income group is specified. “More advanced developing countries and territories” (MADCTs) are included with UMICs but are insignificant.
Source:CRS
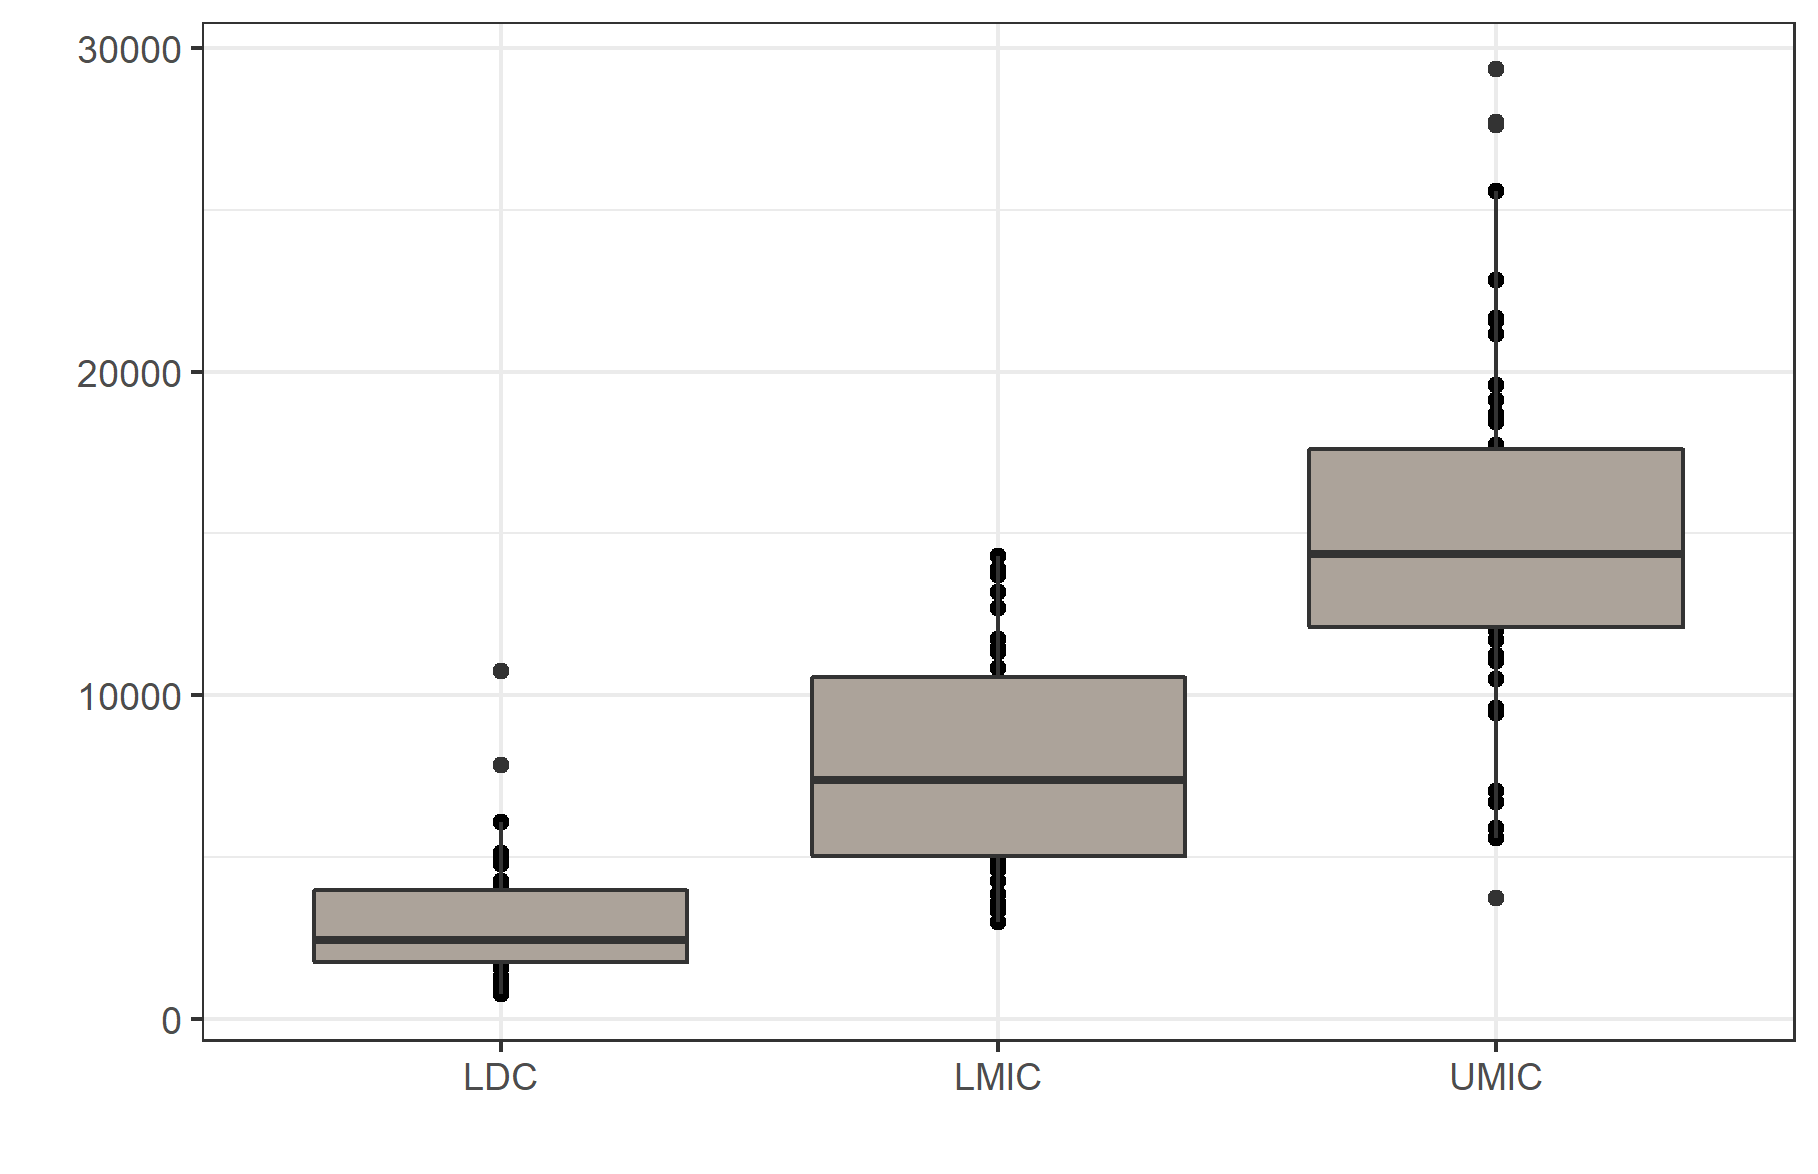
This comparison is useful but lacks granularity. There is a wide range of incomes within each group: any country with GNI per capita between $1,006 and $3,955 (£730 and £2,875) is counted as lower-middle income, and to the extent that GNI per capita is correlated with poverty, donors can have the same distribution within income groups but radically different poverty focuses. In addition, aside from the fact that the LDC group includes some relatively well-off countries in GNI per capita terms, income groups are not determined in purchasing power parity (PPP) terms, so when incomes are adjusted for what each dollar can actually buy, there is significant overlap between groups (even UMICs and LDCs), as figure 1 demonstrates.
Figure 1. Distribution of GNI per capita (USD, PPP) by DAC income group
Note. Y-axis is GNI per capita measured in purchasing power parity terms. Income groups are determined by GNI per capita measured in “atlas” terms, which explains the overlap between groups.
Source: DAC list of ODA eligible countries; World Bank Data
Comparing the UK to the largest five providers
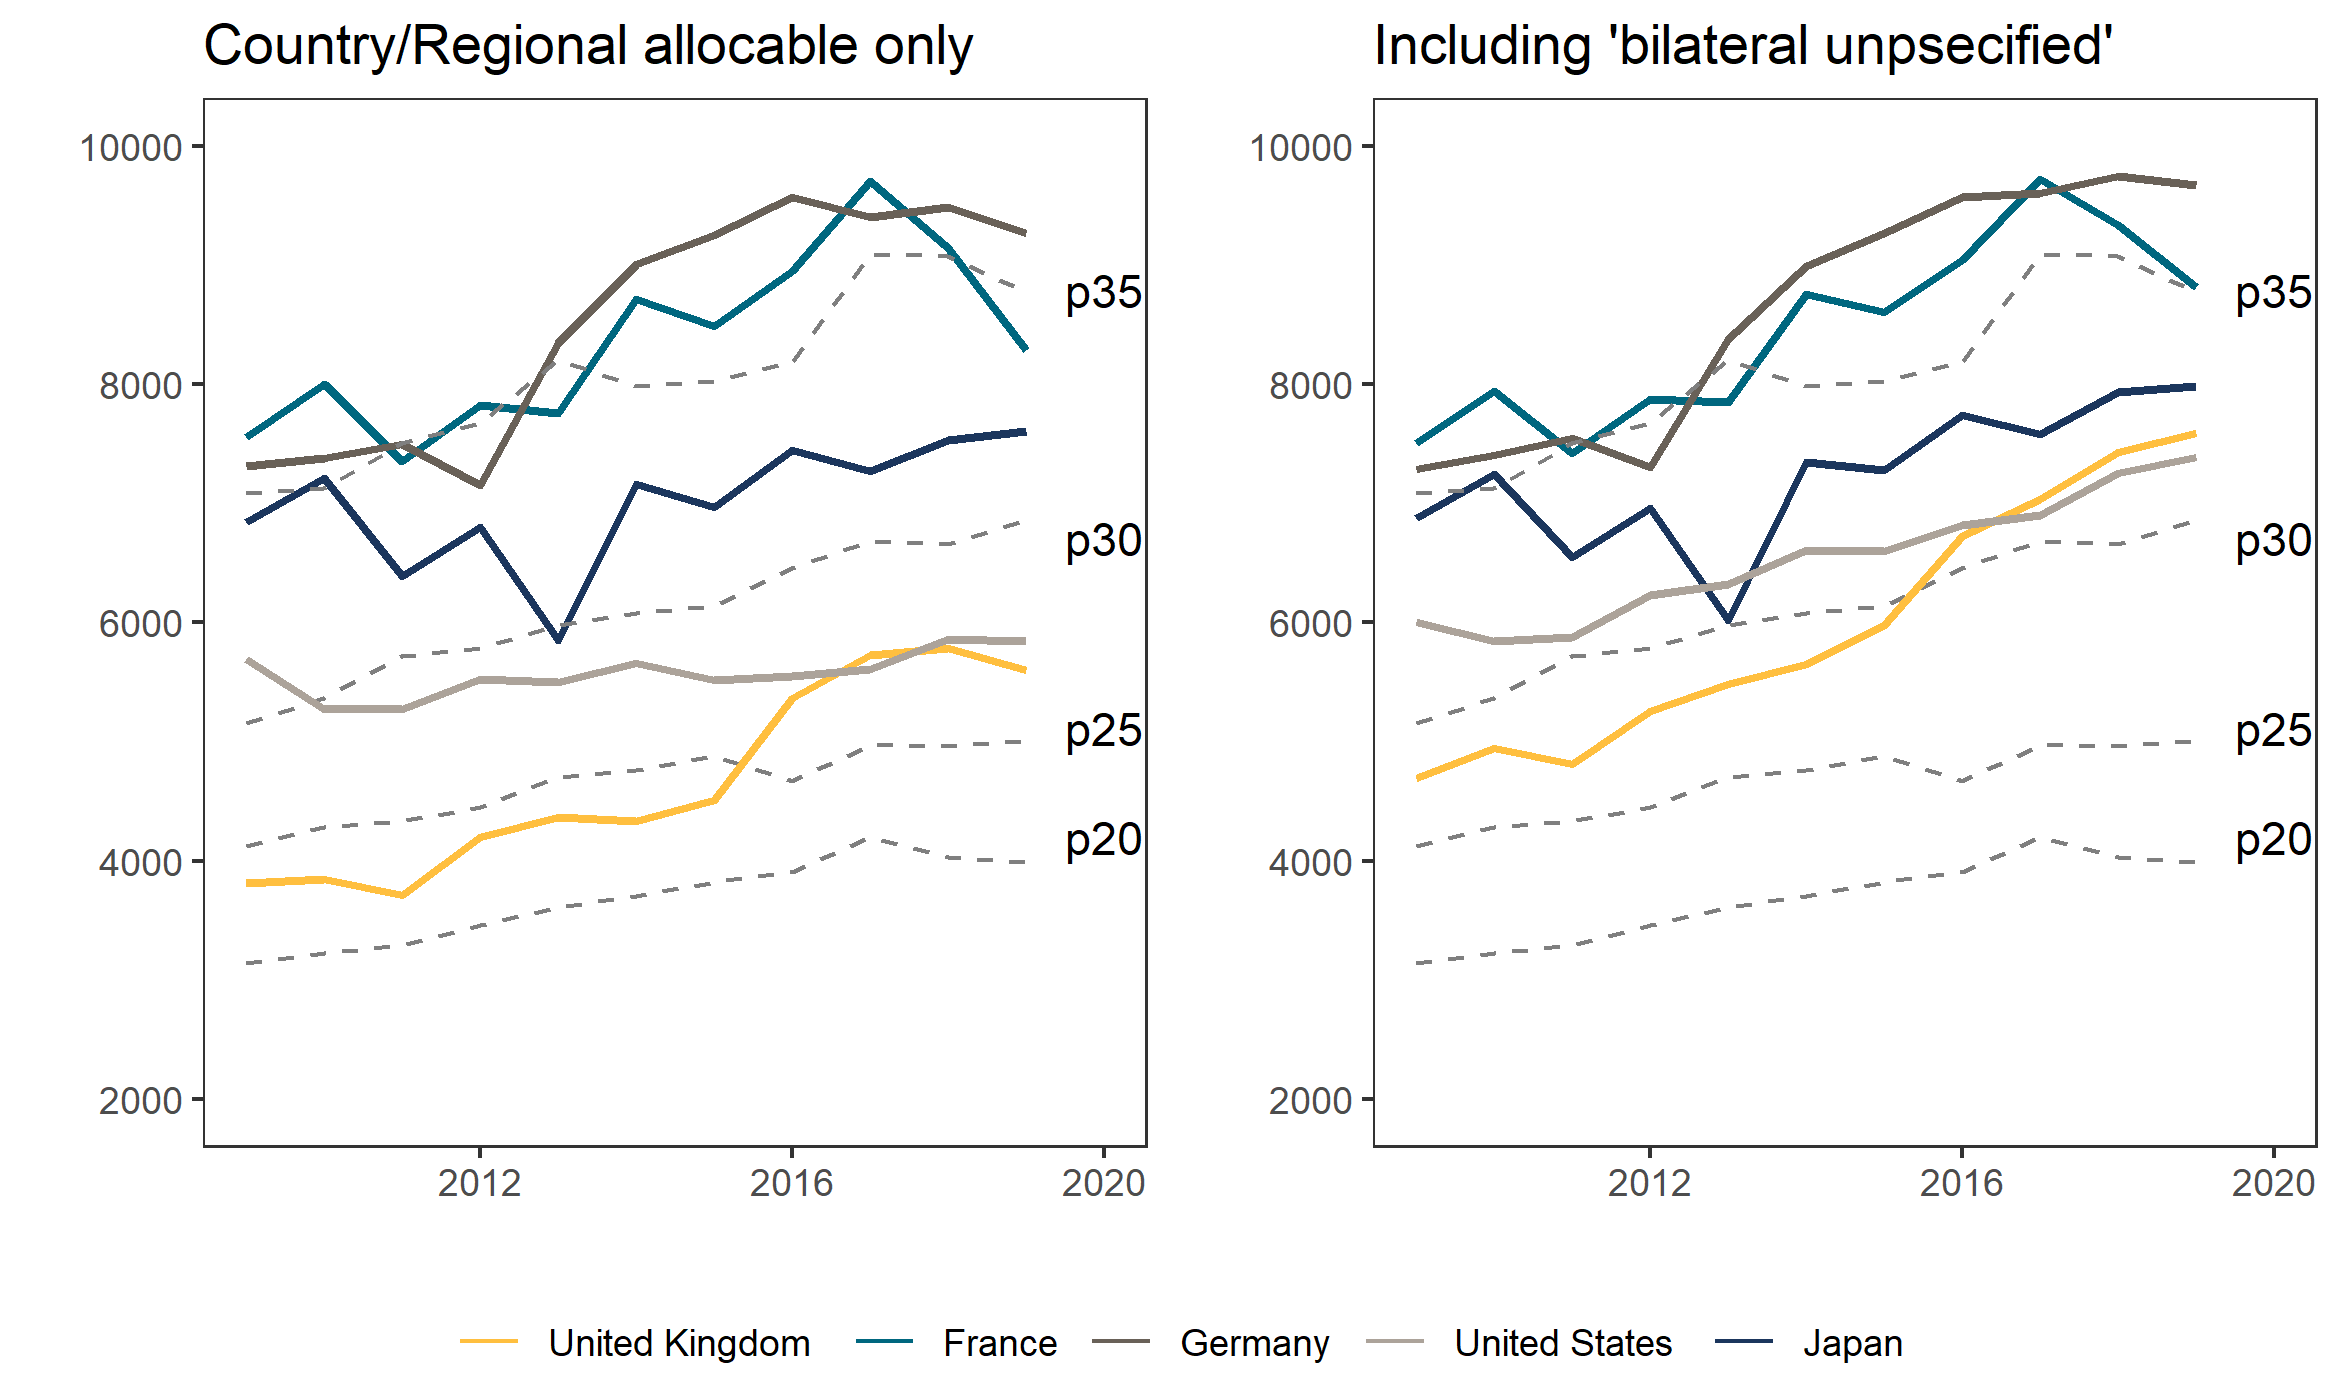
To assess poverty focus more fully, it is instructive to consider the (weighted average) income of recipients, which takes into account this variation. We measure recipient income using data on GNI per capita (PPP) from the World Development Indicators.[2] For each provider, we take the average GNI per capita of all their recipients, weighted by each recipient’s share of overall regionally allocable ODA from that provider (henceforth referred to as “average income of recipients”). On average, incomes among developing countries have trended upwards over past decades, and so even for the same country allocation, the average income of recipients is also likely to have increased for any provider. Therefore, it is useful to compare this average income to a benchmark. Below, we compare the average income of recipients to different income percentiles, for the top five largest providers: the United States, Germany, the United Kingdom, France, and Japan.
These “contour lines” demonstrate that the UK’s poverty focus has fallen in recent years. The left-hand panel focuses on regionally allocable ODA for each country. This shows that the average income of UK aid recipients more or less tracked the 20th percentile until 2015, when it crossed the 25th percentile line (largely as a result of ODA to Turkey as part of the Facility for Refugees). However, in 2019 at least, the UK remained more focused on lower-income countries than the other largest providers. It’s notable that the poverty focus of the US remained steady over the period, while France’s appeared to improve in the latest (2019) data. Germany and Japan’s poverty focus also deteriorated over the period.
Although the UK is the most focused on poverty among the top five providers of ODA, it compares less well than several other DAC countries, such as Belgium and Ireland. In the Commitment to Development Index (CDI) the poverty focus of the UK is compared to 39 other major economies.[3] The UK ranks 10th on poverty focus, well above France and Germany (21st and 19th respectively) but behind several DAC peers.
Figure 2. Weighted average income of recipients, against income deciles (USD, PPP)
Notes: Income measured by GNI per capita (PPP). For panel B, aid to “bilateral, unspecified” has been assigned the average income among all low and middle-income countries.
Sources: World Bank Data, CRS
Because it focuses on regionally allocable ODA, panel A ignores the proportion of ODA on projects for which a direct recipient cannot be identified. The UK spends a much larger share of ODA on such projects than the other major donors. This means that panel A is judging the UK on a smaller (and shrinking) part of its bilateral portfolio than the other countries. In 2019, the UK spent 36 percent of bilateral ODA on projects with the region ‘unspecified’; the next largest was the US, who only spent 25 percent. For France and Japan, the figure was under 10 percent. To account for this, we assign “bilateral, unspecified” the weighted average income among all ODA-eligible countries. If a direct recipient cannot be identified, it seems reasonable to assume that the ODA is spent for the benefit of all ODA-eligible countries equally.
Panel B of figure 2 shows what happens to the weighted average income of recipients when we make this adjustment.[4] It has little effect on the trends for France, Germany, and Japan, but for the UK, the picture changes substantially. As the amount spent on “bilateral, unspecified” has increased in recent years, the UK’s poverty focus has deteriorated to a much larger extent, and as of 2019, the UK has fallen behind the US as the top five provider with the greatest poverty focus. This is largely as a result of the growing share of the ODA budget spent by other departments, such as the Department for Business, Environment and Industrial Strategy or the Department for Health and Social Care: in 2019, DFID and FCO together spent 38 percent of bilateral ODA on “bilateral, unspecified,” whereas for other ODA-spending departments the figure was 62 percent.
This analysis focuses on bilateral aid. Taking into account the share given to multilateral organisations may affect these trends, as multilaterals tend to have a stronger poverty focus. Future analysis will examine the impact this makes to results.
What does the new FCDO annual report imply for the future?
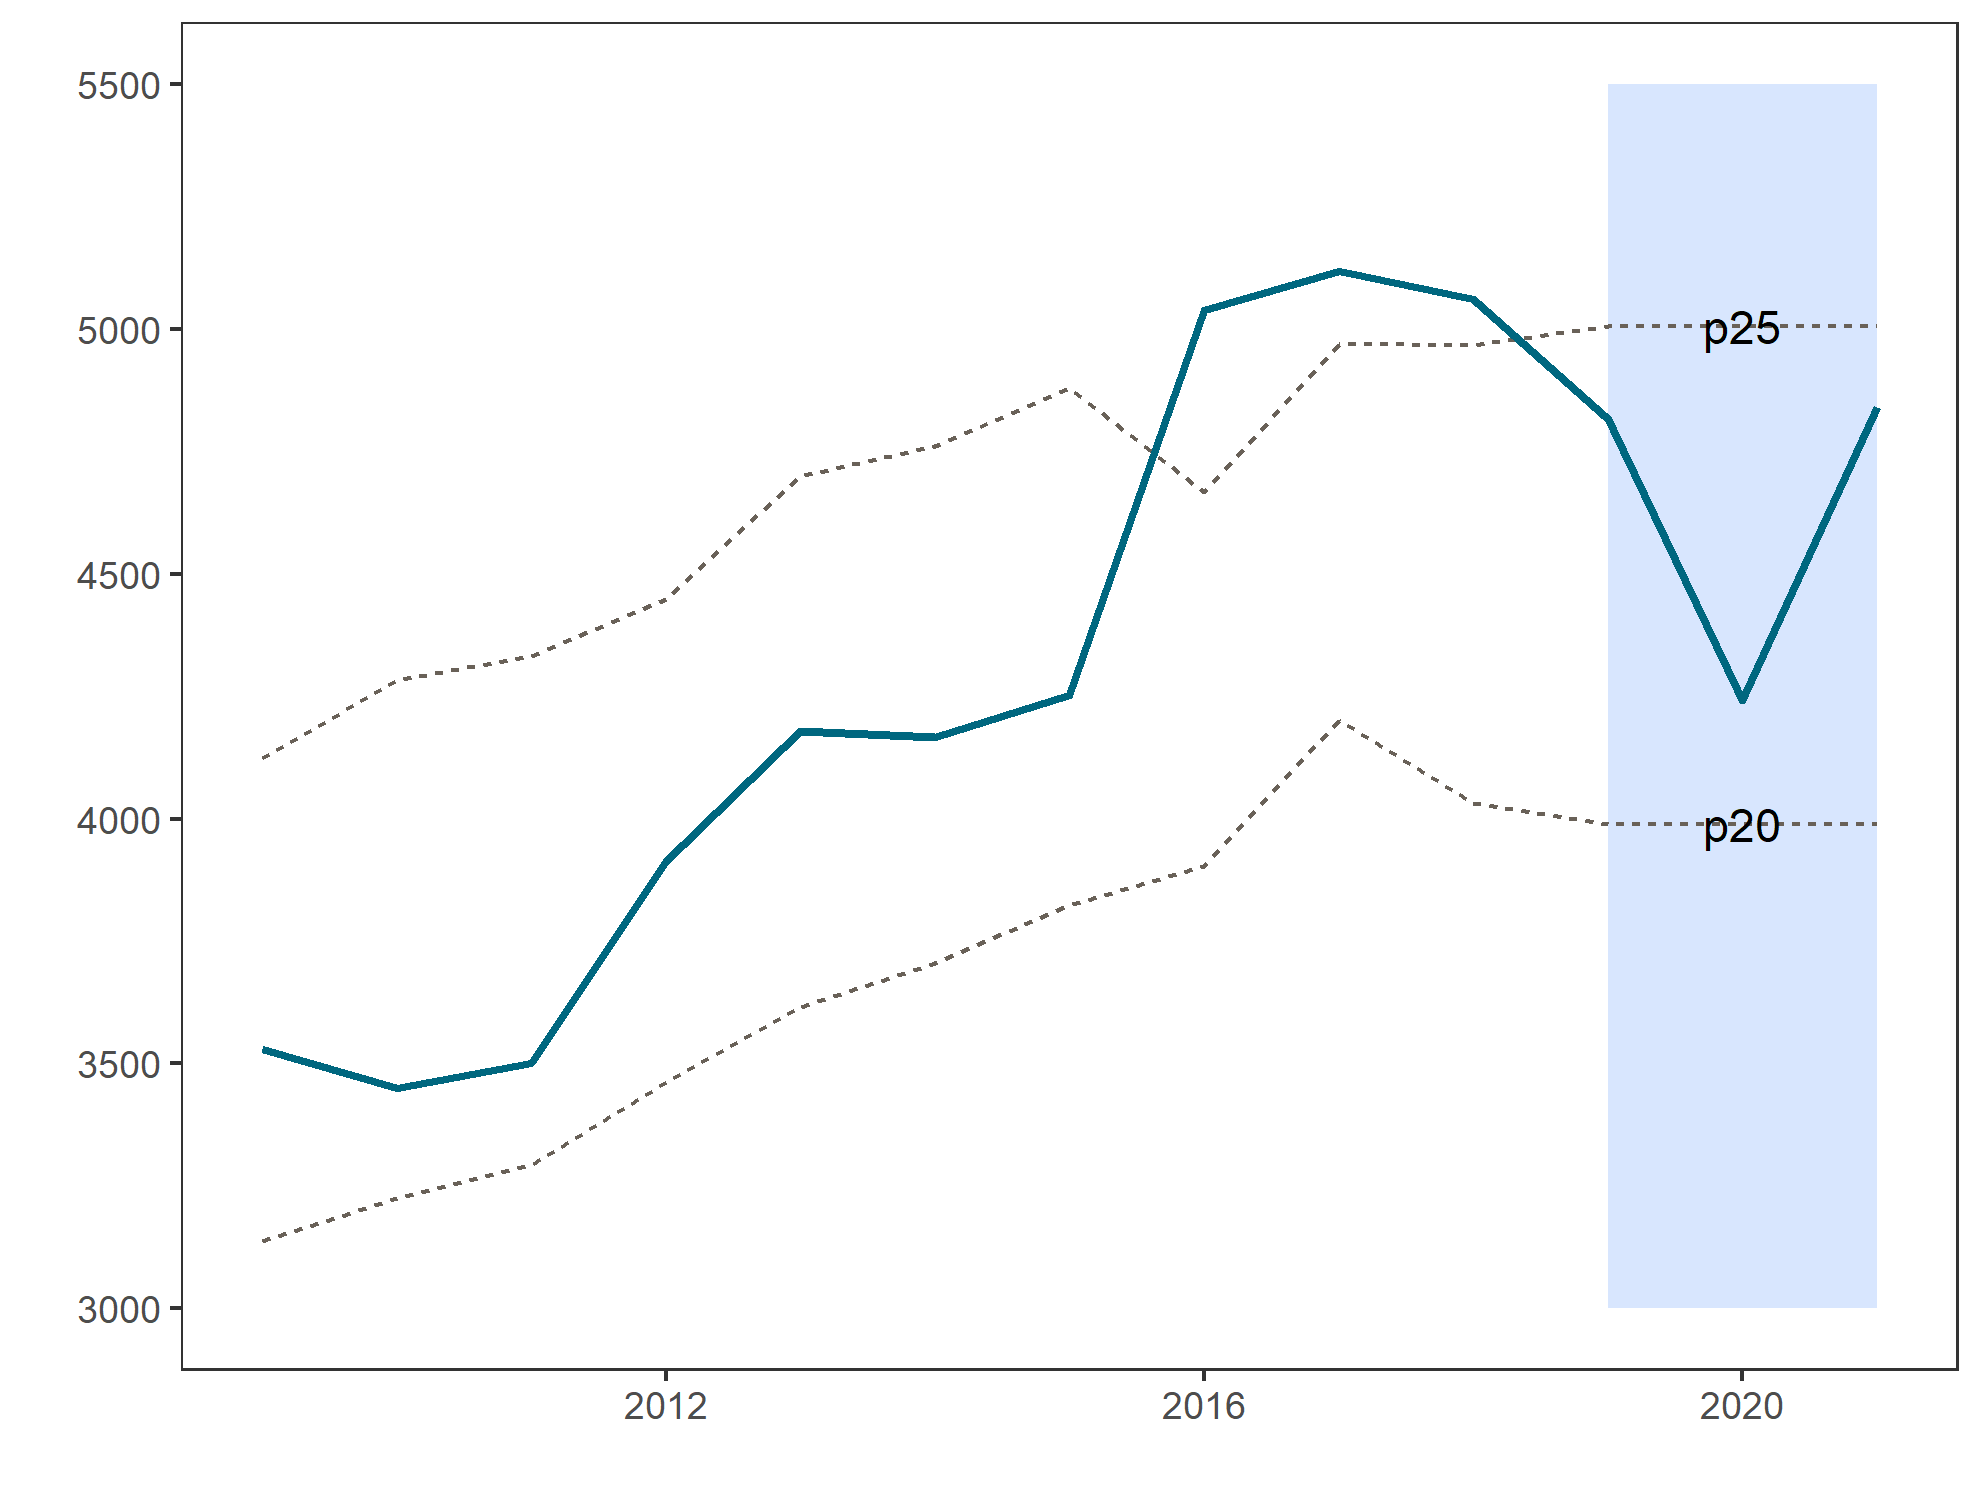
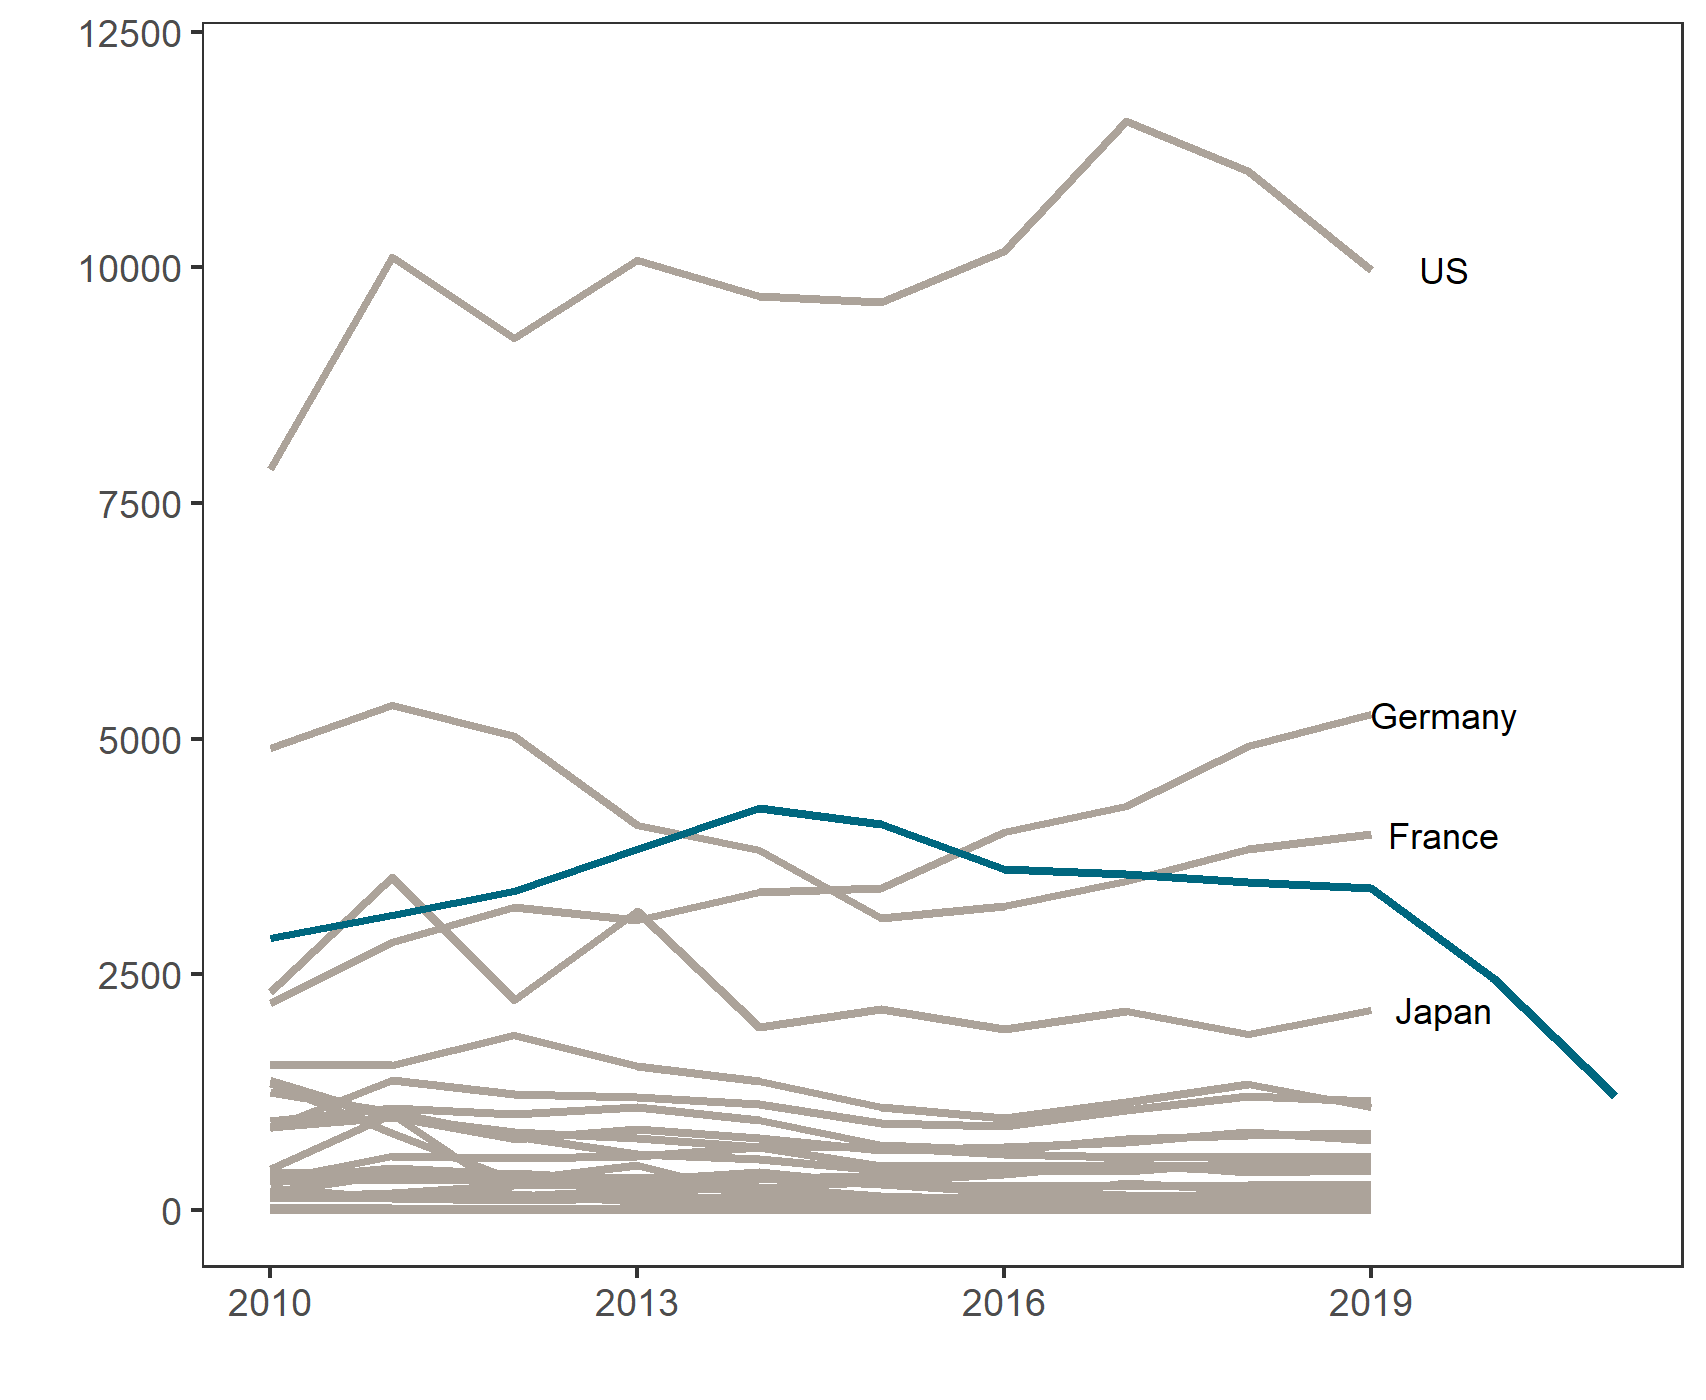
Recently, the first annual report from the newly created Foreign, Commonwealth and Development Office (FCDO) was published, and it contained information both on the country and regional spend in 2020/21 financial year, and the planned spend in 2021/22. While this only covers the three-quarters (roughly) of the UK aid budget that was spent by FCDO, and the numbers for 2021/22 are provisional, it nevertheless gives a sense of how the UK’s poverty focus is changing. Figure 3 tracks FCDO’s poverty focus over recent years and adds the new data from the annual report. This series differs from that presented above, both because it only includes FCDO (DFID and FCO before 2020) and because it does not remove in-donor expenditures, which were not separable in the annual report data.
In the 2020/21 financial year, despite the cuts to the budget of around 6 percent (roughly £1 billion), FCDO’s poverty focus in the remaining bilateral spend improved, with the average income of recipients returning to the 20th percentile. This could suggest that decline in poverty focus in the last few years was an anomaly—a result of the “refugee crisis” that led to a far higher share of ODA being directed to relatively well-off countries such as Turkey and Jordan (bilateral, cross-border aid from FCDO to these two countries increased from £4.6 million in 2011 to £233 million in 2016).
However, in 2021/22 with the implementation of substantial cuts to the UK’s bilateral budget, the remaining funds saw a decline in their poverty focus. The average income of recipients increased from $4,200 to $4,800 (£3,050 to £3,490). Of course, the poverty focus is overshadowed by the size of the cuts to the bilateral budget. As well as the average income of partners increasing, the regionally allocable budget declined from £3.4 billion to £1.8 billion between these years.
Figure 3. Average income of FCDO recipients
Notes: Income measured by GNI per capita (PPP). Only includes country and regionally allocable spend. Shaded area indicates data from FCDO annual report.
Sources: World Bank Data, CRS, FCDO Annual Report
For the period 2022 onwards, the size and focus of the UK’s aid budget are yet to be determined and will depend in part on the spending review. However, this analysis provides one performance indicator for FCDO’s bilateral poverty focus, and establishes a benchmark against which future allocations can be judged.
What does the FCDO annual report tell us about aid to Africa?
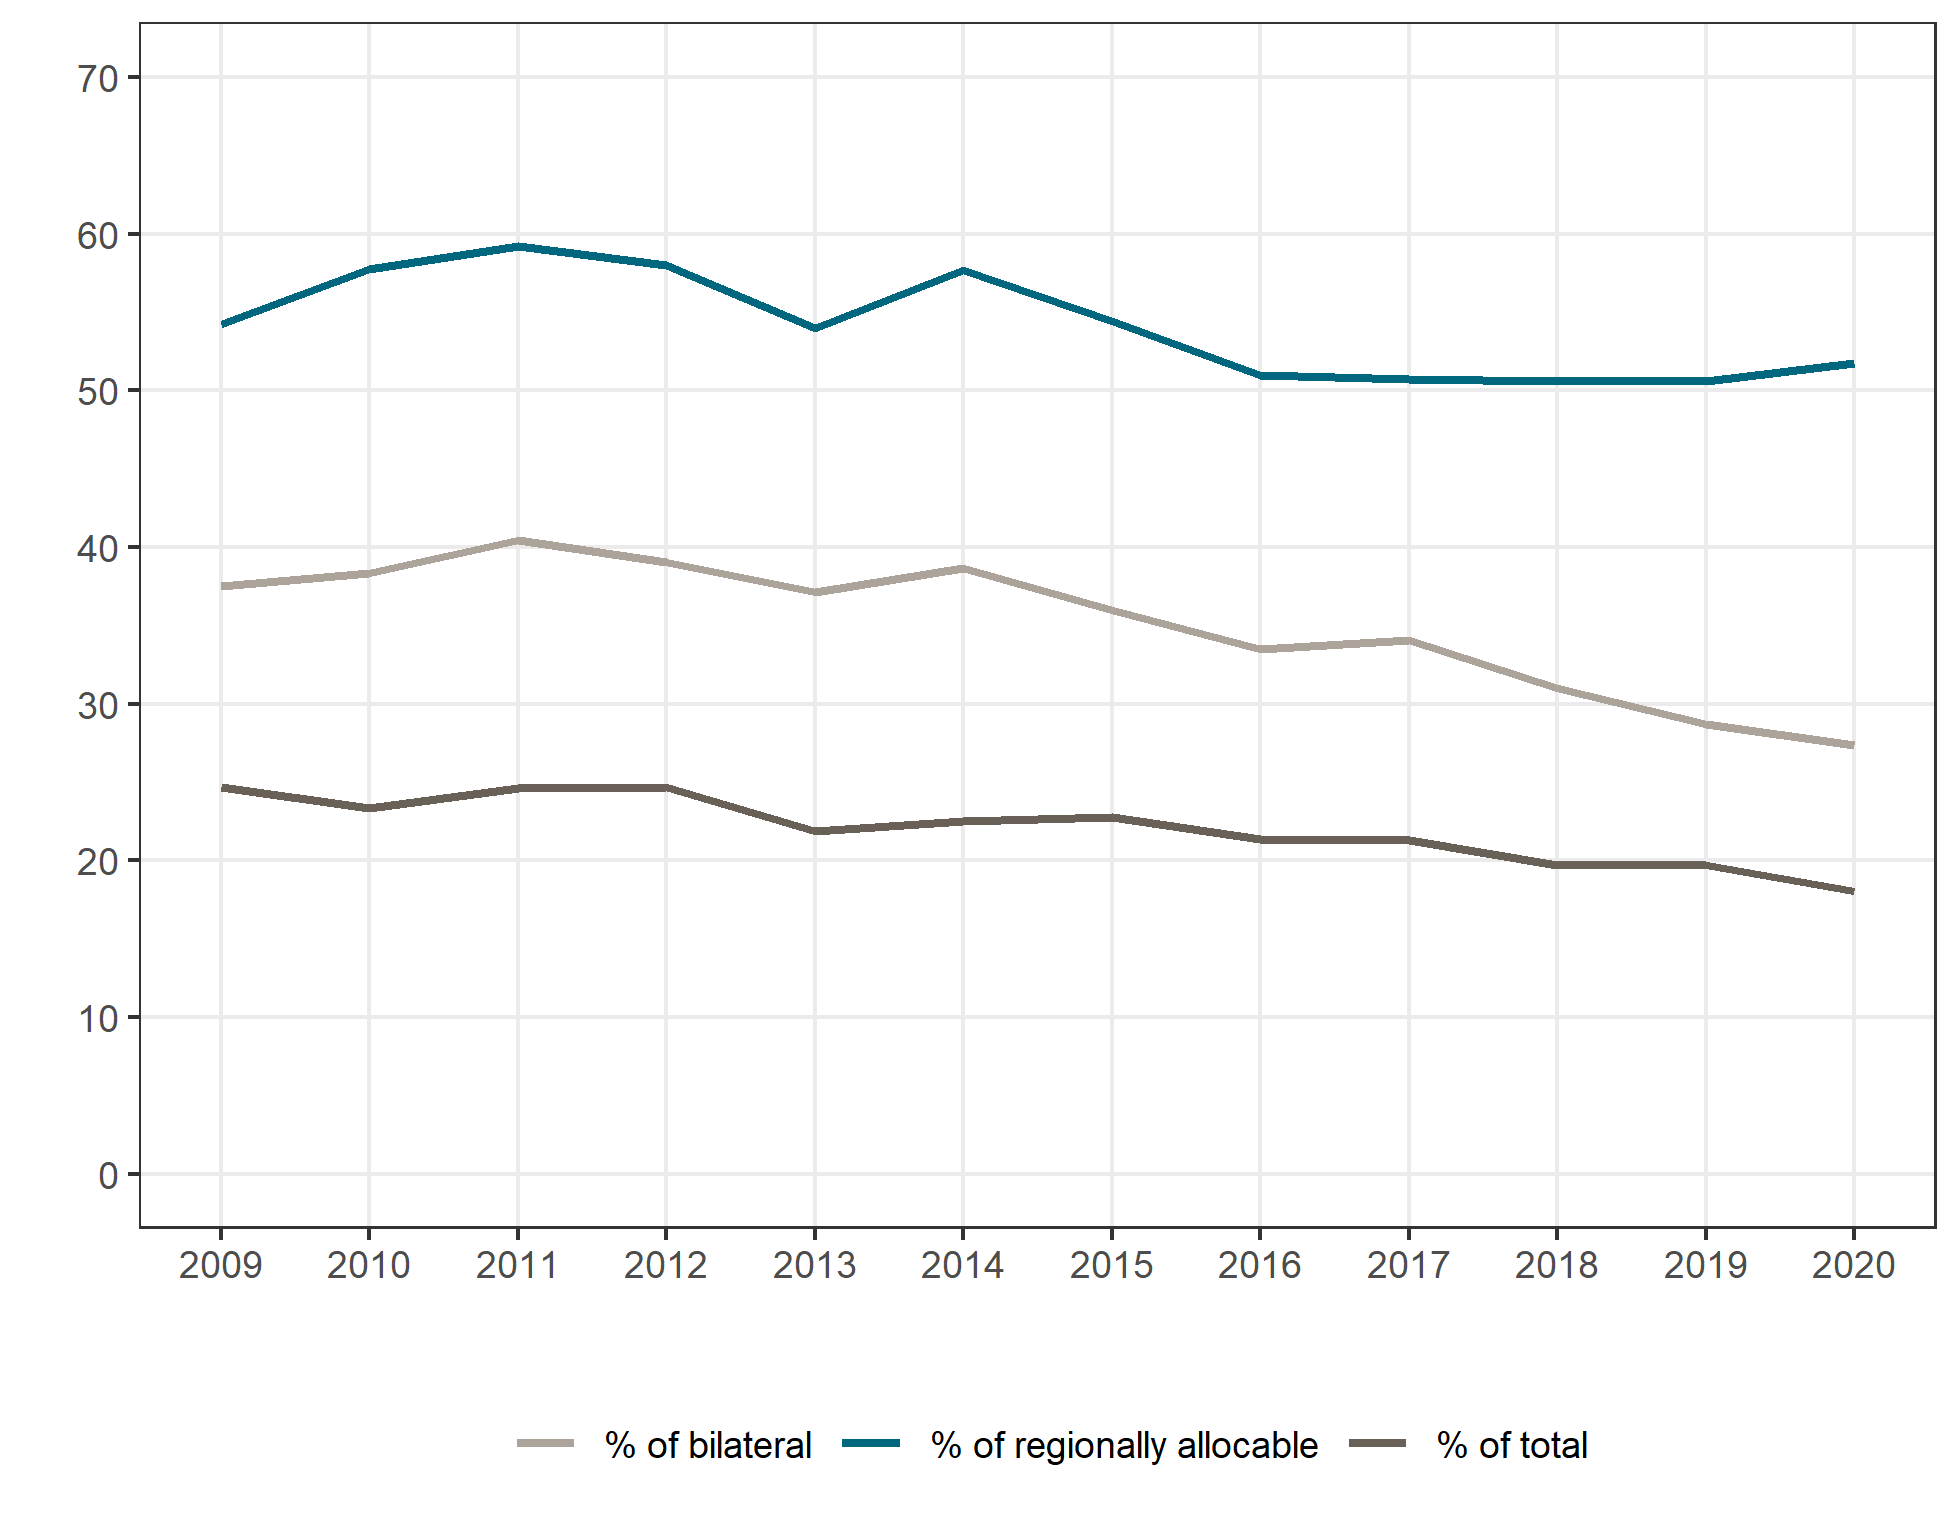
Africa remains a key concern for any development actor focused on eliminating poverty. While economic performances have differed across different African countries, sub-Saharan Africa remains home to 64 percent of those in extreme poverty (measured as those living on less than $1.90 a day), and this percentage is likely to increase over coming decades. It is also the region with the largest gap between financing needs and ability to raise domestic resources, suggesting that external finance (and ODA in particular) will remain vital. As such, the percentage of ODA spent in Africa is a good proxy for the degree to which donors are focused on reducing poverty. Historically, the UK (including non-FCDO departments) has had a strong focus on Africa. Regionally allocable ODA to the continent has remained above 50 percent for decades, although the increasing trend towards spending ODA domestically has meant that regionally allocable ODA has itself declined, so ODA to Africa as a percentage of total bilateral has fallen (Figure 4).
Figure 4. UK bilateral ODA to Africa, as % of regionally allocable, bilateral, and total ODA (including non-FCDO)
Source: Statistics on International Development,additional tables
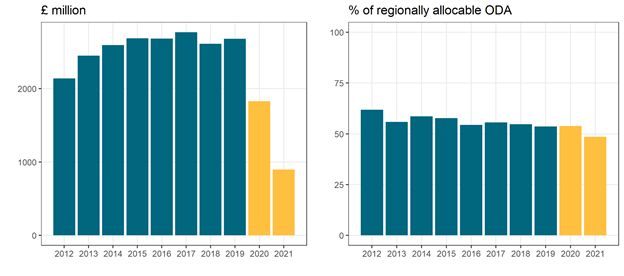
This trend is also true for FCDO specifically, for which we have provisional budget data for regionally allocable ODA for the financial year 2021, from the FCDO annual report. Figure 5 shows how bilateral ODA from FCDO to Africa from the UK has evolved, both in millions of pounds, and as percent of regionally allocable ODA. The comparison with previous years makes for grim reading. Africa’s share of regional allocable ODA has been steadily declining for several years, and the annual report figures suggest that this is set to continue. Africa’s share of FCDO’s ODA regionally allocable ODA budget will fall below 50 percent for the first time in at least 15 years.
The slippage below the 50 percent benchmark is not only significant historically, but also with regards to statements made by the foreign secretary. On April 27, 2021, Dominic Raab testified to the Parliamentary International Relations and Defence Committee that “fully 50% of [the FCDO’s] country bilateral ODA will go to Africa. That will be £764 million in the year ahead.” This clarified his commitment on April 21 that the "FCDO will spend around half its bilateral ODA budget in Africa" in 2021-22. Although in 2021-22 the FCDO allocated £769.4 million to specific countries in Africa, this comprises 49.7 percent of the FCDO’s country-allocable bilateral ODA.
However, the most dramatic difference is in the absolute numbers. FCDO’s direct bilateral budget for Africa is £896 million according to the annual report. While some additional ODA for the continent will come from thematic categories, the majority of such spending will be allocated to CDC or multilateral institutions (for example, nearly all of the dedicated health spending is allocated to the Global Funds department, responsible for the budgets of multilaterals such as the Global Fund and GAVI). We estimate that thematic spending would add no more than around £400 million. This would imply FCDO’s aid spending in Africa would be over 50 percent lower than comparable spend in 2019, and would be the lowest in real terms in over 15 years.
Looking further back, the FCDO’s total ODA budget in 2012 (£7.9 billion in nominal terms for DFID and FCO combined) was just below the 2021/22 budget of £8.1billion. However, FCDO’s Africa bilateral budget in 2021/22 is nearly half of the 2012 level.
Figure 5. FCDO bilateral ODA to Africa, £ million (left) and share of regional allocable ODA (right)
Note: 2020 and 2021 denote financial years, and only includes aid directly allocated to African countries or regions, and so is not directly comparable to earlier years, as Africa may receive additional aid from thematic allocations.
Sources: FCDO annual report, CRS
How does FCDO’s spend in Africa compare to other donors?
The decline in ODA spend in Africa will turn the FCDO from one of the most prominent development actors on the continent to a minor player, with an ODA budget comparable to Sweden or Canada. FCDO alone—previously DFID and FCO—were the second largest bilateral donor to Africa. It was overtaken by Germany in 2015, and France in 2018, but remained one of the most important bilateral donors. According to the budget presented in the FCDO annual report, its relative importance is set to dramatically decline.
Figure 6. Bilateral ODA spent in Africa ($ million) by FCDO (blue) and DAC donors
Note: Years 2020 and 2021 refer to financial years.
Sources:FCDO annual report, CRS
It should be noted that the FCDO report does not include investments in Africa made by CDC (soon to be renamed British International Investment). In 2019, these totalled just under £1 billion ($1.38 billion), all of which were funded by capital that came from FCDO’s budget. The inclusion of such investments would therefore substantially change FCDO’s relative size. However, such spending is generally in the form of loans and equity investments in the private sector. Even if welcome, these cannot be seen as a direct replacement for the grant financing traditionally provided by FCDO.
What does the annual report say about FCDO’s changing regional focus?
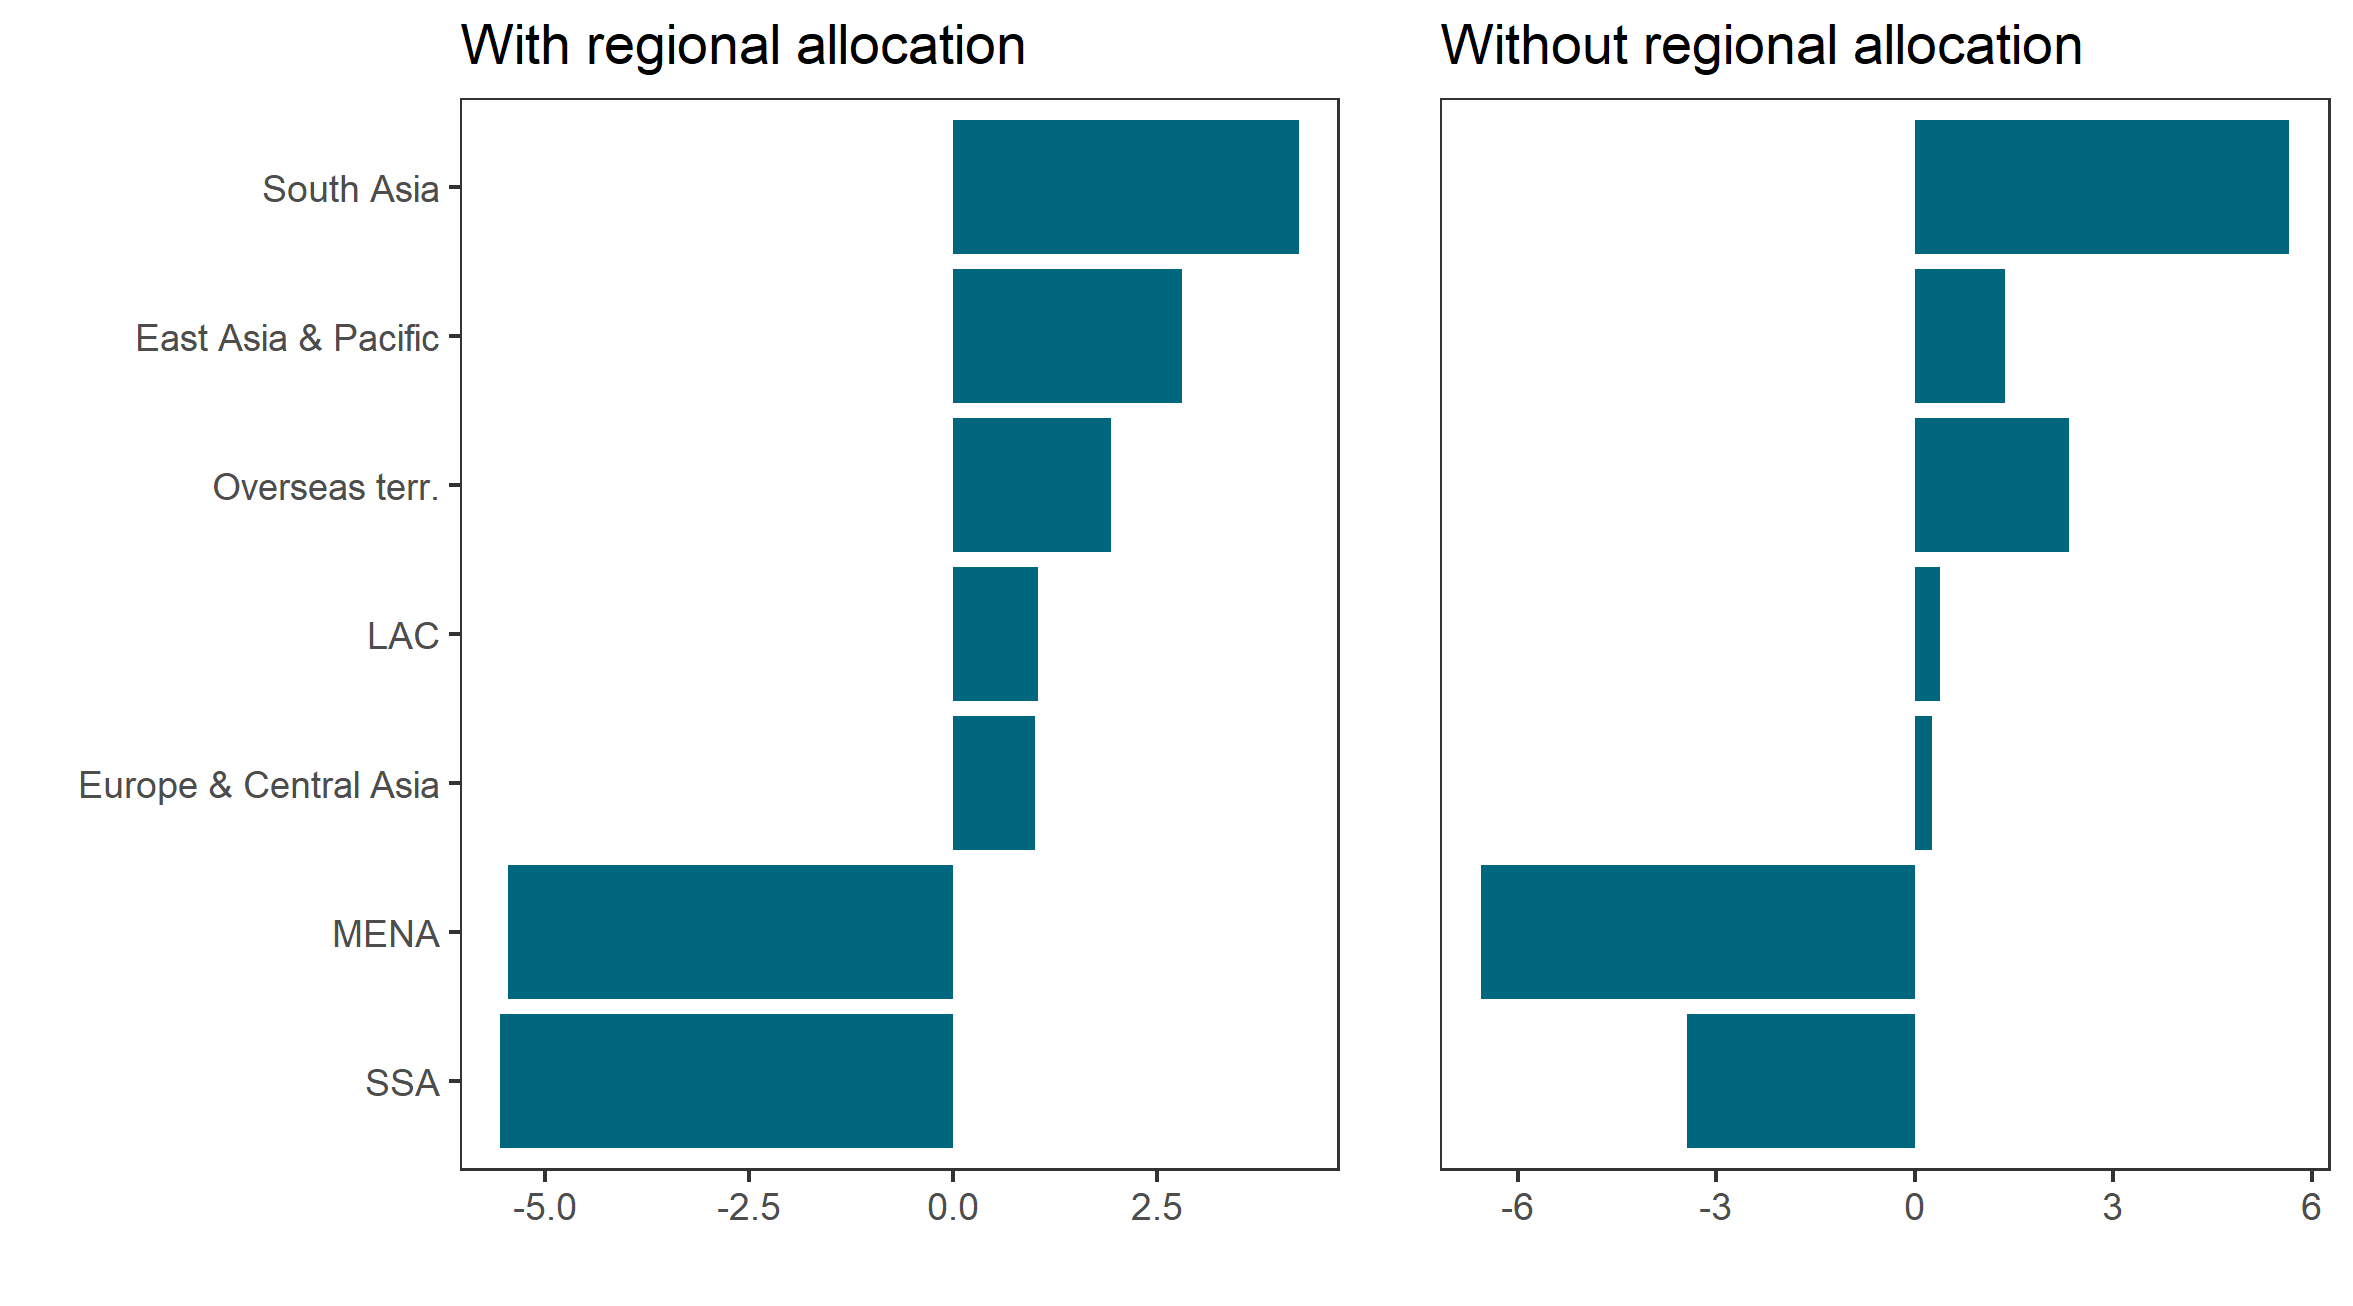
More broadly, between 2020/21 and 2021/22 there has been a marked shift in regional focus, with the “Indo-Pacific tilt” readily apparent. Sub-Saharan Africa and the Middle East and North Africa were the only regions to record a decline in their share of FCDO ODA between these years, with each falling by more than 5 percentage points. In the latter case, this is perhaps less surprising when the decline in refugee-focused ODA is considered.
However, the fact that sub-Saharan Africa records the largest decline in its percentage share of FCDO ODA stands in contrast to the previous foreign secretary’s intention to “exert maximum influence as a force for good in Africa.” The picture is slightly different if “regional” allocations are excluded (for example, the budget for the “Eastern European and Central Asian Directorate”). But by either metric, between the outturn for 2020/21 and the (tentative) budget for 2021/22, Africa’s share is set to fall below 50 percent, having been above for at least the previous 15 years.
Figure 7. Difference in share of FCDO ODA by region, between 2020/21 and 2021/22
Note: ODA to China is temporarily higher as a result of the closure of the Prosperity Fund (see footnote 12 of the FCDO annual report).
Conclusion
The degree of poverty focus has become especially important since the decision to cut the ODA budget from 0.7 to 0.5 percent of GNI, with the bilateral budget taking the hardest hit. If what remains is not well targeted, or if it is allocated with the UK’s narrow self-interest in mind, this will exacerbate the impact of the cuts on the poorest.
The UK has historically had the strongest poverty focus among the top five largest donors, and compared well to the majority of DAC countries. However, the gap has narrowed in recent years, as the UK has spent more aid domestically and in middle-income countries. If the FCDO annual report is a harbinger of things to come, this looks set to continue. For the first time in over at least 15 years, Africa’s share of UK ODA is set to decrease below 50 percent, even as its share of the world’s global poor continues to increase. The average income of the UK’s development partners looks set to increase even when the global distribution of income is accounted for, and this increase looks worse when we adjust for the proportion of ODA spent domestically.
The aid budget is currently being allocated to optimize against different objectives: increasing “non-fiscal” ODA, prioritizing capital spend over current, and counting as much as possible for as little cost. Allocating ODA according to these objectives might make the fiscal numbers look better (albeit very slightly) but it is unlikely to lead to a budget that can do the most good for the world.
The coming development strategy will set out the future of the UK’s development approach. One important performance measure for that development strategy is whether the UK’s aid budget is focused on its core purpose (legally, the foreign secretary’s power to spend aid depends on its likelihood of leading to poverty reduction). The average income of partner countries will remain an important metric to observe. If the UK maintains its poverty focus, ensuring that the average income of partner countries does not rise above the 25th percentile of the global income distribution, then poverty focus will continue to be a key distinguishing feature between the UK and other large providers. If it’s poverty focus slips, at the same time as the budget is being slashed, then along with the 0.7 commitment it will have lost two features that used to make the UK a global development leader.
[1] The LDC group includes some that would be lower or upper middle income based on their GNI per capita alone but have other vulnerabilities that mean they are usually grouped with LICs (and not included in the middle-income categories). We follow this practice.
[2] Some missing data points were filled using GDP per capita from the IMF’s World Economic Outlook
[3] The CDI uses a grant equivalent measure of development finance and excludes in-provider expenditure, whereas this note examines all bilateral gross disbursements. In addition, the poverty-focus indicator in the CDI gives extra weight to a focus on the poorest countries based on the inverse of their income.
[4] We have excluded core support for NGOs from this graph, for the same reason as we focus on bilateral: by definition donors do not decide the country allocation of such spend.
Rights & Permissions
You may use and disseminate CGD’s publications under these conditions.


