Recommended
This note was originally published in draft form before Gavi’s March 2019 board retreat. You can view the original draft version here.
Introduction
With a vision of “creating equal access to new and underused vaccines,” Gavi set several coverage-specific targets for 2020 as part of its Phase IV strategy, including the immunization of an additional 300 million children, increased pentavalent 3 and measles-containing vaccine (MCV) 1 coverage, and greater equity in coverage across wealth quintiles.[1] The strategy also called for broadening protection through improved routine coverage and the introduction of new vaccines.[2]
Gavi’s Mid-Term Review laid out progress to date on these targets. In 2016 and 2017, Gavi-supported countries vaccinated 127 million additional children through routine immunization and roughly 200 million people through campaigns. [3] Gavi also supported more than 100 introductions and campaigns of eight vaccines.[4] The proportion of districts in Gavi-supported countries where DTP 3 coverage reached or surpassed 80 percent improved modestly as well.
While this progress is laudable, coverage data from official and survey sources paint a more worrying picture of stagnation in coverage at suboptimal levels. Furthermore, coverage seems to be backsliding in some countries currently and formerly supported by Gavi.
In this note, we explore these coverage challenges in greater detail and offer recommendations for how Gavi can address them in its 5.0 strategy.
Challenges
Estimates aggregated across all Gavi-supported countries show modest gains in vaccine coverage between 2015 and 2017 based on WHO-UNICEF data. For example, DTP 3 and pentavalent 3 coverage increased only one percentage point, while drop-out after pentavalent 1 decreased one percentage point.[5] Coverage did not change at all in some cases. MCV 1 and pentavalent 1 coverage across the Gavi portfolio, for example, remained constant. Similarly, 27 of 64 Gavi-supported countries in the initial self-financing, preparatory transition, or accelerated transition stages in 2017 had the same DTP 3 coverage in 2017 as in 2015 (figure 1), although coverage was already relatively high in some of these settings.[6]

Coverage also varies widely across countries, even among those in the same co-financing stage (figure 2). Countries with sizeable birth cohorts but low and inconsistent levels of coverage present particularly troubling cases. For example, Pakistan (preparatory transition) and Indonesia (fully self-financing) had the third and fourth largest birth cohorts, respectively, in 2018, but MCV 2 coverage below 65 percent in 2017.

Recent Demographic and Health Survey (DHS) data for countries currently and formerly supported by Gavi depict similar variability in coverage (figure 3).[7] For example, pentavalent 3 coverage among children 12–23 months old ranged from a low of 39.6 percent in Angola (fully self-financing) to a high of 96.5 percent in Burundi (initial self-financing). Likewise, the proportion of children in the same age group without any vaccinations ranged from 0.3 percent in Burundi to 19.2 percent in Timor-Leste (fully self-financing).

Within-country variation is also an issue, with children from poor households, living in rural areas, and with mothers who have less education least likely to be vaccinated, according to DHS reports. Gaps in immunization, no matter how small, have important implications for disease prevalence and incidence rates. Vietnam, for example, has had a national coverage rate for measles above 90 percent since 2014, but experienced a large outbreak around that time and reported 227 cases of measles in 2017 compared to 46 in 2016.[8]
There are numerous drivers of under-immunization. Frequently cited factors in Joint Appraisals and other case studies include:
-
Inequitable distribution and poor training of health workers, high staff turnover, and salary payment delays[9]
-
Shortfalls in funding created by macroeconomic changes (e.g., currency depreciation and changes in commodity prices), poor demand forecasting, or lack of prioritization for immunization[10]
-
Procurement and supply chain issues (e.g., global shortages of IPV and high wastage rates)[11]
-
Fears about vaccine safety and the intent behind immunization efforts, as well as reasons unrelated to fear[12]
Challenges on the Horizon
Increased reliance on immunization campaigns may draw time and resources away from routine vaccination efforts
Gavi saw the proportion of applications for campaigns rise from 15 percent in 2016 to 31 percent in 2017 and 55 percent in 2018.[13] Increased reliance on immunization campaigns may have unintended consequences. Immunization campaigns can be costly in terms of diverting health workers’ time away from routine activities, as well as requiring funding for transportation, hiring, and overtime.[14] In addition, they may consistently miss key population groups if not designed well.[15] Coverage rates for vaccines not provided through campaigns may also suffer if routine immunization remains or becomes weak. For example, India’s 2005–2006 DHS attributes differences in coverage of at least 17 percentage points for polio and DTP, which are given on the same schedule, to the Pulse Polio campaign.[16] Though Gavi acknowledges the potential hazards posed by frequent campaigns, documents from its November 2018 board meeting classify those risks as “outside of appetite.”[17]
The fiscal space for immunization remains highly variable
As noted above, many factors have affected domestic funding for immunization activities. While volatility in funding is unlikely to completely cease in the future, inefficiencies in country spending—as evinced by the inconsistent relationship between spending on routine immunization and DTP 3 coverage—remain.[18] Improving the value-for-money achievable with current resources should be prioritized, particularly since studies have found that the costs of vaccination programs relate more to the delivery of vaccines than their cost.[19] Additionally, an analysis of global health transition from the major donors identified 11 countries that could undergo one or more transitions at the same time, and 9 of those countries receive support from Gavi.[20]
Current approaches to vaccine introductions may be inefficient
Gavi-eligible countries have made important strides in the introduction of new and underutilized vaccines. For example, 85 percent of middle-income countries (MICs) eligible for Gavi had introduced PCV in 2017 compared to just 3 percent of eligible MICs in 2010 and 50 percent of never-eligible MICs in 2017.[21] Nonetheless, introducing many disparate vaccines over a short time period, as many lower-income countries have done (figure 4), may create costs that affect the efficacy and scale-up of newly introduced vaccines.[22] For example, the concurrent launch in Mozambique of MCV 2 and IPV, which target different age groups, negatively influenced the degree to which social mobilization activities for each could be tailored.[23] Vaccines introduced nationally several years ago still had variable coverage rates in 2017 (figure 5), possibly indicating that current approaches to introduction more broadly may be insufficient. That some transitioned countries have not introduced all WHO-recommended vaccines also remains a key topic of interest to Gavi.[24] It requires further exploration, though stakeholder interviews suggest that the availability of financing plays a significant role in vaccine introduction.[25]


Coverage estimates can be inconsistent
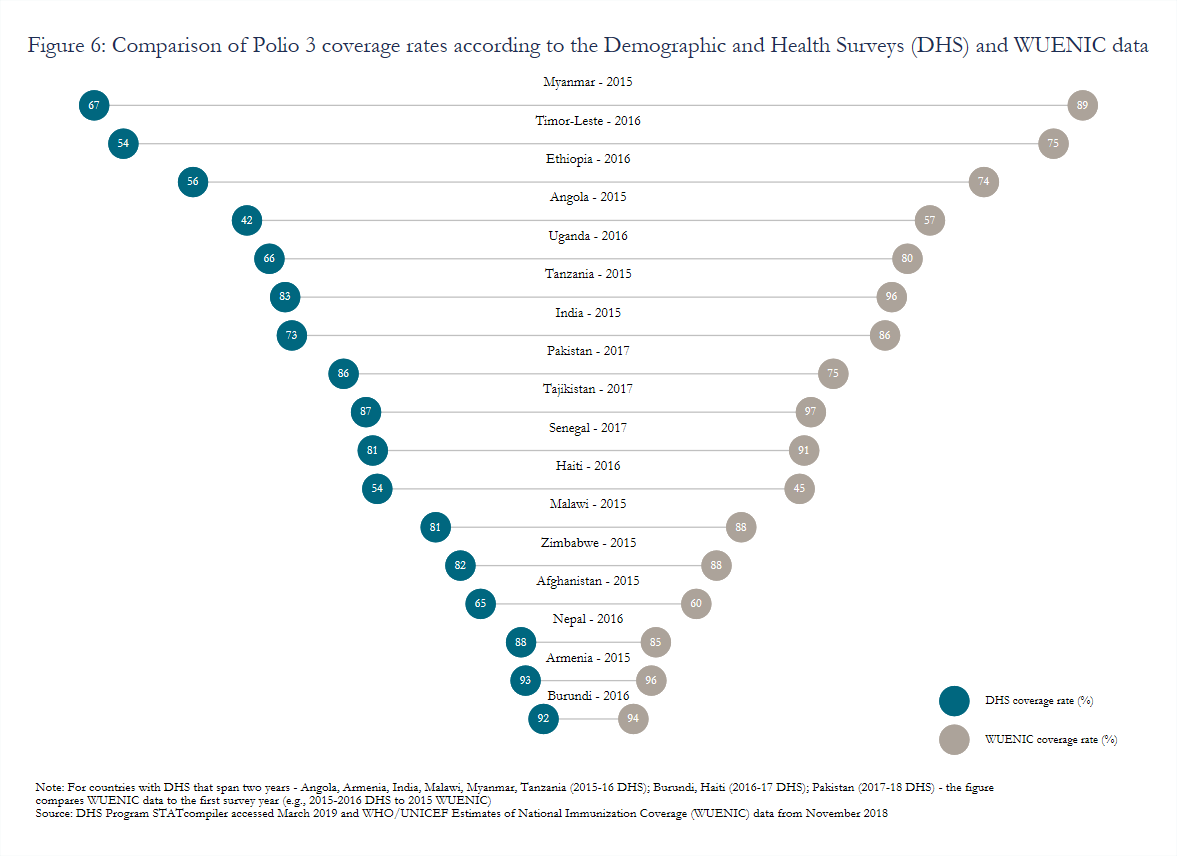
Variation in estimated coverage rates stemming from the use of different data sources (e.g., surveys or routine administrative reports) remains a widely acknowledged but persistent challenge. Gavi has introduced a data quality indicator that measures the percentage of Gavi-supported countries with a recent household survey and less than a 10-percentage point difference between survey and administrative estimates.[26] Though the indicator will compare estimated coverage rates for pentavalent 3 (or DTP 3 in some cases), significant inconsistencies also endure for other vaccines, such as polio (figure 6). Moreover, issues with caregiver recall or health card completeness, which many surveys rely on to calculate coverage, may lead to overestimates. In Nicaragua, measles coverage calculated based on caregiver recall or child health cards indicated an 82 percent coverage rate while dried blood spot samples revealed an effective coverage rate of just 50 percent.[27]
The drivers of vaccine hesitancy, vaccine refusal, and low uptake—and how to address them—are very context-specific
Addressing household fears and concerns around vaccination is a priority, but evaluations often focus on interventions in high-income countries. [28] Lessons and tools based on those settings may not be generalizable owing to the context-specific nature of fears.[29] Low demand for immunization services also stems from more than just fears about side effects. According to the most recent assessment of the Global Vaccine Action Plan, 87 percent of countries reported some levels of hesitancy, but concerns about the risks of immunization represented only a third of reported reasons for low demand.[30] Research suggests a lack of awareness about the need for vaccination/subsequent doses, distance from clinics, lack of vaccinators, and affordability are all reasons for incomplete or non-vaccination.[31] More research is needed to understand the drivers of low demand and to rigorously test promising interventions to improve coverage (e.g., cash transfers) in different settings.
Recommendations for Gavi’s Future Approach
1. Reconsider the scope of eligibility and transition criteria to account for low or back-sliding coverage rates
Given stark coverage issues faced by some countries that have already transitioned (e.g., Angola), Gavi should revisit the issue of expanding its eligibility criteria. Expanding the set of eligibility criteria may allow Gavi to more effectively target its resources to areas with the highest need. If those conversations proceed, it may prove beneficial to make access to certain streams of funding contingent on coverage rate improvements.
2. Support specific vaccine delivery interventions that rigorous impact evaluations have identified as effective and cost-effective
Supported interventions could address low or decreasing demand for immunization, vaccine refusal or hesitancy, health worker shortages, and other key issues. Support for interventions that have not been rigorously evaluated or have only limited evidence should hinge on an independent evaluation. The limited number of studies considering costs should also expand to evaluations of the relative cost-effectiveness of campaigns versus routine immunization and specific ways those approaches can be more complementary.[32]
3. Work with other donors to understand the broader macro fiscal context in supported countries
Gavi should monitor indicators of potential economic vulnerability/volatility, such as oil prices for commodity exporters, that may affect the availability of domestic funding for immunization activities. This work should be completed in coordination with other donors, such as the Global Fund, since findings may have implications for their programming efforts and thus donor alignment.
4. Explore strategies to minimize the cost of introducing and routinizing new vaccines
As Gavi continues to work on vaccine introduction and discuss additions to its portfolio (e.g., the hepatitis B birth dose and booster vaccines for DTP), it should consider what strategies may prove useful in minimizing the cost of introducing and routinizing new vaccines. For example, improvements in DTP, Hib, and Hep B coverage since 2000 suggest that combinations like pentavalent may be an effective way of improving coverage rates for numerous vaccines at once.[33] There may be scope for the hexavalent vaccine that includes IPV, which alone has variable coverage rates.
5. Support improved data collection
Given the time lag between most Demographic and Health Surveys, Gavi should support smaller-scale data collection efforts that focus on measuring effective coverage and improving the robustness of data documented in child health cards. Introducing intermittent but rigorous data checks in subnational areas with low coverage/high concentrations of under-immunized children may prove particularly useful since some newer Health System Strengthening grants already target those areas.
This note is part of a series on the future of Gavi. You can find the full list of notes here:
[1] Gavi, “2016-2020 Strategy: Progress, Challenges, and Risks” (Gavi, the Vaccine Alliance, November 2018), https://www.gavi.org/about/governance/gavi-board/minutes/2018/28-nov/minutes/03---2016-2020-strategy---progress-challenges-and-risks/.
[2] Gavi, “2016-2020 Strategy Indicator Definitions” (Gavi, the Vaccine Alliance, 2015), https://www.gavi.org/library/gavi-documents/strategy/gavi-2016-2020-strategy-indicator-definitions/.
[3] Gavi, “2016-2020 Mid-Term Review Report” (Gavi, the Vaccine Alliance, November 2018).
[4] Seth Berkley, “Mid-Term Review Presentation” (December 11, 2018), https://www.gavi.org/library/audio-visual/presentations/dr-seth-berkley-mid-term-review-presentation/.Page 23 lists vaccines introduced and supplied via campaigns since 2016: pneumococcal, rotavirus, measles, measles-rubella, meningitis A, human papillomavirus (HPV), Japanese encephalitis, and inactivated polio vaccine (IPV).
[5] Gavi, “2016-2020 Strategy: Progress, Challenges, and Risks,” November 2018.
[6] Comparisons of the percentage point change in DTP 3 coverage between 2010 and 2012 show positive changes more often than negative or no changes.
[7] Only some countries ever supported by Gavi had Standard DHS (not MIS or AIS) data available for 2016, 2017, or 2018: Angola, Armenia, Burundi, Ethiopia, Haiti, India, Malawi, Myanmar, Nepal, Pakistan, Senegal, Tajikistan, Tanzania, Timor-Leste, and Uganda.
[8] WHO, Reported Cases of Selected Vaccine Preventable Diseases (VPDs) (Distributed by World Health Organization, 2018), https://www.who.int/immunization/monitoring_surveillance/data/en/.
[9] “Joint Appraisal Report 2017 - Nigeria” (Gavi, March 2017), https://www.gavi.org/country/nigeria/documents/; “Joint Appraisal Report 2018 - Pakistan” (Gavi, n.d.); “Joint Appraisal Report 2018 - Honduras” (Gavi, n.d.).
[10] “Joint Appraisal Report 2017 - Nigeria”; Gavi Full Country Evaluations Team, “Overview of Gavi Full Country Evaluations Findings: Zambia 2013-2016” (Institute for Health Metrics and Evaluation, June 13, 2017), http://www.healthdata.org/policy-report/overview-gavi-full-country-evaluations-findings-2013-2016-zambia.
[11] Gavi Full Country Evaluations Team, “Overview of Gavi Full Country Evaluations Findings: Mozambique 2013-2016” (Institute for Health Metrics and Evaluation, June 13, 2017), www.healthdata.org/policy-report/overview-gavi-full-country-evaluations-findings-2013-2016-mozambique; Gavi Full Country Evaluations Team, “Overview of Gavi Full Country Evaluations Findings: Bangladesh 2013-2016” (Institute for Health Metrics and Evaluation, June 13, 2017), http://www.healthdata.org/policy-report/overview-gavi-full-country-evaluations-findings-2013-2016-bangladesh; High wastage rates can drive under-immunization by depleting available supplies, but poorly designed or communicated policies to address wastage, particularly for multi-dose vials, can also lead health workers to turn away children due to insufficient demand (Aaron S. Wallace et al., “Vaccine Wastage in Nigeria: An Assessment of Wastage Rates and Related Vaccinator Knowledge, Attitudes and Practices,” Vaccine 35, no. 48, Part B (December 4, 2017): 6751–58, https://doi.org/10.1016/j.vaccine.2017.09.082.)
[12] Pamela Constable, “Pakistan, on Verge of Eradicating Polio Virus, Faces Human Hurdles,” The Washington Post, March 5, 2019, https://www.washingtonpost.com/world/asia_pacific/pakistan-on-verge-of-eradicating-polio-virus-faces-human-hurdles/2019/03/04/8758b01c-353d-11e9-8375-e3dcf6b68558_story.html?utm_term=.5d6f8de7e201; “Joint Appraisal Report 2018 - India” (Gavi, February 2019), https://www.gavi.org/country/india/documents/jas/joint-appraisal-india-2018/.
[13] Gavi, “2016-2020 Strategy: Progress, Challenges, and Risks,” November 2018.
[14] Gavi Full Country Evaluations Team, “Overview of Gavi Full Country Evaluations Findings: Mozambique 2013-2016.”
[15] Charity Warigon et al., “Demand Creation for Polio Vaccine in Persistently Poor-Performing Communities of Northern Nigeria: 2013–2014,” The Journal of Infectious Diseases 213, no. suppl_3 (May 1, 2016): S79–85, https://doi.org/10.1093/infdis/jiv511.
[16] International Institute for Population Sciences (IIPS) and Macro International, “National Family Health Survey (NFHS-3), 2005-06: India: Volume I” (IIPS, 2007).The first, second, and third dose of DTP had coverage rates of 76, 66.7 and 55.3 percent compared to the corresponding doses of polio which had coverage rates of 93.1, 88.8, and 78.2 percent.
[17] Gavi, “2016-2020 Strategy: Progress, Challenges, and Risks” (Gavi, the Vaccine Alliance, November 2018), https://www.gavi.org/about/governance/gavi-board/minutes/2018/28-nov/minutes/03---2016-2020-strategy---progress-challenges-and-risks/.The document states that “risk that frequent or unplanned campaigns may undermine capacity of governments to manage routine immunization services has increased and [has] now been determined as being outside of appetite.”
[18] Abt Associates, “Benin’s Immunization Financing Landscape: What Do the 2014 and 2015 Health Accounts in Benin Tell Us?,” Abt Associates Policy Brief (Abt Associates, 2017), https://www.abtassociates.com/insights/publications/report/benins-immunization-financing-landscape-what-do-the-2014-and-2015.
[19] Nicolas A. Menzies et al., “The Cost Determinants of Routine Infant Immunization Services: A Meta-Regression Analysis of Six Country Studies,” BMC Medicine 15, no. 1 (October 6, 2017): 178, https://doi.org/10.1186/s12916-017-0942-1; Fangli Geng et al., “The Cost Structure of Routine Infant Immunization Services: A Systematic Analysis of Six Countries,” Health Policy and Planning 32, no. 8 (October 1, 2017): 1174–84, https://doi.org/10.1093/heapol/czx067.
[20] Rachel Silverman, “Projected Health Financing Transitions: Timeline and Magnitude,” CGD Working Paper (Washington, DC: Center for Global Development, 2018), /publication/projected-health-financing-transitions-timeline-and-magnitude.
[21] Strategic Advisory Group of Experts on Immunization, “2018 Assessment Report of the Global Vaccine Action Plan” (Geneva: World Health Organization, 2018), https://apps.who.int/iris/bitstream/handle/10665/276967/WHO-IVB-18.11-eng.pdf.
[22] K. E. Gallagher, D. S. LaMontagne, and D. Watson-Jones, “Status of HPV Vaccine Introduction and Barriers to Country Uptake,” Vaccine, Preventing Cervical Cancer: How much HPV Vaccine do we need?, 36, no. 32, Part A (August 6, 2018): 4761–67, https://doi.org/10.1016/j.vaccine.2018.02.003.
[23] Gavi Full Country Evaluations Team, “Gavi Full Country Evaluations: 2016 Annual Dissemination Report: Cross-Country Findings” (Seattle, WA: Institute for Health Metrics and Evaluation, 2017).
[24] Gavi, “Gavi 5.0: The Alliance’s 2021-2025 Strategy” (Gavi, the Vaccine Alliance, November 2018), https://www.gavi.org/about/governance/gavi-board/minutes/2018/28-nov/minutes/11---gavi-5-0---the-alliance-s-2021-2025-strategy/.
[25] Yot Teerawattananon and Nattha Tritasavit, “A Learning Experience from Price Negotiations for Vaccines,” Vaccine, Expanding the Evidence Base to Inform Vaccine Introduction: Program Costing and Cost-effectiveness Analyses, 33 (May 7, 2015): A11–12, https://doi.org/10.1016/j.vaccine.2014.12.050; Dagna Constenla and Samantha Clark, “Financing Dengue Vaccine Introduction in the Americas: Challenges and Opportunities,” Expert Review of Vaccines 15, no. 4 (April 2, 2016): 547–59, https://doi.org/10.1586/14760584.2016.1134329; Panji F. Hadisoemarto, Michael R. Reich, and Marcia C. Castro, “Introduction of Pentavalent Vaccine in Indonesia: A Policy Analysis,” Health Policy and Planning 31, no. 8 (October 1, 2016): 1079–88, https://doi.org/10.1093/heapol/czw038.
[26] Gavi, “2016-2020 Strategy Indicator Definitions” (Gavi, the Vaccine Alliance, 2015), https://www.gavi.org/library/gavi-documents/strategy/gavi-2016-2020-strategy-indicator-definitions/.
[27] K. Ellicott Colson et al., “Comparative Estimates of Crude and Effective Coverage of Measles Immunization in Low-Resource Settings: Findings from Salud Mesoamérica 2015,” PLOS ONE 10, no. 7 (July 2, 2015): e0130697, https://doi.org/10.1371/journal.pone.0130697.
[28] Sara Cooper et al., “Vaccine Hesitancy – a Potential Threat to the Achievements of Vaccination Programmes in Africa,” Human Vaccines & Immunotherapeutics 14, no. 10 (October 3, 2018): 2355–57, https://doi.org/10.1080/21645515.2018.1460987; Jessica Kaufman et al., “Face‐to‐face Interventions for Informing or Educating Parents about Early Childhood Vaccination,” Cochrane Database of Systematic Reviews, no. 5 (2018), https://doi.org/10.1002/14651858.CD010038.pub3.
[29] Noni E. MacDonald, Robb Butler, and Eve Dubé, “Addressing Barriers to Vaccine Acceptance: An Overview,” Human Vaccines & Immunotherapeutics 14, no. 1 (January 2, 2018): 218–24, https://doi.org/10.1080/21645515.2017.1394533; Gretchen J. Domek et al., “Measuring Vaccine Hesitancy: Field Testing the WHO SAGE Working Group on Vaccine Hesitancy Survey Tool in Guatemala,” Vaccine 36, no. 35 (August 23, 2018): 5273–81, https://doi.org/10.1016/j.vaccine.2018.07.046.
[30] Strategic Advisory Group of Experts on Immunization, “2018 Assessment Report of the Global Vaccine Action Plan.”
[31] Mark Rohit Francis et al., “Factors Associated with Routine Childhood Vaccine Uptake and Reasons for Non-Vaccination in India: 1998–2008,” Vaccine, Vaccine Hesitancy: Towards a Better Understanding of Drivers and Barriers to Awareness, Acceptance and Activation, 36, no. 44 (October 22, 2018): 6559–66, https://doi.org/10.1016/j.vaccine.2017.08.026; Atif Riaz et al., “Reasons for Non-Vaccination and Incomplete Vaccinations among Children in Pakistan,” Vaccine 36, no. 35 (August 23, 2018): 5288–93, https://doi.org/10.1016/j.vaccine.2018.07.024.
[32] Sachiko Ozawa, Tatenda T. Yemeke, and Kimberly M. Thompson, “Systematic Review of the Incremental Costs of Interventions That Increase Immunization Coverage,” Vaccine 36, no. 25 (June 14, 2018): 3641–49, https://doi.org/10.1016/j.vaccine.2018.05.030; Averi Chakrabarti, Karen A. Grépin, and Stéphane Helleringer, “The Impact of Supplementary Immunization Activities on Routine Vaccination Coverage: An Instrumental Variable Analysis in Five Low-Income Countries,” PLOS ONE 14, no. 2 (February 14, 2019): e0212049, https://doi.org/10.1371/journal.pone.0212049.
[33] Sarah Dykstra et al., “Regression Discontinuity Analysis of Gavi’s Impact on Vaccination Rates” (Manuscript in preparation., 2019).
Topics
CITATION
Oroxom, Roxanne, and Amanda Glassman. 2019. Vaccine Introduction and Coverage in Gavi-Supported Countries 2015-2018: Implications for Gavi 5.0. Center for Global Development.DISCLAIMER & PERMISSIONS
CGD's publications reflect the views of the authors, drawing on prior research and experience in their areas of expertise. CGD is a nonpartisan, independent organization and does not take institutional positions. You may use and disseminate CGD's publications under these conditions.