We don’t know as much as we should about the real-world costs and effectiveness of climate mitigation projects in low- and middle-income countries. This blog looks at what we do know and finds that real-world cost-effectiveness appears to be orders-of-magnitude different between projects even in the same sector. If this is so, then a tighter focus on cost-effectiveness could shift investments to more effective strategies, yielding substantial gains in emissions mitigated.
At present, only two funders report systematically on expected and actual project-level emissions impacts, and there is almost no gold-standard evaluation evidence. To enable policymakers to learn as quickly as possible about the most- and least-effective approaches, all funders should routinely publish their anticipated and real-world mitigation and costs at project level.
What do evaluations say about aid spent on climate?
Since 2012, development agencies have consistently spent around US$10 billion per year on aid with a principal emissions mitigation objective, as well as a proportion of the rising spend channelled through multilateral institutions. That figure rose gradually from less than a billion dollars in 2000. What does the evidence say about what that spend is achieving?
To answer this question, ideally we’d want independent impact evaluations of real projects associated with reliable costs data. In areas of development policy like education and public health, the last 15 years have seen a huge growth in the number of evaluations that meet this standard. But unfortunately, such evidence is very thin on the ground for emissions mitigation interventions in low- and middle-income countries. In 3ie’s repository of over 3,700 impact evaluations relating to development, just eight are tagged with “climate mitigation.” This compares to 795 evaluations tagged with “child health,” 347 evaluations tagged with “access to education,” 394 evaluations tagged with “social safety nets,” and 38 evaluations tagged with “water pollution,” for example. A 2018 systematic review of economic studies of the cost-effectiveness of different emissions mitigation interventions found only 50 studies that met its inclusion criteria, of which just two reported effectiveness and real-world costs for low- or middle-income countries. These studies report very low cost estimates for anti-deforestation and reforestation interventions in Uganda and Malawi—good news certainly, but not sufficient evidence on which to judge the relative cost-effectiveness of the very many different mitigation options available to low- and middle-income countries.
Engineering estimates of cost-effectiveness
Whilst full evaluations are in short supply, at first glance it can appear that we know plenty about the cost of different options for achieving emissions mitigation in low- and middle-income countries. The most comprehensive and high-profile attempts to measure this involve the construction of marginal abatement cost curves (MACCs). Figure 1 shows the most famous MACC, produced by McKinsey in 2010. It is an engineering estimate of the cost per tonne of reducing emissions for various available technologies based on the difference in cost per unit of installed capacity between a reference technology and a greener alternative, as well as the potential total abatement that could be achieved by employing each technology. The curve pictured is global but is a weighted average of more sectorally and geographically specific cost curves.
Figure 1. Global GHG abatement cost curve beyond business-as-usual – 2030
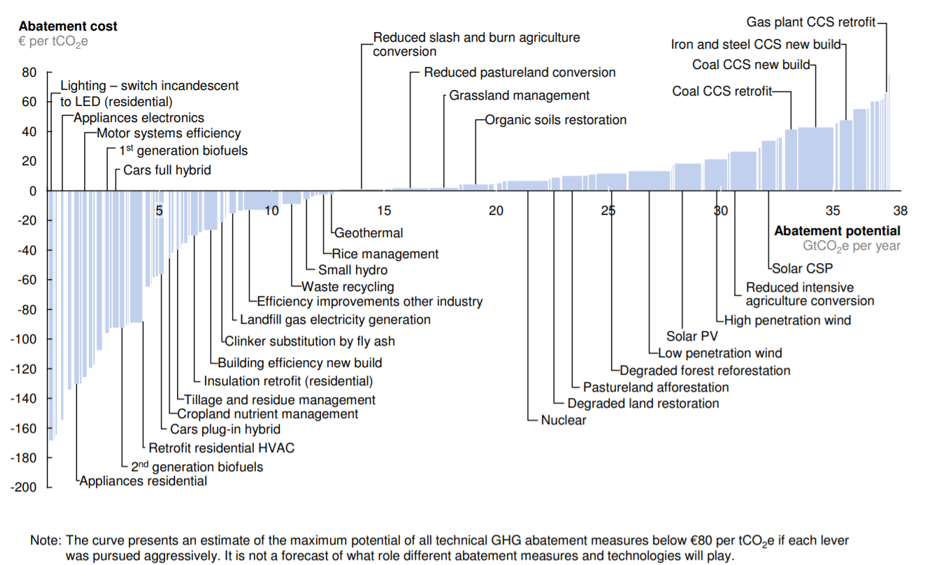
Source: Version 2.1 of the McKinsey Global Greenhouse Gas Abatement Cost Curve
MACCs are also produced for particular countries or regions to help policymakers identify the best mitigation options to pursue. Figure 2 is an example from 2013 produced by the World Bank for Nigeria. This MACC predicts huge cost-savings as well as large mitigation potential for technologies 1 and 2, energy efficient lighting off- and on-grid. It also predicts low costs of $1 per tCO2e mitigated for technologies like concentrated solar power (technology 21).
Figure 2. MACC for Nigeria (selected low-carbon interventions)
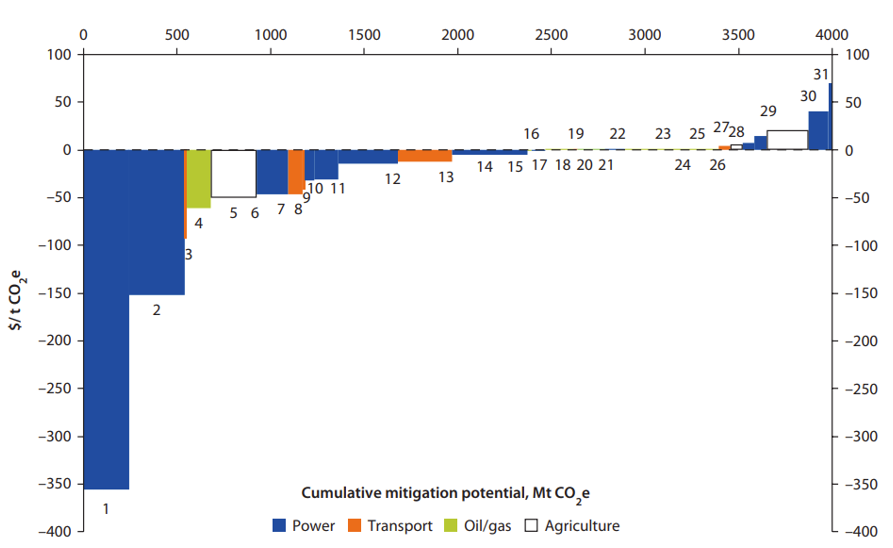
Source: Low-Carbon Development: Opportunities for Nigeria
Although MACCs provide a useful starting point for estimating the cost-effectiveness of different mitigation options, they are based on models that are blind to many non-engineering determinants of real-world cost-effectiveness, like behavioural response. Most importantly, they may be based on unrealistic assumptions. The so-called “efficiency-gap” puzzle—why investment in energy efficiency is so much lower than the rational level according to such models—is increasingly being resolved with the realisation that real-world returns to efficiency investments are much, much lower than the models predict.
Agency-reported results of climate effectiveness
So, if there are not enough independent evaluations to tell us how cost-effective different mitigation options might be in the real world, what evidence of a lower quality do we have, besides pure engineering estimates like MACCs?
The richest potential source of data in this middle-ground of reliability is self-reported cost-effectiveness data from development agencies and international finance institutions. For example, one of the key performance indicators for programmes funded using UK International Climate Finance (ICF) is emissions mitigation, and cost data for these programmes are publicly reported. Unfortunately, although the UK government reports top-level annual results including tonnes of CO2 equivalent emissions mitigated for ICF programmes (31 million tonnes between 2011 and 2020, we are told), disaggregated, programme-level data are not systematically reported. This is a picture mirrored at other development agencies and at financial institutions, where annual reports often claim levels of emissions mitigation, and cost data are easy to find, but disaggregated emissions mitigated per project are not made available. This is a missed opportunity that must be rectified in order for the development community to learn collectively, as quickly as possible, what is working well and what is not.
Some important examples of good practice can be found. The Green Climate Fund reports expected emissions mitigation and costs for approved funding proposals, enabling an initial analysis led by our former colleague Arthur Baker last year. Similarly, the World Bank Climate Investment Funds’ (CIF) Clean Technologies Fund (CTF) reports anticipated cost-effectiveness for its mitigation programmes. In addition, the CTF reports emissions mitigation progress to date. This data is a rich source of evidence on the real-world performance of different emissions mitigation options in low- and middle-income countries, with programme-level data reported for 82 projects across 15 different groups of technologies.
By recoding GCF programmes to cohere with the specific technology categories used by the CTF, we have created an aggregated dataset of first-cut or “naïve” cost-effectiveness estimates for programmes funded by both funds. Figure 3 shows expected cost-effectiveness for mitigation programmes in various sectors funded by either fund. This estimate is calculated simply by dividing total programme costs by projected emissions reductions. We refer to it as naïve as it takes these estimates at face value: it is possible that projected estimates ignore some more speculative and potentially large emissions impacts of projects—though we argue that if this is the aim, such estimates should also be included probabilistically.
Figure 3. Expected cost-effectiveness of GCF and CTF programmes by approach (log scale, cost [USD] per tonne of CO2 equivalent averted)

Authors’ own calculations from CTF and GCF results data. TR = transport, EE = energy efficiency, RE = renewable energy, FOLU = forestry and other land use
What is striking from looking at this data is that even the anticipated costs for programmes are different by orders of magnitude both within and between sectors. Figure 3 uses a log scale in order to be legible, but that should not detract from the impact of the data being reported. It is striking that some groups of projects are expected to be tens or hundreds of times more cost-effective than others. This is true whether you consider total project cost, as above, or only the money invested by the funds themselves, before co-financing.
What can we learn from this analysis?
Within and between specific approaches to mitigation, there are order-of-magnitude differences in expected cost-effectiveness on this naïve measure. Some of the categories used by the CTF are too general to permit much analysis of relative cost-effectiveness because projects are likely to be very different from each other, for example those categorised as “Renewable Energy/Energy Efficiency.” However, other categories are more specific. For example, the sustainable forestry programmes identified cost between $10 and $13 per tCO2e mitigated. This is a low and consistent cost. The minimum programme cost data reveals cost-effective interventions in every sector analysed. Even in transport, where programmes are generally high-cost, one funded intervention is expected to mitigate emissions at a cost of $31 per tCO2e mitigated.
The most striking takeaway from the combined CTF and GCF data is the amount of variation in cost-effectiveness of programmes both within and between sectors. The most cost-effective on-grid solar project had a total project cost of $0.83 per tCO2e mitigated, whereas the least cost-effective cost $238 per tCO2e. This is a more than 200x difference in cost-effectiveness. Similarly the mean cost per tCO2e mitigated for an anti-deforestation programme was $5.68, whereas the mean cost for a mass transit programme was $1,288, again a more than 200x difference.
Of course, as with any climate-mitigation intervention, these projects all have different development co-benefits. Some difference in cost-effectiveness on the single dimension of emissions reductions is explained by different levels of contribution to economic growth, public health, and so on. Further, some differences in cost-effectiveness are explained by the need for action across multiple sectors to achieve the volume of emissions reductions necessary to avert potentially catastrophic climate change. It is also the case that the CTF has targeted transformative change as its main objective, rather than the narrow cost-effectiveness attributable directly to individual projects. However, given all projects were selected to target transformative change, it is unclear how much difference in cost-effectiveness this objective explains. Furthermore, if transformation is the goal, then reporting could and should be changed such that expected emissions reductions data capture that. Overall, whilst co-benefits or transformative change would explain some variation in cost-effectiveness, the orders- of-magnitude variation we see seem more difficult to explain (given that these are, by definition, mitigation projects).
Lessons for policymakers and development agencies
Our analysis should not be construed as criticising the GCF, CTF, or the CIF in general. In fact, these funders are ahead of others in thinking about and reporting cost-effectiveness. Further, as we cover above, they started from a position of almost no evidence on climate mitigation effectiveness. Both funds have served as a learning lab, experimenting with different approaches to what works in emissions mitigation and adaptation in low- and middle-income countries. They deserve credit for making these estimates and their decision-making available for feedback; and, given the learning potential, other climate mitigation funders should follow suit.
Cost-effectiveness has not been the CTF’s main goal to date. However, cost-effectiveness is one of the six core principles that govern the CTF’s investment decisions. As a recent review of the CTF’s operations noted, the CTF and concessional finance for climate change in general is entering a new phase, where many of the approaches to mitigation are no longer novel. In this new phase, across the international financial institutions and development agencies, a higher priority should be placed on cost-effectiveness at the design stage, and in the learning outcomes targeted by evaluation. If “transformational” impacts beyond the project are part of the rationale, the probability and impact on wider emissions should be included in an analysis.
Development agencies and multilaterals need to know how well they’re doing on cost-effectiveness in order to make the best use of the limited mitigation funds available. Those numbers need to be publicly available to increase knowledge transfer and increase quality through independent scrutiny. That’s especially important if our limited knowledge to date suggests order-of-magnitude differences in cost-effectiveness between projects. We are working on a policy paper that explores what we know about the cost-effectiveness of emissions mitigation interventions in low- and middle-income countries, which will be available soon. Watch this space for more.
Disclaimer
CGD blog posts reflect the views of the authors, drawing on prior research and experience in their areas of expertise. CGD is a nonpartisan, independent organization and does not take institutional positions.