Recommended

CGD NOTE
IDA-20: Donors Must Go Big, and IDA Must Too
The G7 countries pledged a massive scale-up in support of developing-country financing at their recent summit in the UK. How it will be financed remains an open question. But analyzing trends in recent debt flows by lenders to developing countries, and taking stock of the Debt Service Suspension Initiative (DSSI), can provide some important lessons for the G7’s new ambitions.
New data from the World Bank provide a clearer picture of debt flow dynamics. In contrast to debt stock figures (which typically change slowly, but nevertheless account for many of the headlines in financial reporting), debt flows on a net basis (loan disbursements net of borrowers’ repayments) better reflect the experience of ministries of finance in constantly looking for fresh financing to ensure that both their debt servicing obligations and current financing needs are met. These numbers also reveal important dynamics in debt flows in the lead-up to the COVID crisis, which point to significant financing challenges for developing country governments as they now seek to emerge from the crisis.
In assessing the new World Bank data, we find:
-
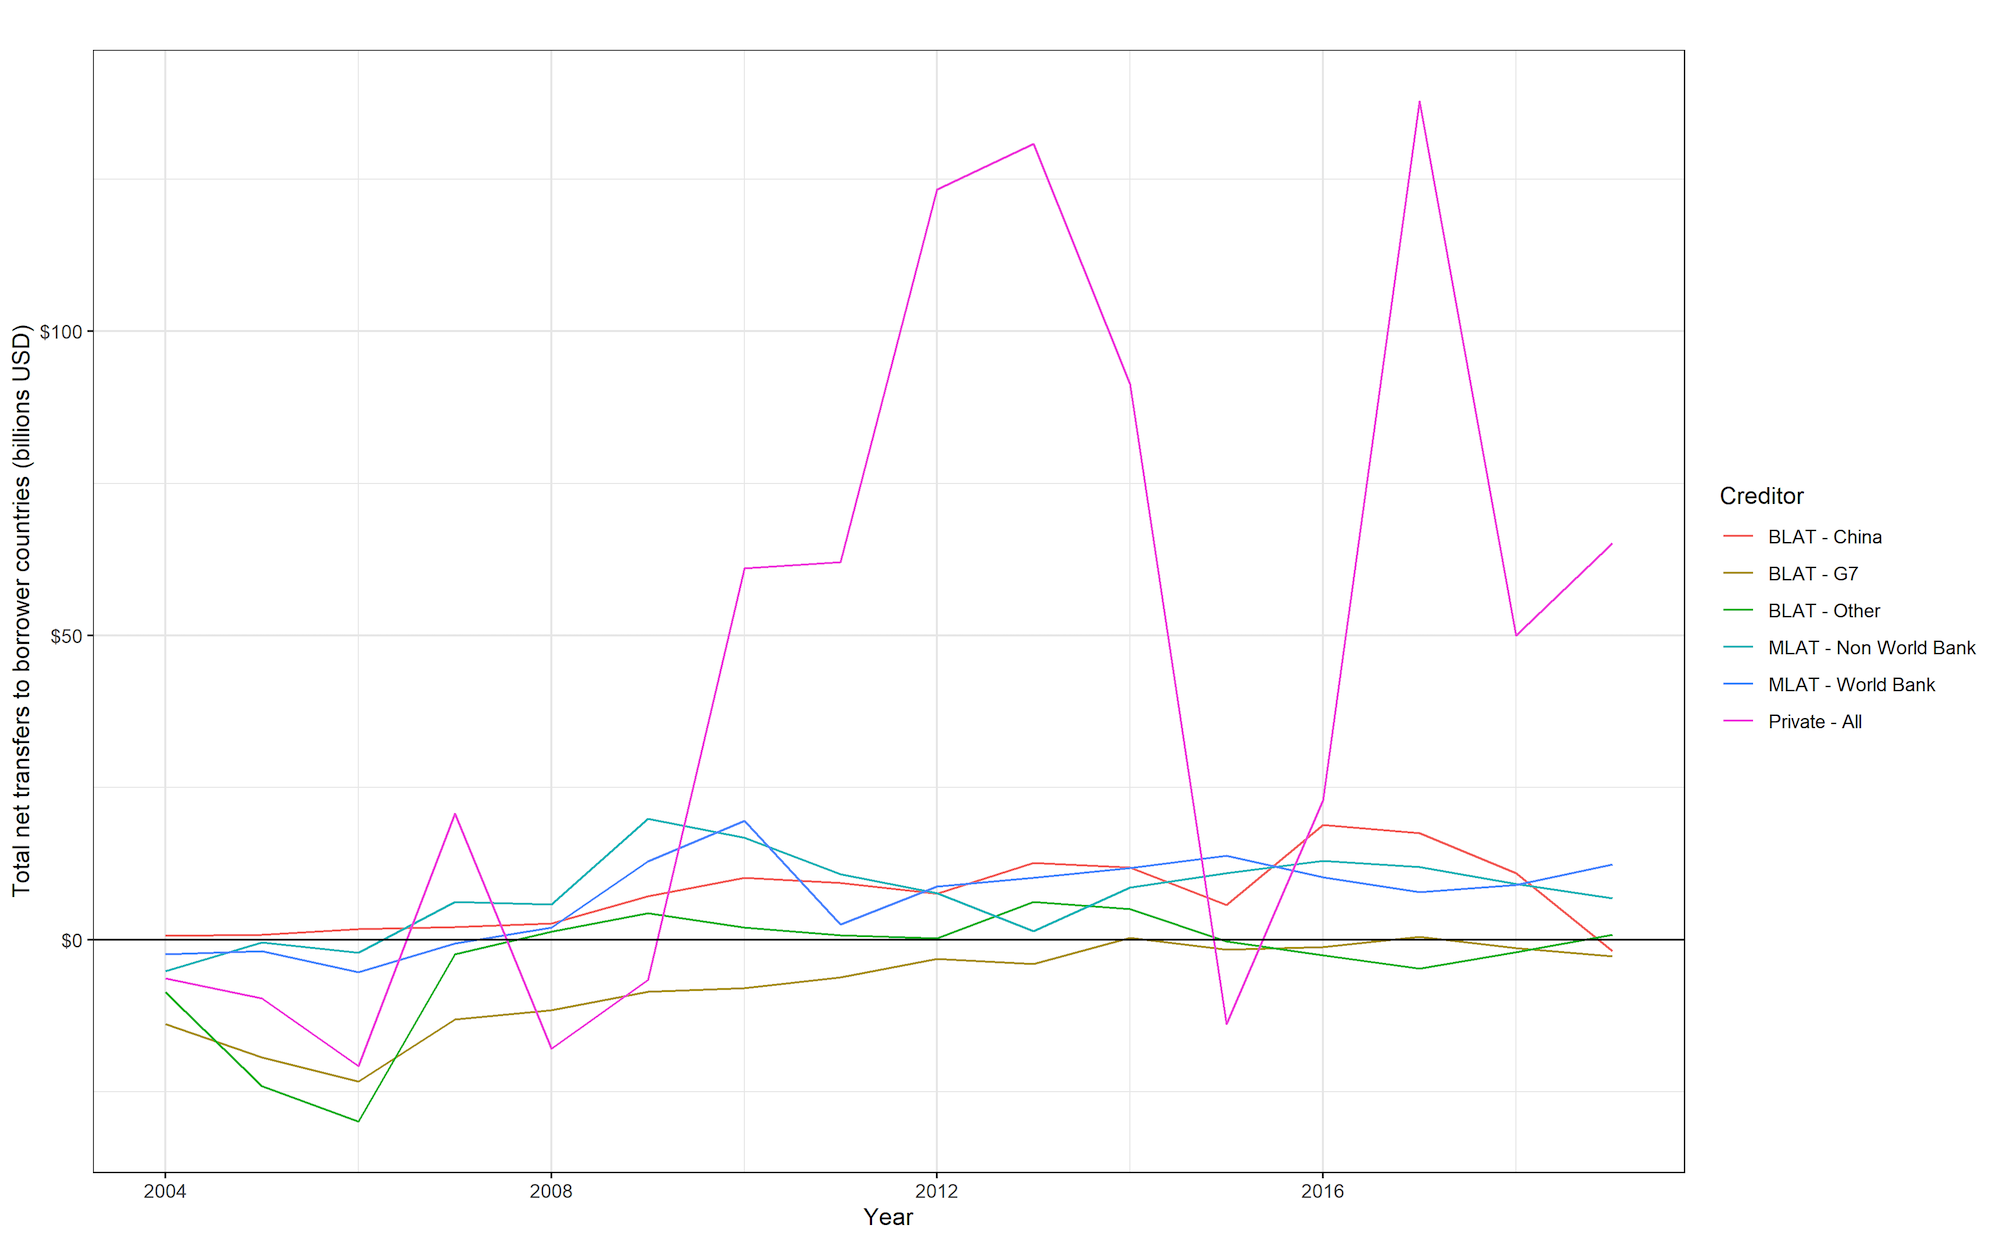
Debt owed to private creditors dominates financing for developing countries, and at the onset of the crisis private flows to developing countries were net positive (Figure 1). Past trends also show how volatile private credit can be, with a financing peak on a net basis above $100 billion in 2013, followed by negative net flows in 2015 and another peak in excess of $100 billion in 2017.
Figure 1. Net transfer to developing country borrowers by creditor (all)

Note: Net transfer refers to new disbursements minus debt service (principal + interest) of public and publicly guaranteed external debt. Total value across 127 developing countries based on data availability.
Source: WB International Debt Statistics 2021
-
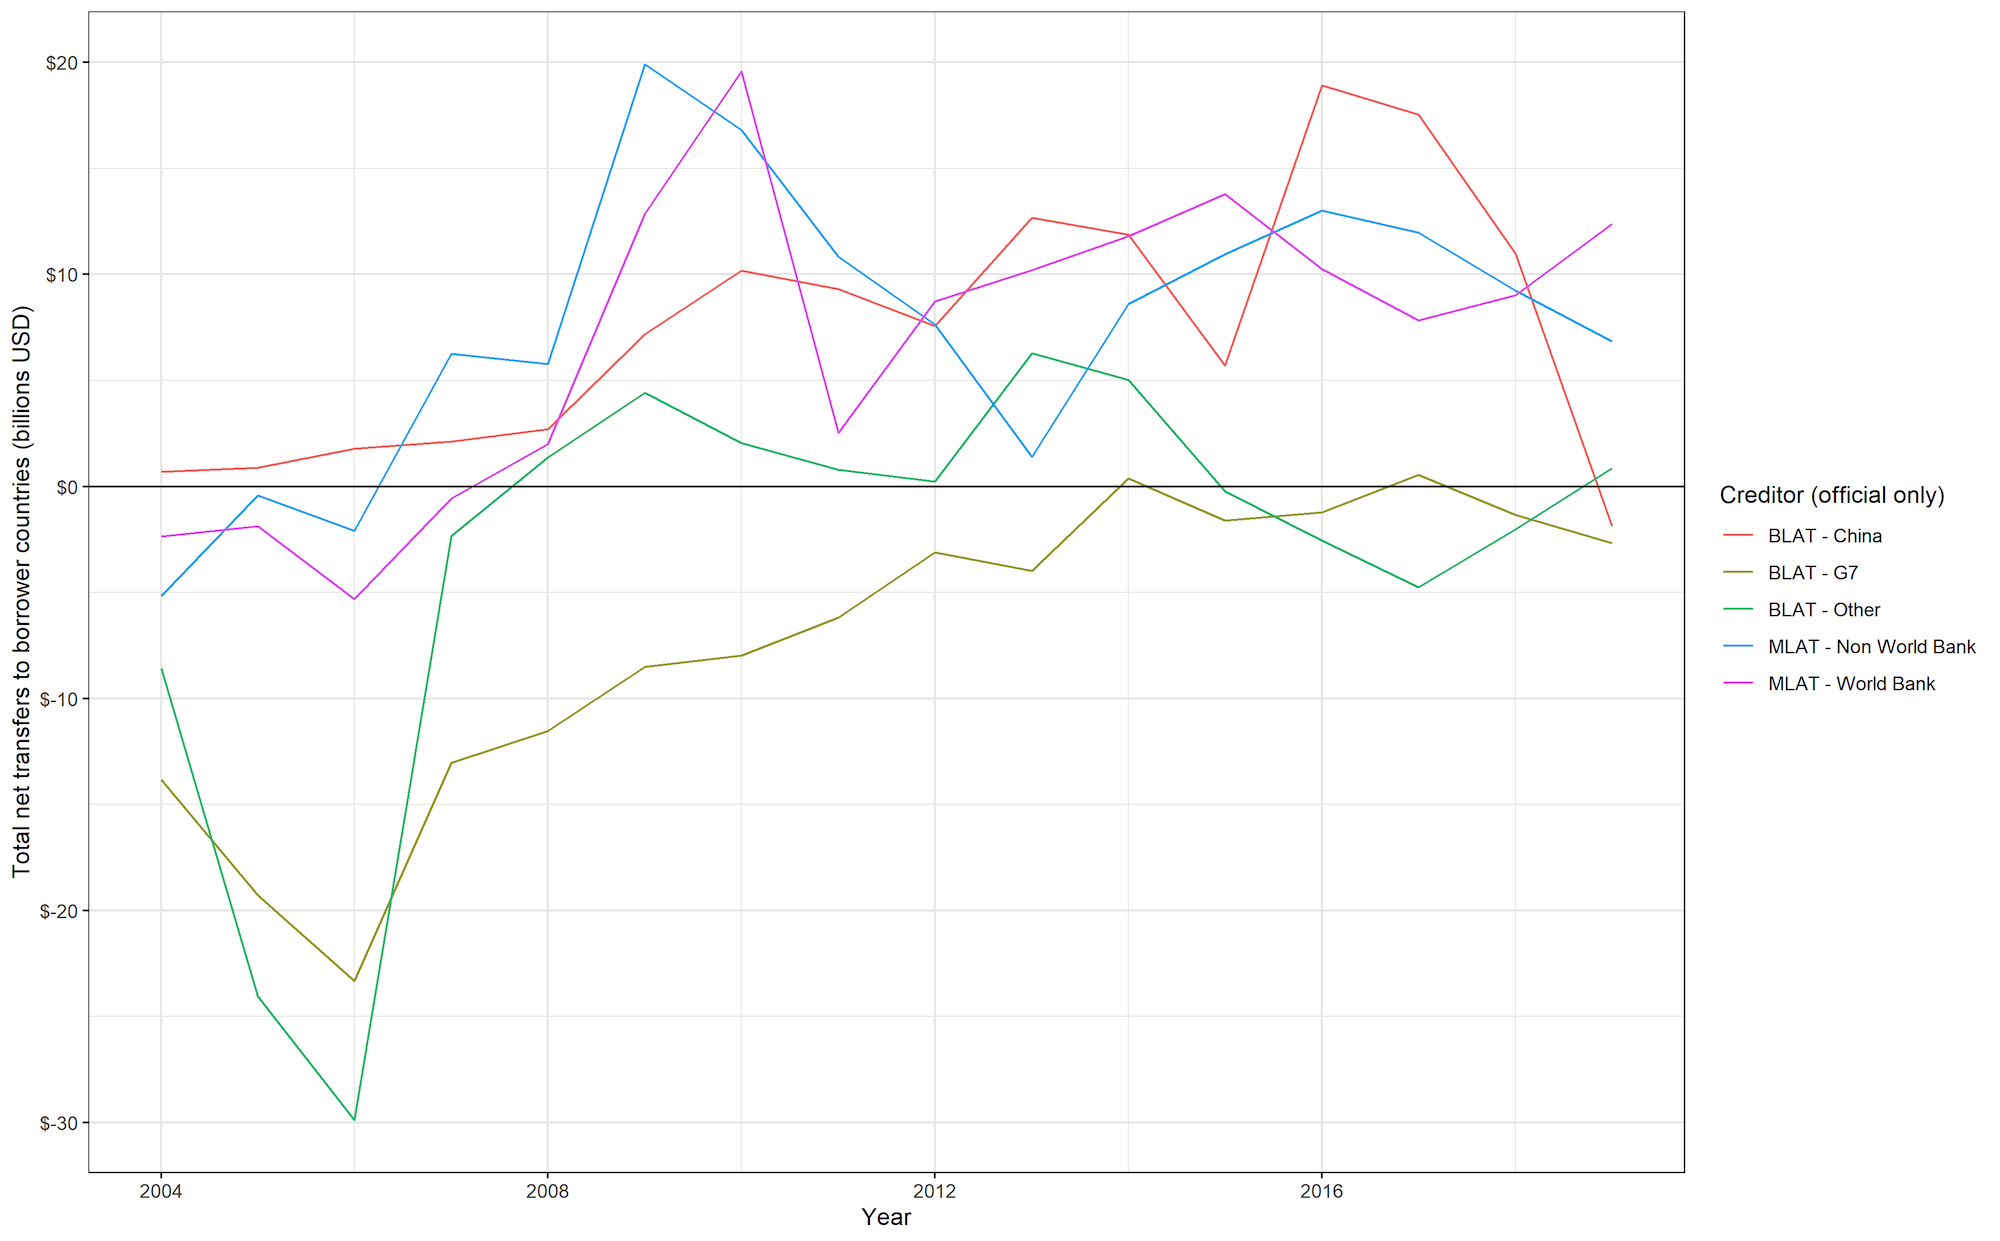
Focusing on official creditors (Figure 2), we find that multilateral creditors were a stable source of financing on a net basis during the years leading up to the current crisis. Other official creditors were also a stable source of financing during the pre-crisis period, with important differences emerging between China and G7 governments over the past decade.
China’s official lenders have been highly pro-cyclical, with peak disbursement amidst a lending boom circa 2016, followed by a sharp reversal into net repayment just when debt pressures started to mount in the borrowing countries.
In contrast, G7 creditors retreated from lending during China’s lending boom. On a net basis, they were largely a non-factor for developing country borrowers during the past decade.
Figure 2. Net transfer to developing country borrowers by official creditors
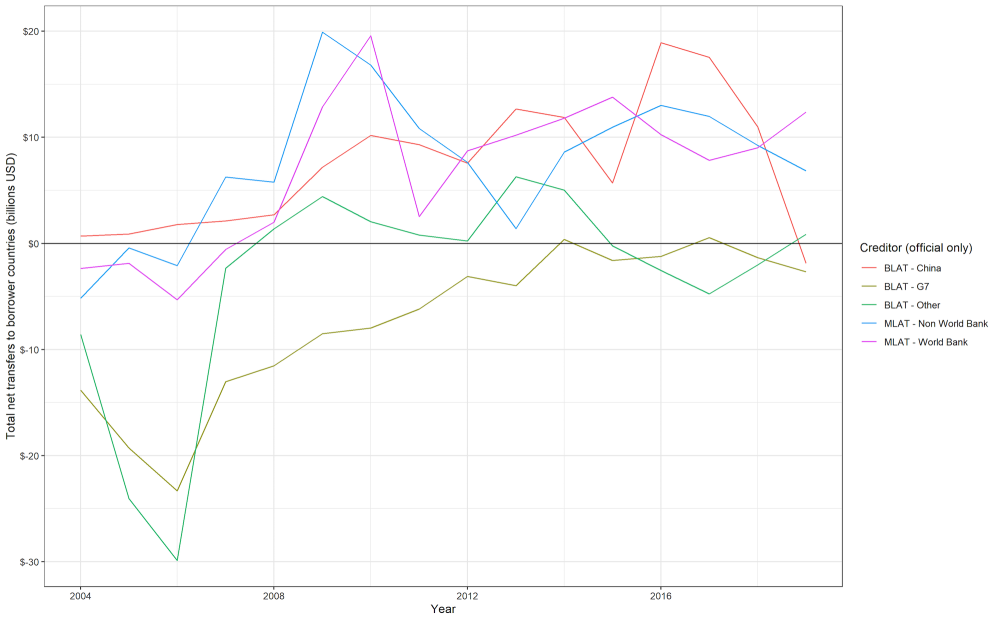
Note: Net transfer refers to new disbursements minus debt service (principal + interest) of public and publicly guaranteed external debt. Total value across 127 developing countries based on data availability.
Source: WB International Debt Statistics 2021
-
China was the dominant bilateral creditor to developing countries over our study period, and unsurprisingly debt flows from China are a major component of total debt flows. But in recent years they have also shown to be highly volatile (Figure 3). From a peak of $19 billion in 2016, Chinese net flows to developing economies plummeted to a negative flow of $1 billion in 2019, with developing countries paying more to Chinese creditors than they were receiving in loan disbursements.
The breakdown of net flows into changes in disbursements and debt servicing flows provides additional insight. A rapid scale-up of disbursements on Chinese loans peaked in 2017. Debt service initially lagged these disbursements, reflecting grace periods on loans, but then overtook disbursements by 2019.
It’s important to recognize the limitations of the World Bank data here, both in capturing the full array of Chinese government-owned lenders, as well as the lack of coverage of borrowing by nominally private entities that could have public ownership or a sovereign guarantee from the borrowing country government. With a narrower scope dominated by the large Chinese policy banks, the collapse in net disbursements in the World Bank data might be exaggerated or otherwise incomplete. For example, to the degree new lending has shifted to other Chinese lenders, or is being channeled on the borrower side through special purpose vehicles, the full net flows picture could look significantly different.
Figure 3. Net transfer to developing country borrowers by Chinese official creditors (with breakdown between disbursements and debt service)
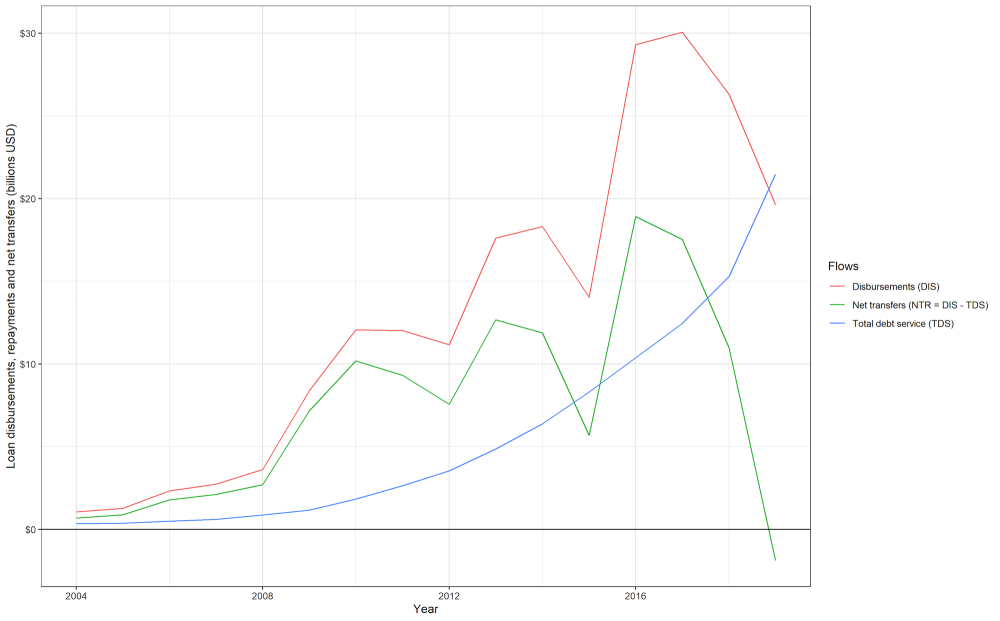
Note: Net transfer refers to new disbursements minus debt service (principal + interest) of public and publicly guaranteed external debt. Total value across 127 developing countries based on data availability.
Source: WB International Debt Statistics 2021
-
Interestingly, the G7 countries’ pledge of new developing country financing at their recent summit in the UK would build on a relatively low level of supportcoming into the crisis (Figure 4). Overall, G7 creditor flows have been much more modest than China’s, but these loans were also in repayment mode for much of the time that Chinese loan disbursements were rapidly scaling up. And on a net basis, as Chinese financing has begun to plummet, the G7 countries have provided little to no additional boost to developing countries.
Figure 4. Net transfer position to developing countries by G7 official creditors
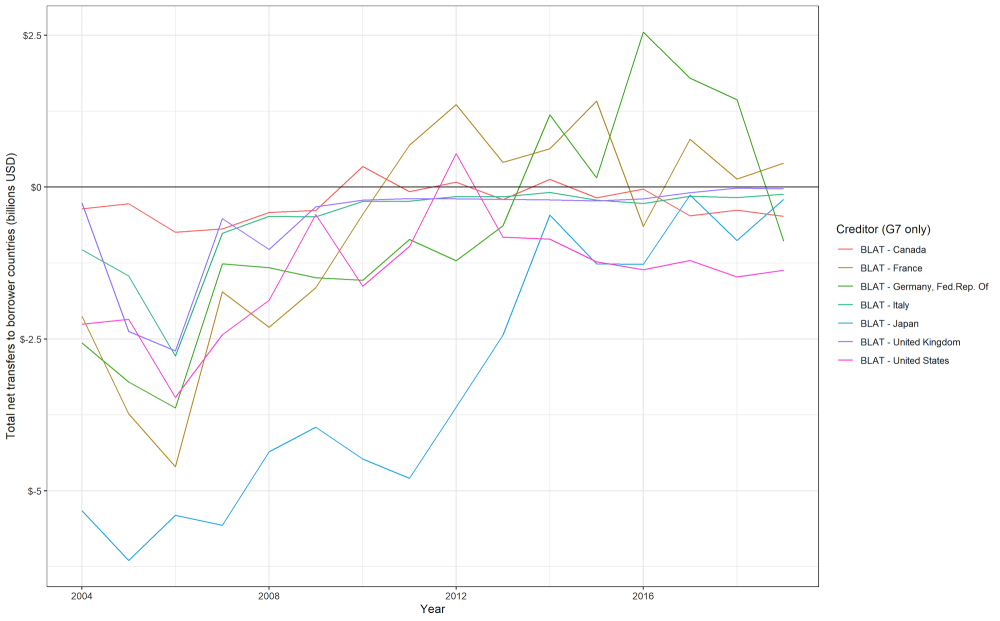
Note: Net transfer refers to new disbursements minus debt service (principal + interest) of public and publicly guaranteed external debt. Total value across 127 developing countries based on data availability.
Source: WB International Debt Statistics 2021
-
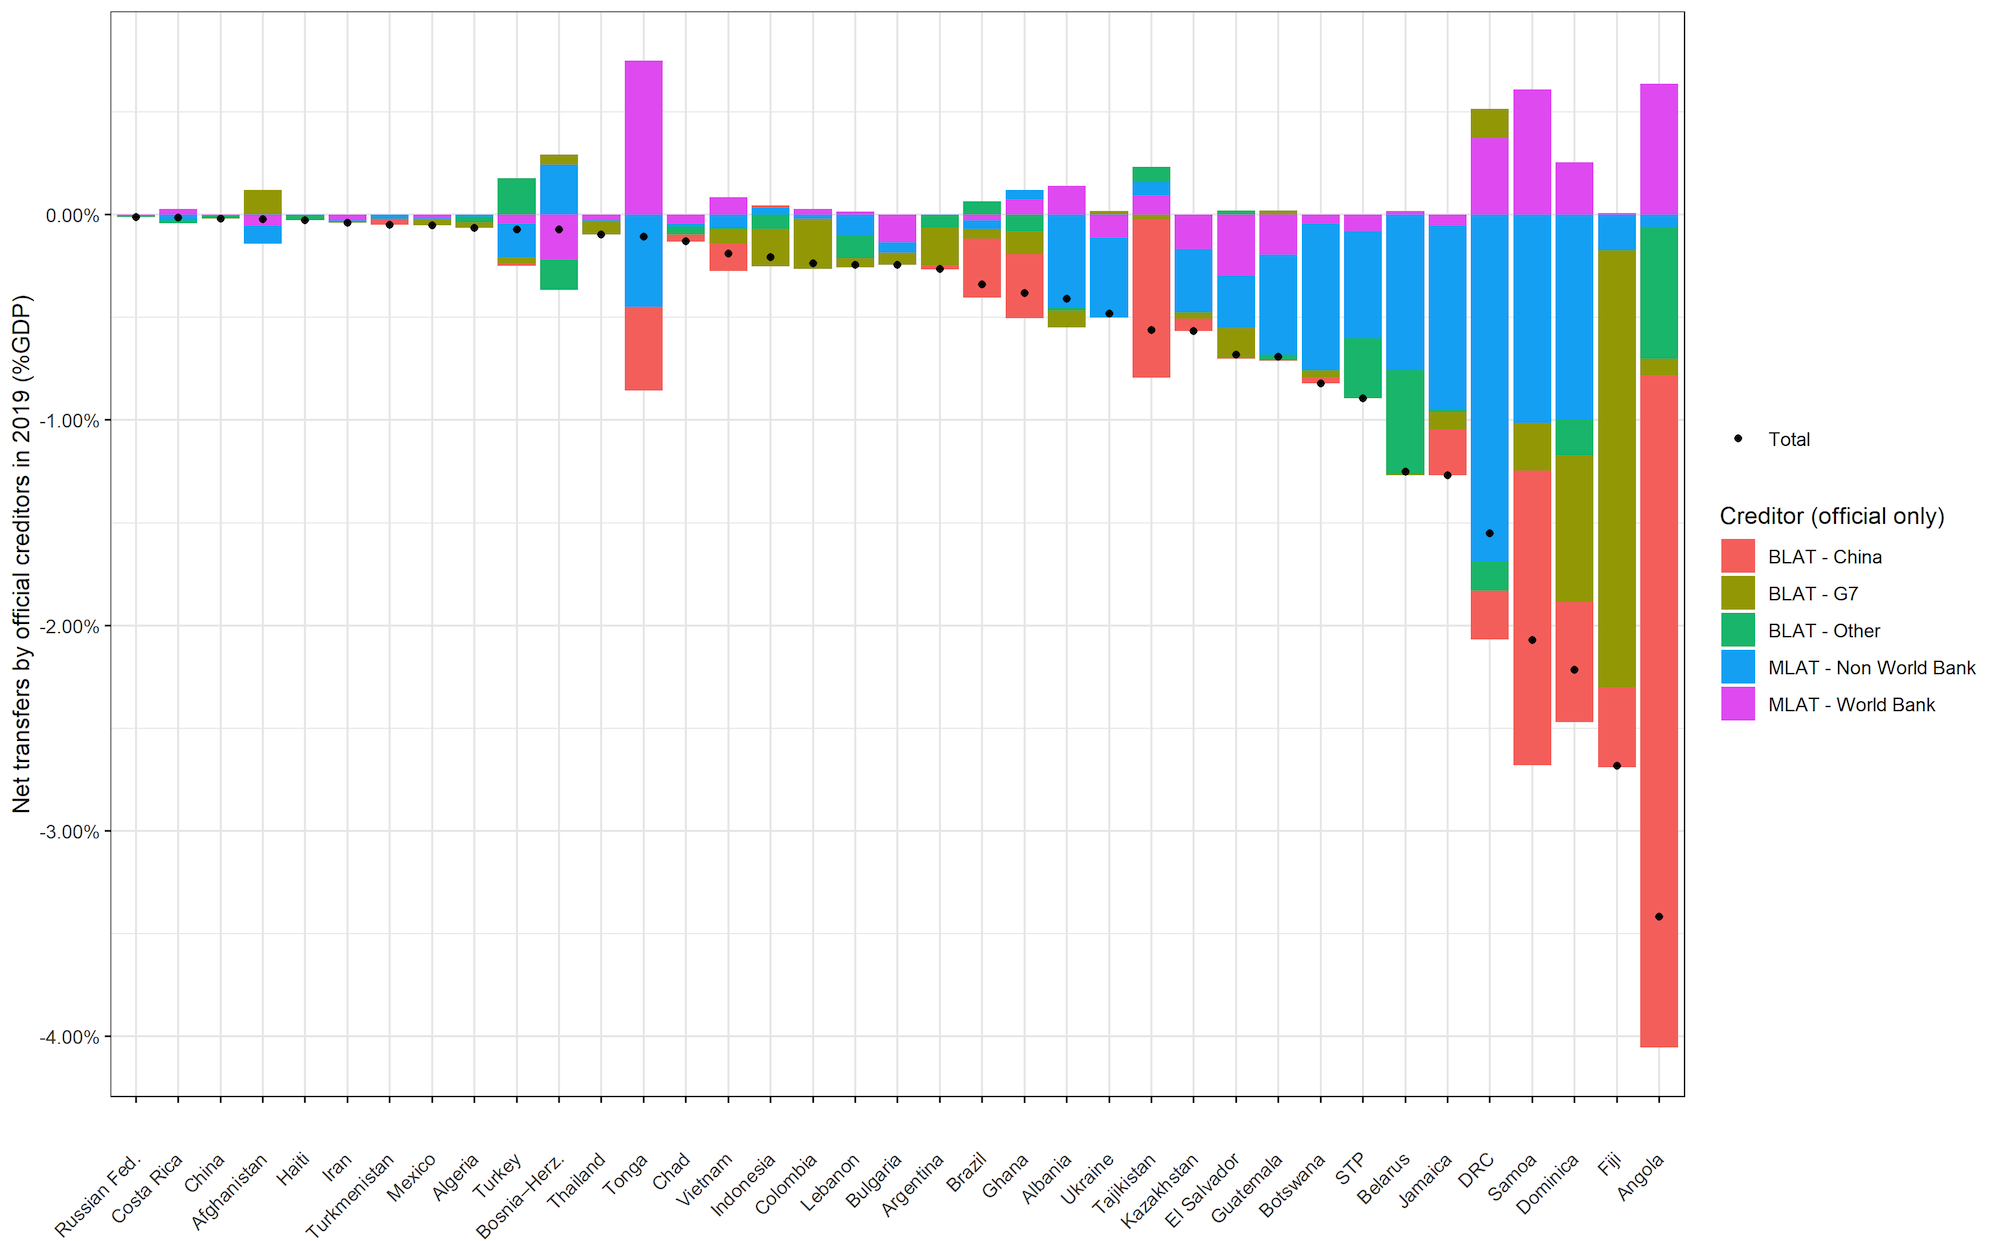
It is also revealing to see these effects on a country-by-country basis (Figure 5). In the year prior to the crisis, 36 developing countries (a third of the total) were already in net repayment mode with their official creditors. Angola tops the chart, with a net repayment to its official creditors (mainly China) of 4 percent of GDP.
Figure 5. Countries where debt service exceeds new disbursements on official debt, 2019

Note: Net transfer refers to new disbursements minus debt service (principal + interest) of public and publicly guaranteed external debt. Values for developing countries where total net transfers on official debt is negative in 2019.
Source: WB International Debt Statistics 2021


The World Bank data assessed here reveal a deep hole in net flows to developing economies emerging just prior to the COVID-19 pandemic. We do not yet have anything close to a comprehensive picture of the degree to which crisis response measures have mitigated this negative turn in financial flows. While data on debt repayment projections by creditor is not readily available globally, the historical net flows data offers clues on what developing country borrowers may face in the months ahead and the degree to which crisis measures are working:
-
The G20’s DSSI was the signature initiative in 2020 to boost developing countries’ financial resources by suspending debt repayments to external creditors. To date, DSSI has led to postponement of debt servicing of over $5 billion in bilateral debt for eligible countries. This represents some relief for these countries, but it’s clear that the initiative failed to obtain the fully array of creditor participation that was envisioned. As a result, the scale of relief under DSSI has been far more modest than was hoped for. For comparison, it’s noteworthy that the DSSI’s $5 billion in payment relief represents just a fraction of the $20 billion drop in net flows from Chinese creditors alone. Further, absent additional debt relief measures, the expiration of DSSI will lead to higher repayment obligations starting in 2022.
-
Private debt will continue to be volatile, expensive, and prone to quick reversal. Private sector participation is any widescale debt relief plan following DSSI also remains highly uncertain, if not highly unlikely. For many governments in Africa, the spike in repayments of Eurobond obligations coming due in 2024 and 2025 will be of particular concern (it also coincides with when DSSI rescheduled debt is due).
-
China is another major source of uncertainty. On the one hand, countries will continue to be in massive repayment mode to China based on the stock of debt built up over the past decade. But there are questions about new financing and the future path of the Belt and Road initiative, as well as the willingness of China’s lenders to provide debt forgiveness, with real haircuts on an net present value basis. A number of countries (e.g., Montenegro and Ecuador) that are not eligible for DSSI are negotiating bilaterally with China to reprofile their debt
-
The G7 Summit also raises expectations about new financing from these governments, though the details remain unclear, particularly the degree to which this lending will be aimed at governments or private borrowers, and on what terms.
Topics
DISCLAIMER & PERMISSIONS
CGD's publications reflect the views of the authors, drawing on prior research and experience in their areas of expertise. CGD is a nonpartisan, independent organization and does not take institutional positions. You may use and disseminate CGD's publications under these conditions.