A couple of years ago, we examined aid data from the OECD and UNESCO Institute for Statistics, analysing how much aid is going to education, where it is allocated, by who, and through what channels. Two years on, we provide an update to see what’s changed. The latest available data is from 2019, and so any impact of the COVID-19 pandemic on education finance is not captured in this retrospective analysis. Our next update could look very different.
Chart 1: Domestic spending on education dwarfs education aid
Despite the frenetic efforts to raise $4 billion from donors at the recent Global Partnership for Education replenishment, the vast majority of education expenditure continues to be domestically financed, with aid representing just a tiny share of total education spending.
Convincing finance ministers to increase the share of domestic revenue allocated to education will raise substantially more money and is likely to be more sustainable. Doing this by increasing domestic resource mobilisation through more progressive taxation is one strategy. Another is to address finance ministers’ reluctance to spend in the social sectors—for example, finding ways to turn education outcomes into more immediate fiscal returns—and getting better at providing them with more convincing information about the financial returns to well educated citizens.
Figure 1. Donor and national government annual spending on education, 2008-2019
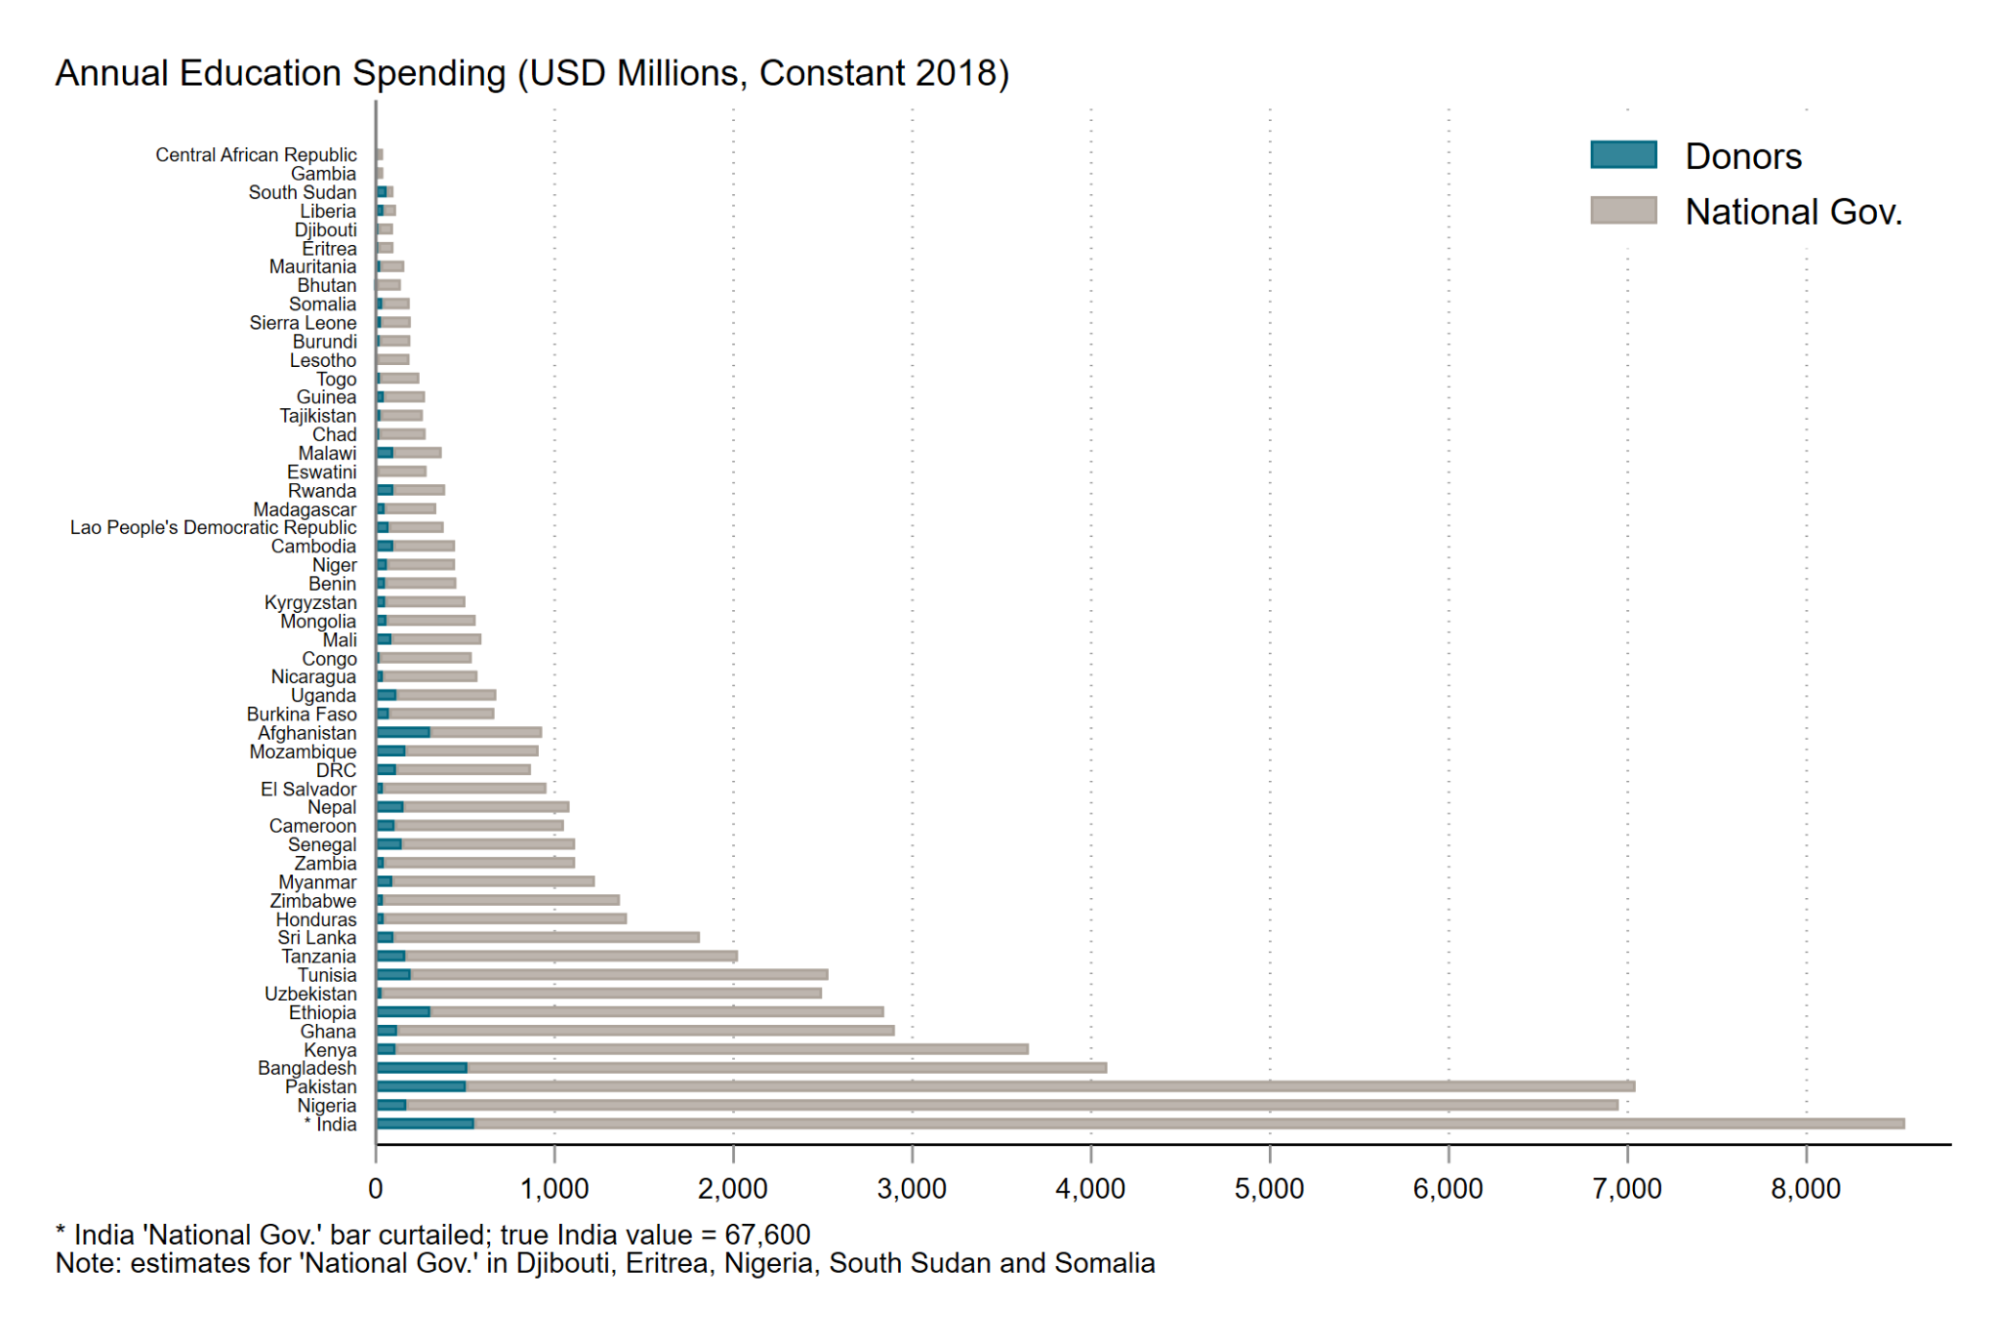

Chart 2: Aid to education rose, but only a little bit
Despite the dominance of domestic finance in terms of volume, education aid continues to play an important role, especially for the most vulnerable groups that often lack access to any public education system. We see that aid to education has increased substantially since 2000. After a plateau between 2010 and 2015, education aid rose and flattened again in the last four years that we have data for. Interestingly, aid for health declined during the same period—a trend that is likely to change when the next data are published.
Figure 2. Aid to education, health, and general budget support disbursement, 2000-2019
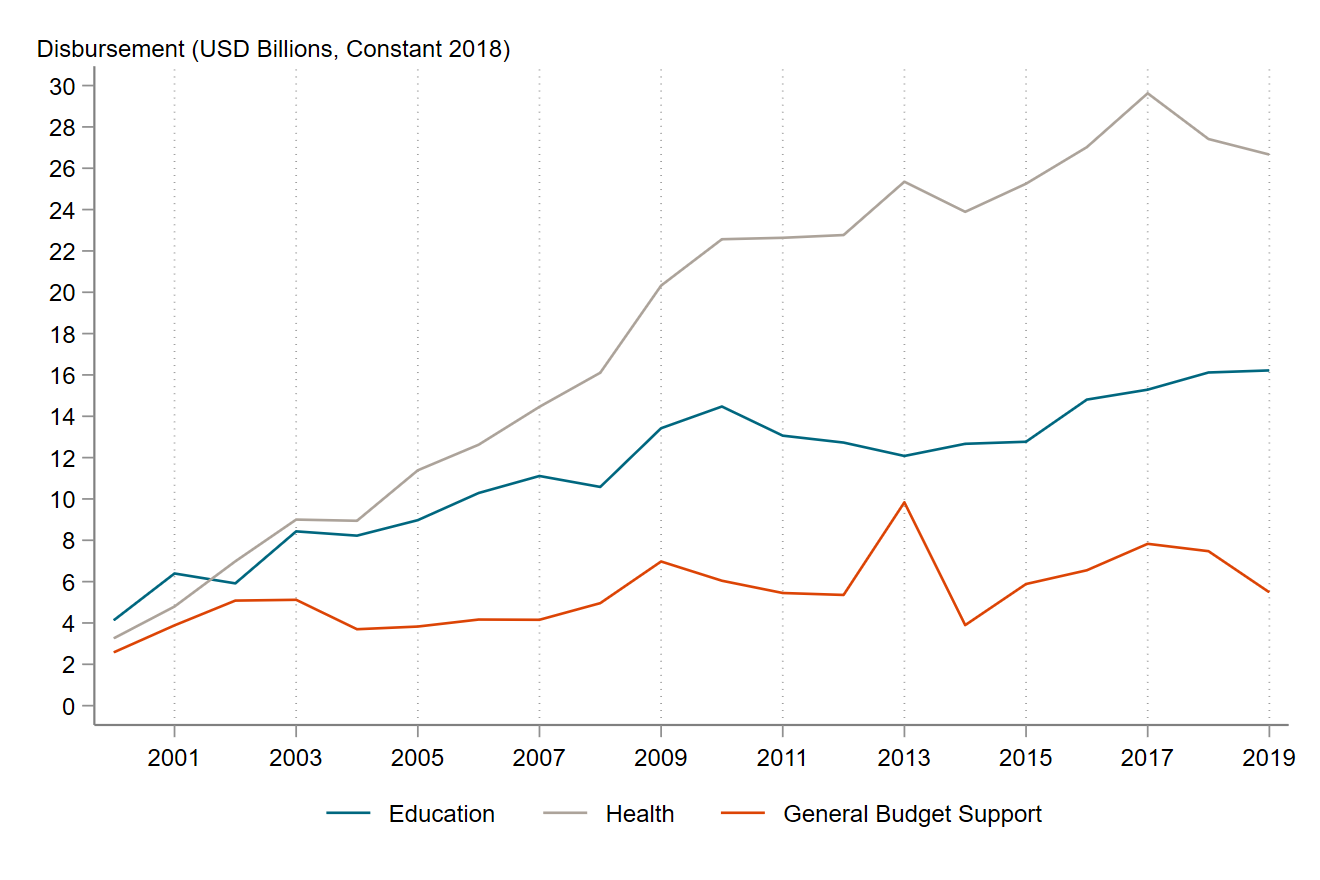
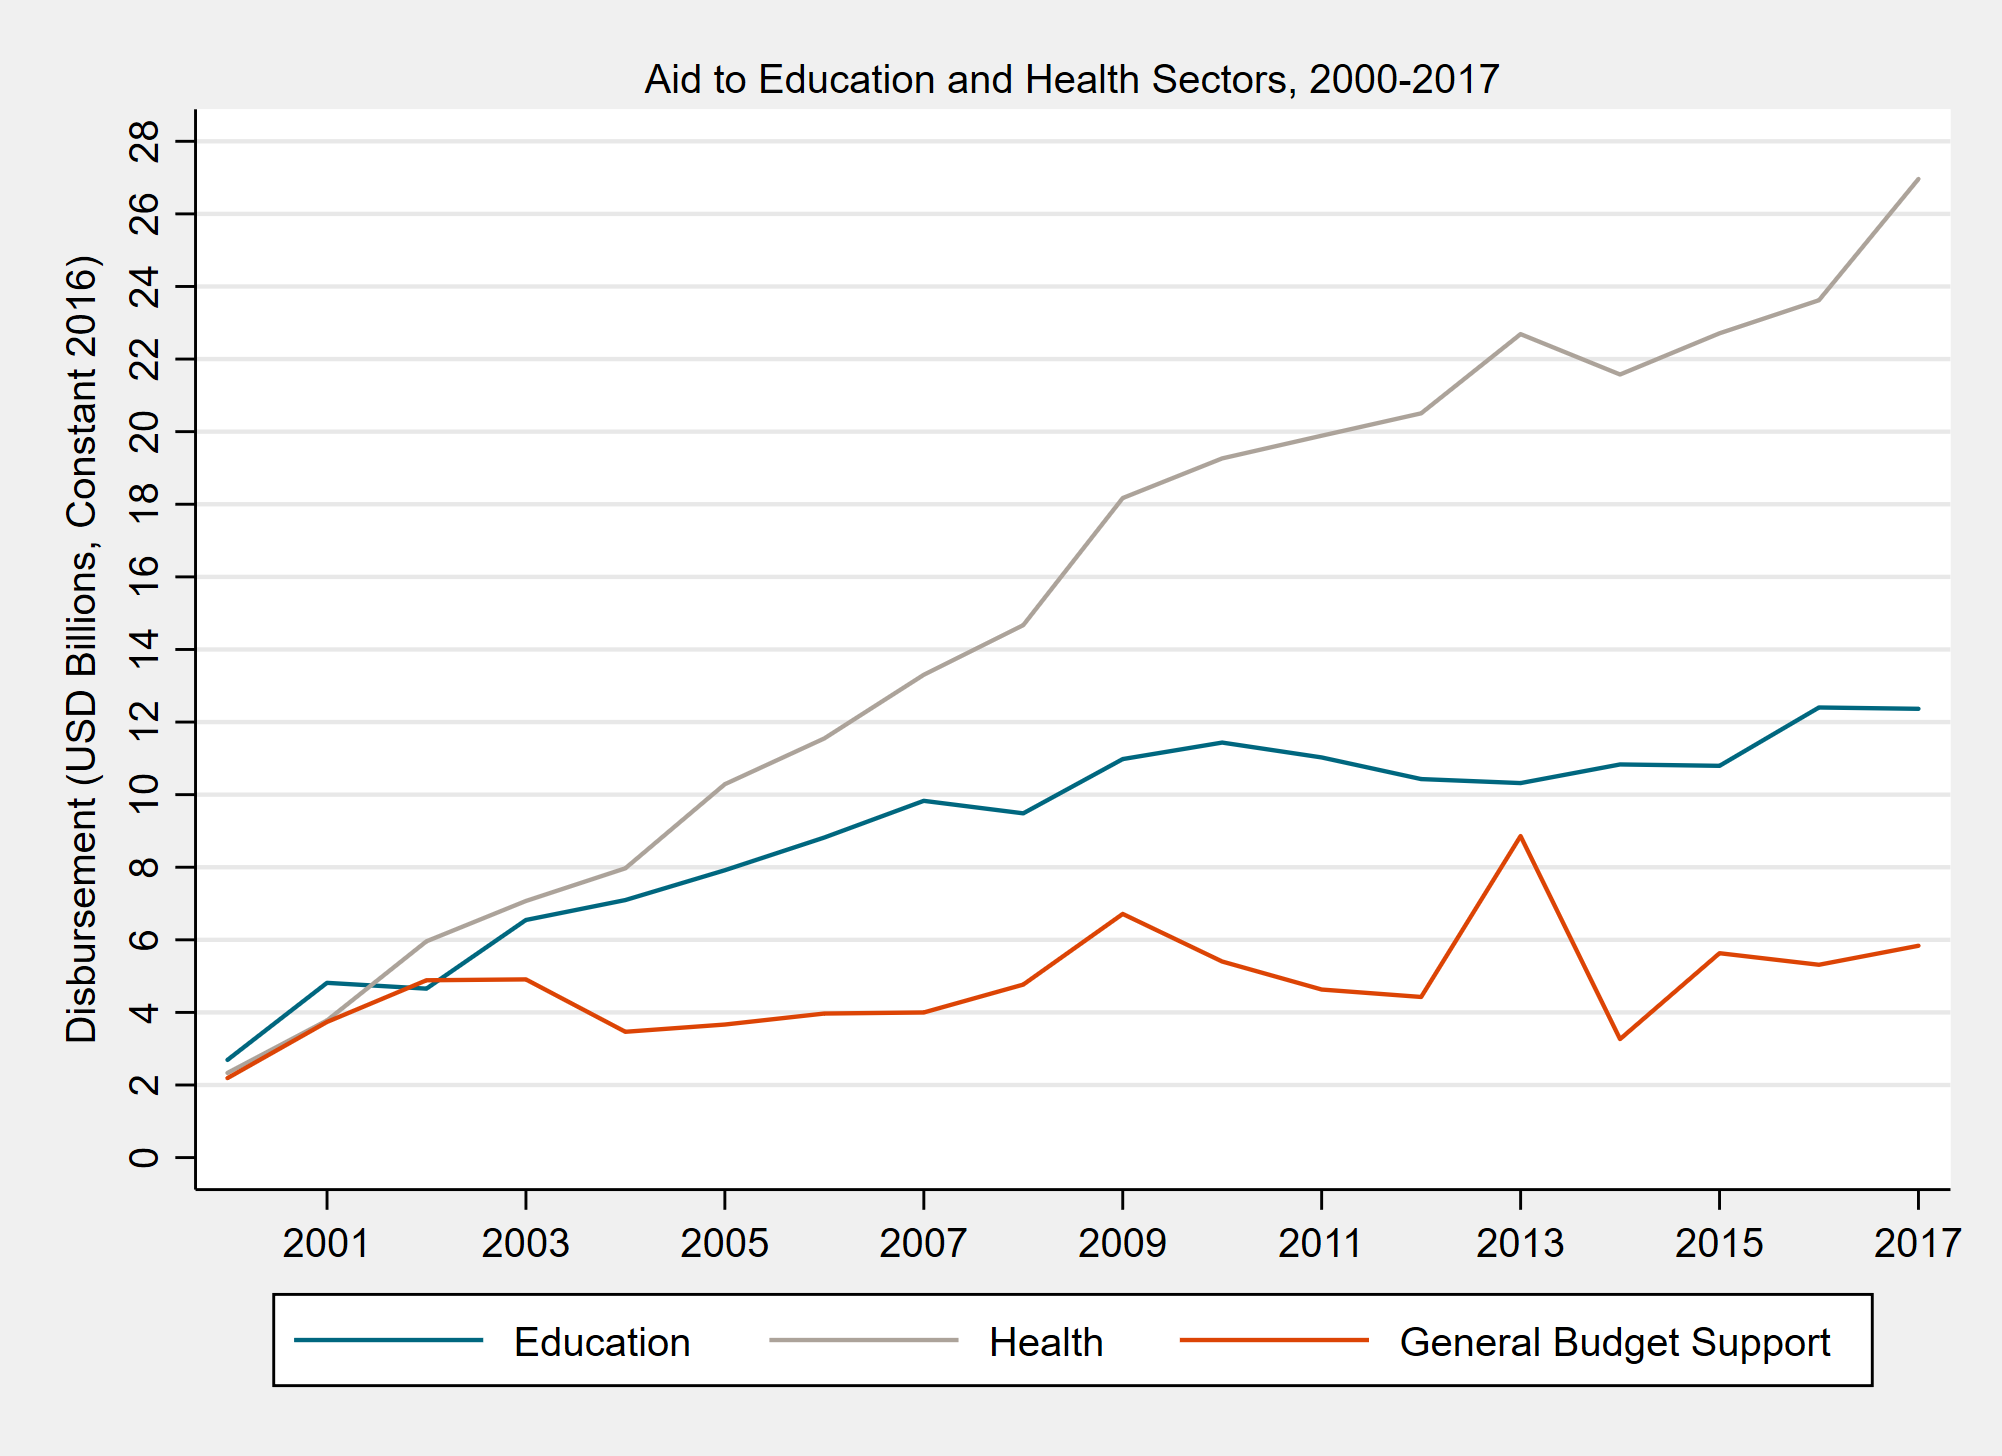
Chart 3: Bilateral donors have very different priorities for their education spending.
USAID allocates the vast majority of its education aid to basic education and until recently it had a laser-sharp focus on early grade reading. That’s changing under its new education strategy, which allows for far more flexibility in what USAID funds. But even so, an even greater proportion of USAID funding has been allocated to basic education in recent years, including $392 million to school feeding (which is now reported separately) since 2017.
In contrast, Germany—the largest donor to education—continues to allocate the greatest share of its funding to post-secondary education, particularly on scholarships for students in developing countries to study at higher education institutions in Germany. In 2016 Germany spent 47 percent of its education aid on scholarships and in 2019 it spent 50 percent. At the same time Germany has reaffirmed its place as lead donor to the education sector, increasing aid to basic and secondary from $790 million in 2016 to $1,060 million in 2019.
Figure 3. Bilateral donor priorities for education

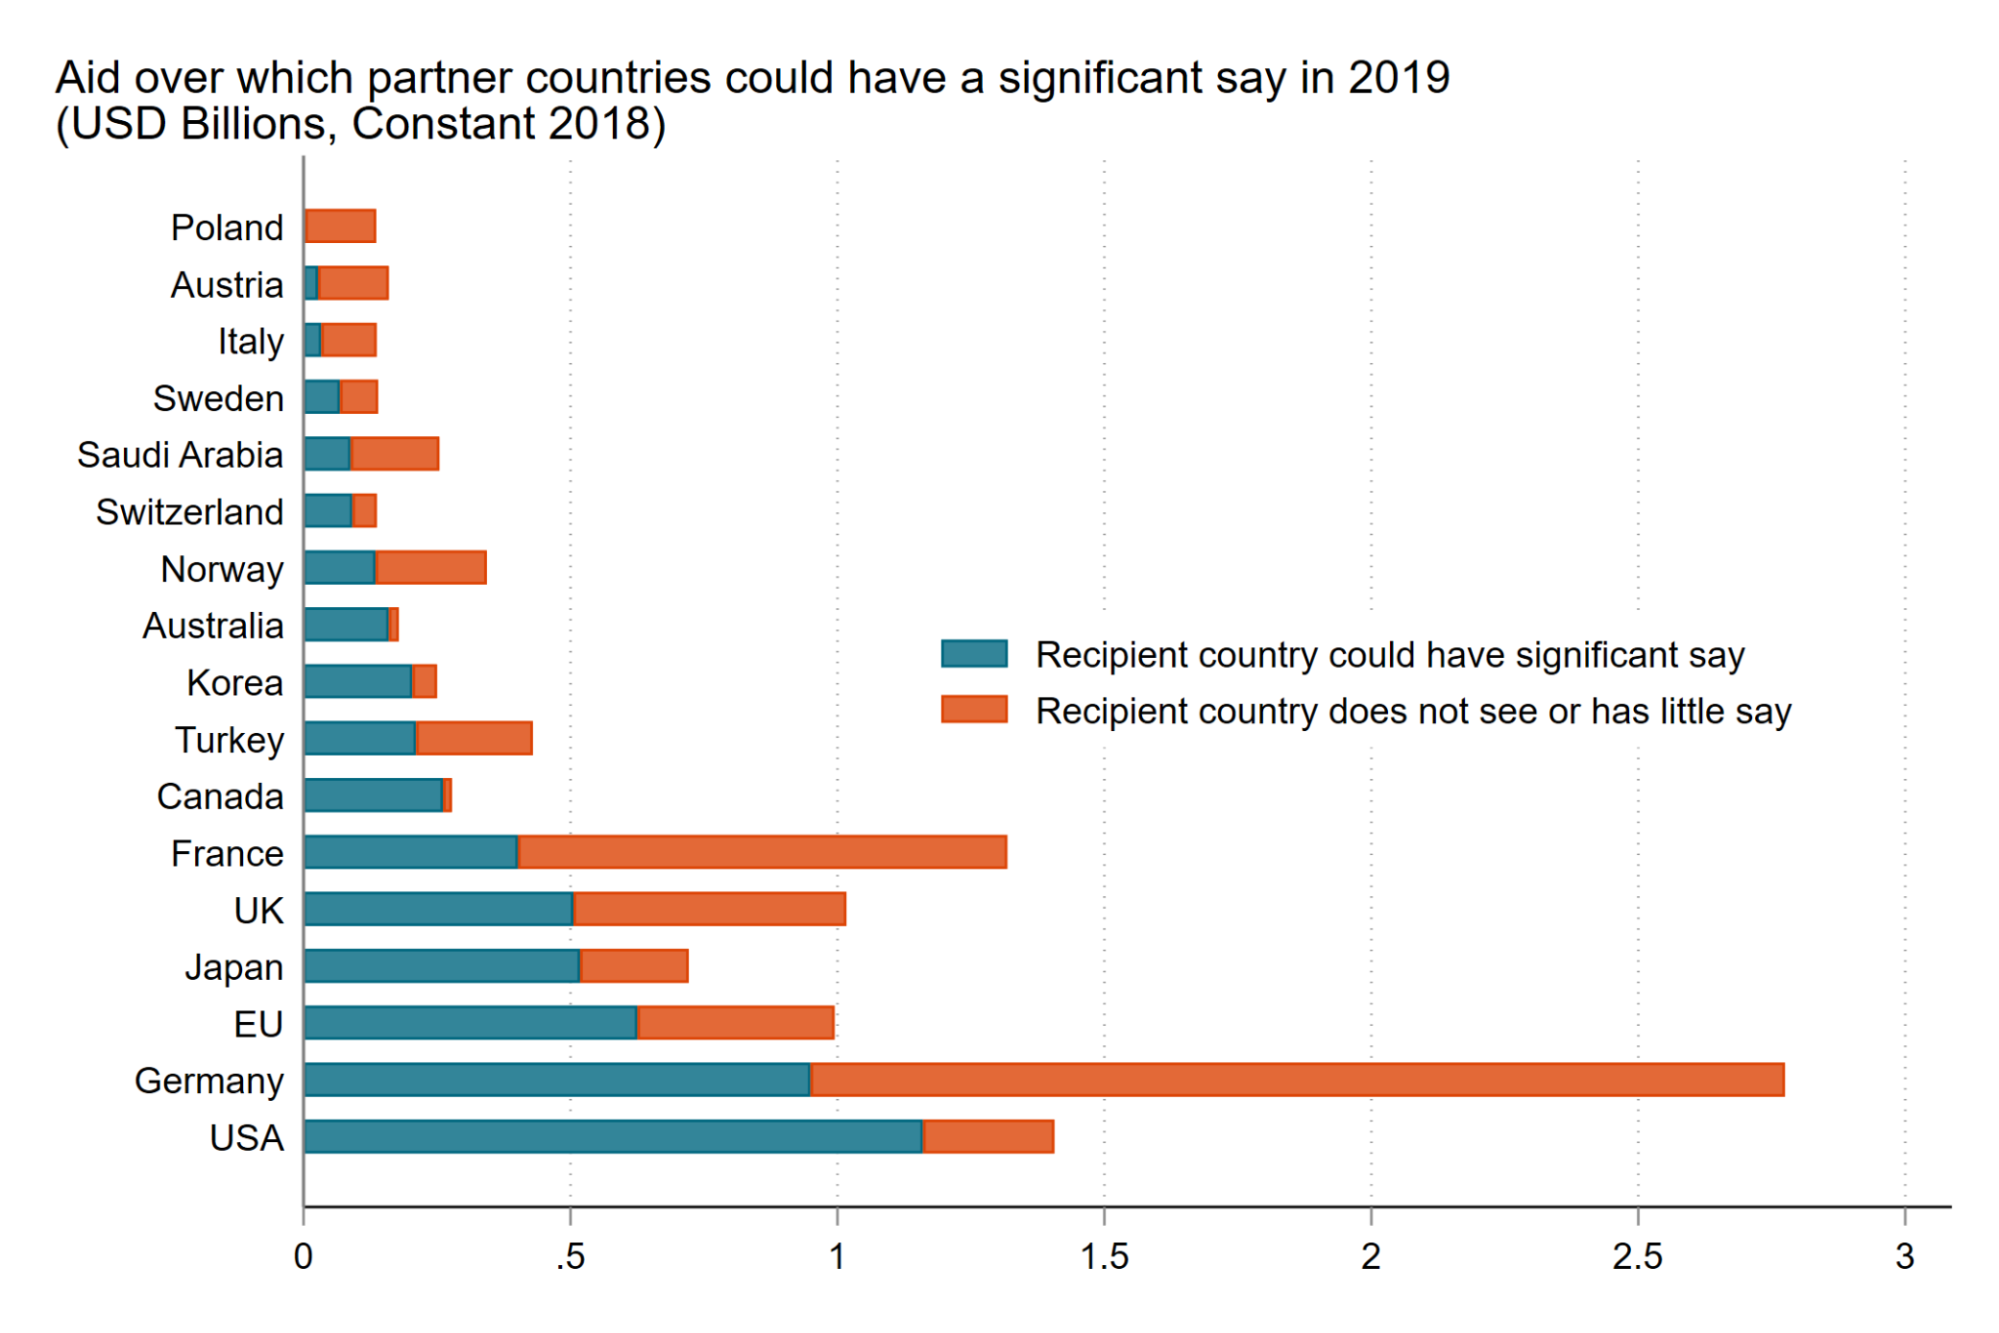
Chart 4: Some donors give countries a lot more influence over how aid is spent than others
We are also interested in the amount of aid that countries have a “significant say” in how it is spent. To do this we use the amount of country programmable aid (CPA) by donor, “the portion of aid that providers can programme for individual countries or regions, and over which partner countries could have a significant say.” CPA is arguably a closer proxy of aid that goes to partner countries than official development assistance, which includes money that recipient countries never see. But it’s still imperfect.
Aid money may be coded as country programmable, but a government may still have limited influence over what it is spent on. And some spending—for example funds channeled to the Global Partnership for Education, Education Cannot Wait, and the Girls Education Challenge—is not coded as CPA but in some circumstances countries will have a say in how those funds are spent. There’s also a difficulty in coding aid from multilaterals: $4.1 billion is received from multilaterals including the World Bank, Inter-American Development Bank and UN, but is not coded as CPA. Again, recipient countries do often have a role in deciding how this aid is used.
However, what we find when we look at CPA is that receiving countries only have a say in how around 50 percent of aid to the education sector is used. In 2019, total aid in the education sector reached $16.2 billion. Of this, $5.8 billion was CPA and an additional $4.1 billion came from multilaterals. But that leaves $6.3 billion over which recipient countries have very little say. Much of this is never seen by ‘recipients’ and donors have very different attitudes to the value of this approach. It might not cross borders, in the case of flows to local government or universities in donor countries, or it might go straight to core funding of NGOs. This is not a bad thing, per se. But if we think that aid can fill gaps in government education budgets then we need to rethink the total volumes that are arriving to plug those holes.
Figure 4a. Aid over which partner countries could have a “significant say” in 2019 (USD billions, constant 2018)
As we say above, this analysis is imperfect and one particular omission is aid allocated to the Global Partnership for Education (GPE). The GPE is—perhaps of all multi-donor funds and certainly in education—the most democratic with the most “say” given to developing country partners. The board only approves grants when they have been submitted by a government to fund a government education plan. Therefore it’s arguable that any analysis of which donors gives countries more influence should include aid allocated to the GPE, even though it is not categorised as country programmable aid. The chart looks a little different (figure 4b), with the EU, Norway, and UK in particular giving more say to country partners, when GPE funds are included.
Figure 4b. Aid over which partner countries could have a significant say in 2019 (USD billions, constant 2018), including aid to the Global Partnership for Education.
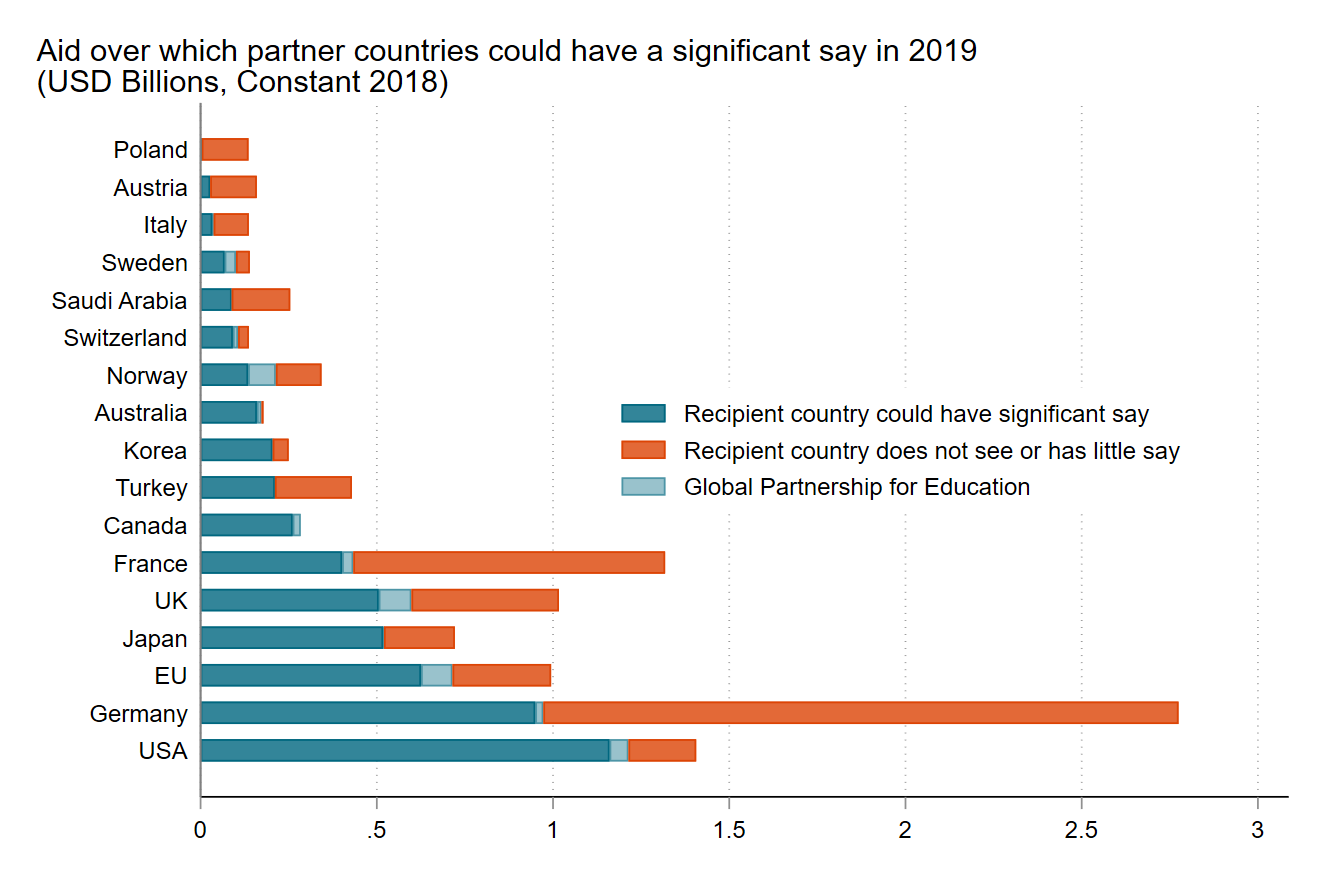
Chart 5: Children in low-income countries are not receiving the highest share of education aid.
If asked to name the five countries receiving the highest amount of education aid per school-age child, we suspect few would name Jordan, Georgia, Azerbaijan (upper-middle-income countries), or Moldova and Mongolia (lower-middle-income countries). In fact, none of the top ten countries according to this measure are low-income and only Jordan is a significant refugee-hosting country.
The default expectation is that aid should benefit the most vulnerable countries but this is rarely the case. National self-interest, geopolitical and commercial considerations, as well as need and institutional performance all influence donor decisions about aid allocations.
Of course, this chart does not account for costs being much higher in some countries, but it does suggest that some richer countries are receiving a disproportionate share of donor finance for education. If we care about education for poverty reduction, then reallocating aid may be considerably less difficult than doubling or quadrupling aid budgets.
Figure 5. Aid received by school-age child, average over 2017-2019 (USD constant 2018)
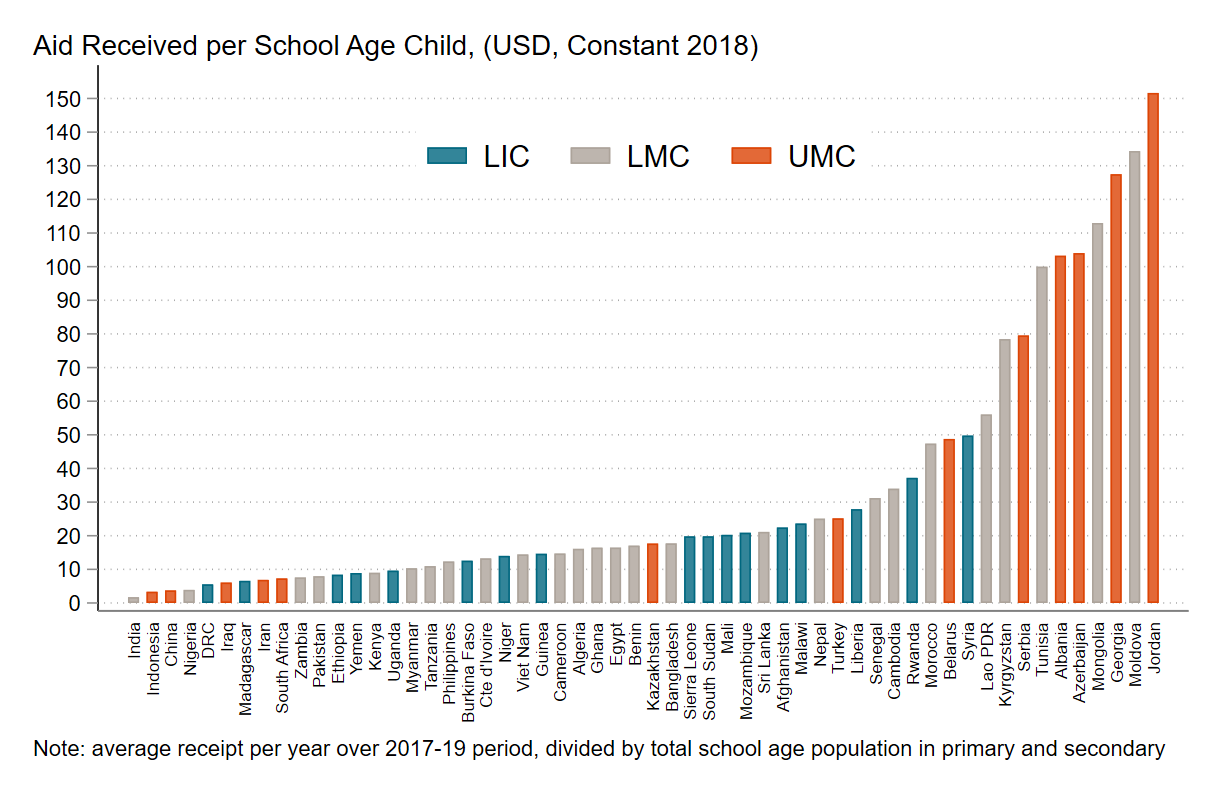
Chart 6: Donor dominance
In 20 countries, one donor provides more than 40 percent of all education aid. While aid fragmentation is often thought to be detrimental to development outcomes, it’s also the case that the greater the number of donors, the less power held by a single lead donor. A wider range of donors may also mean more innovative ideas, more experiences to inform decisions and, arguably, more autonomy for a recipient government to identify its own priorities.
Figure 6a. Share of education aid received from lead donor
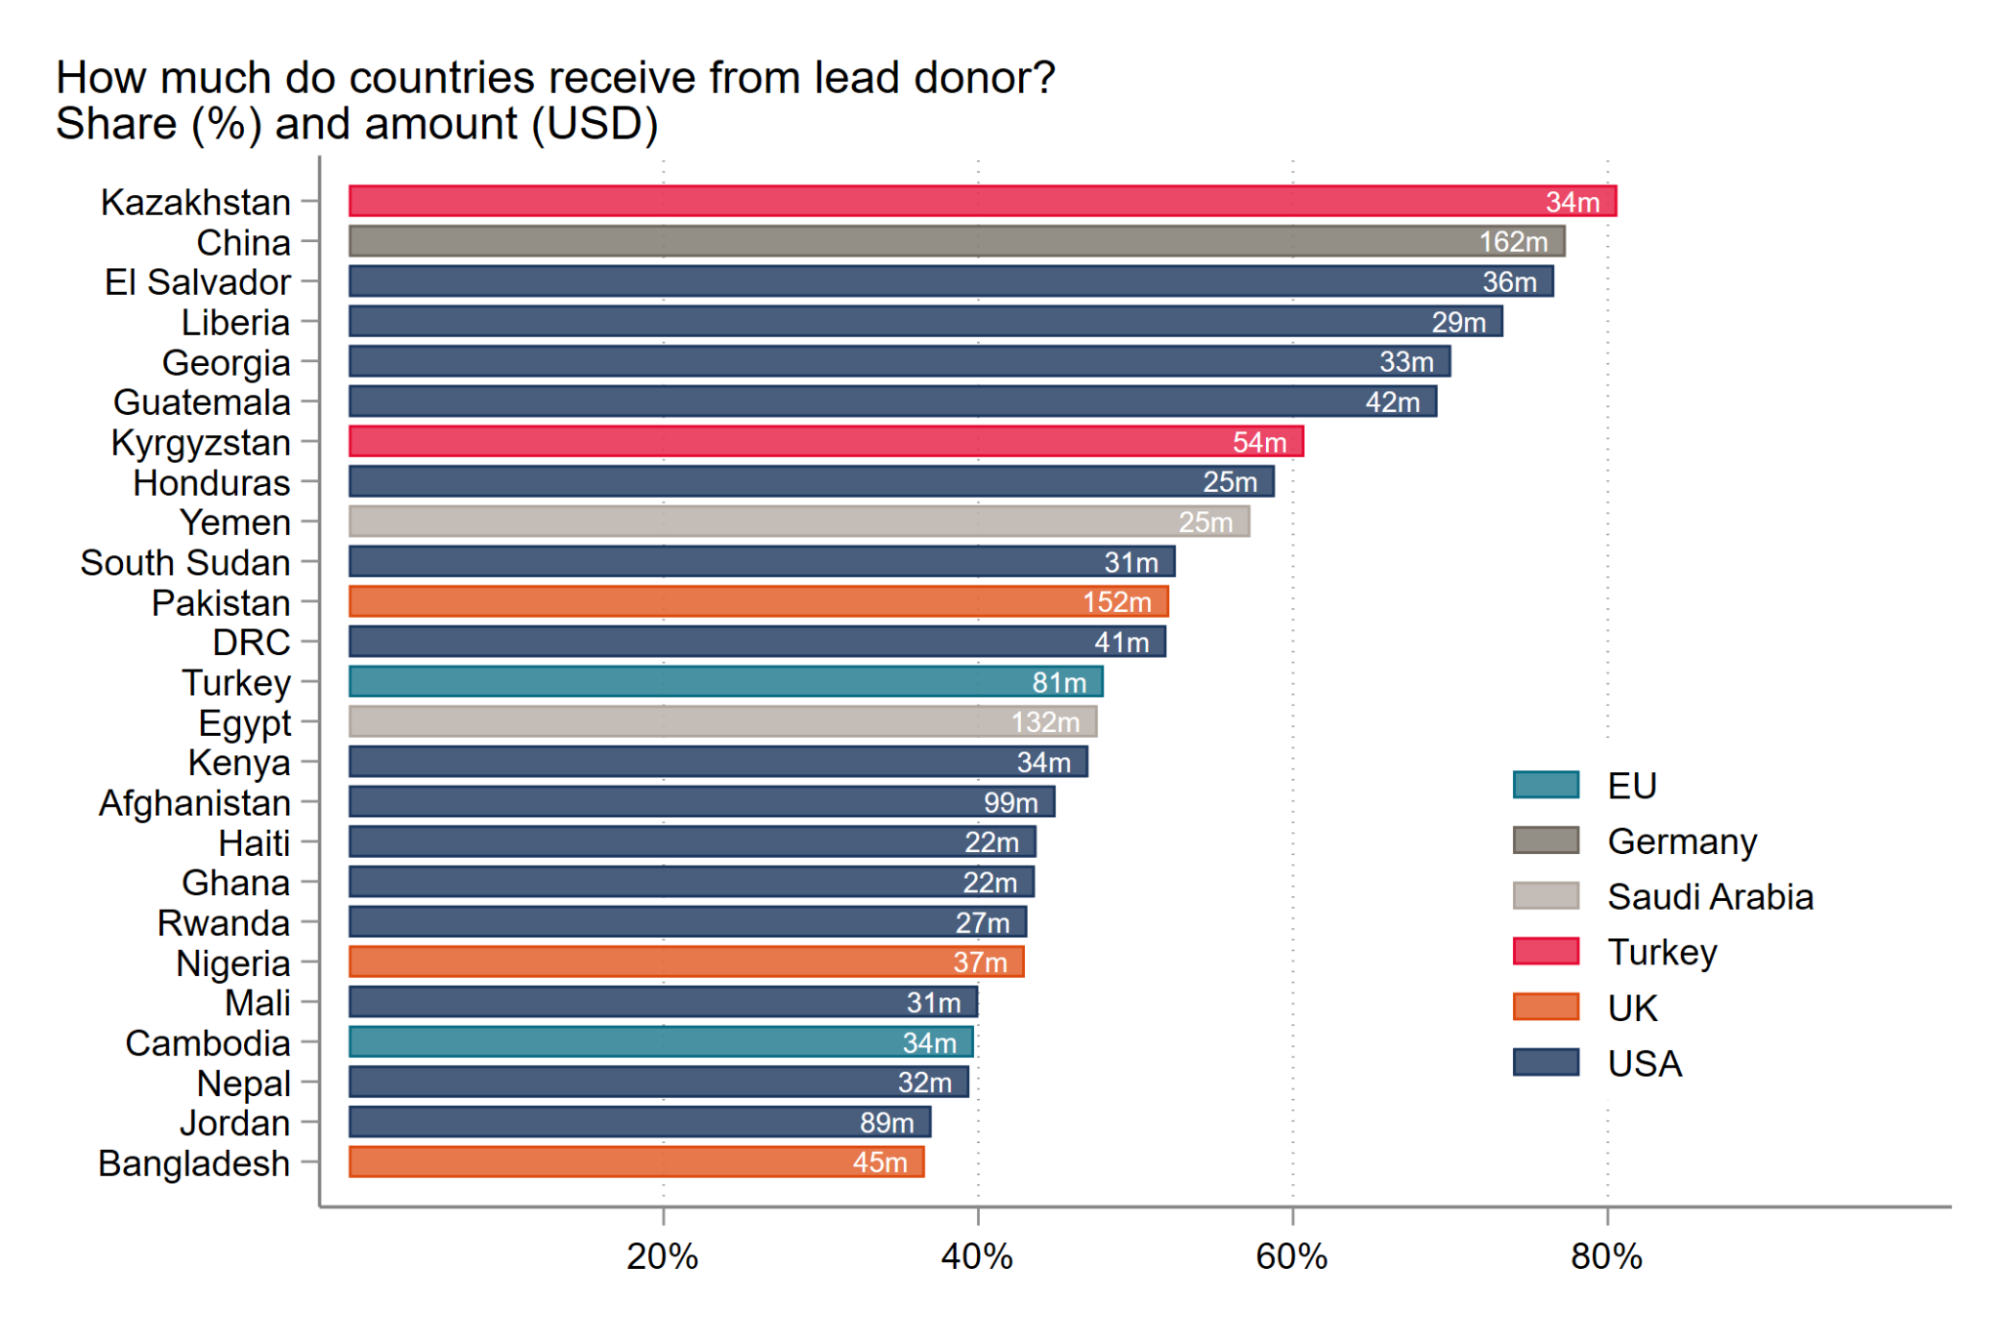
Source: authors’ analysis of CRS data, using country programmable aid; annual average over 2017-19.
Note: shown for top 25 countries by lead-donor dominance; excludes countries with total annual receipt less than USD 40 million. Share in percentage and USD millions.
Another way of looking at this is whether donors tend to dominate where they work. The largest aid donors are often going to be the largest donors in the countries they provide aid to, simply because of their scale. But looking at how donors spread their resources, it's clear that even among the largest aid-providing countries, there are different strategies at work. At the extreme, the USA operates in almost 90 countries and is a lead donor in about half of these. Only Australia and Turkey come close to leading in such a large proportion of the countries in which they work.
A contrasting strategy might be to allocate aid to more countries, have more seats at more tables and contribute more in terms of ideas and experience than dollars spent. Canada, Korea, Switzerland, Norway, and Finland perhaps adopt this approach. But Japan stands out, allocating education aid to over 70 countries and, on the whole, a modest stake in each.
Figure 6b. How dominant are donors in the countries they allocate education aid to?
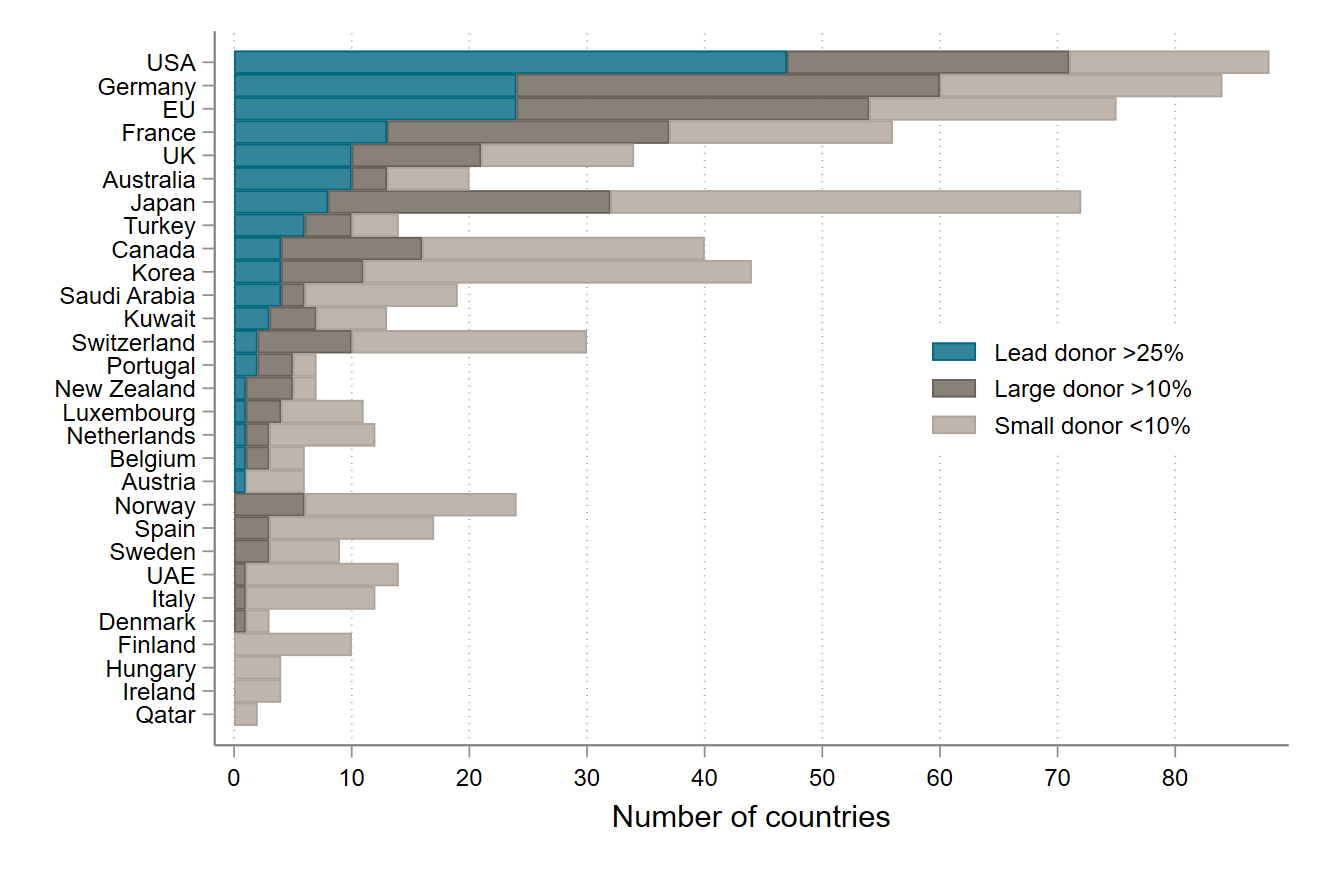
Notes: lead donor indicates giving more than 25% of all education aid received by that country. Country programmable aid only.
Chart 7: If [insert education donor of your choice] did not exist, would the world be a better or worse place?
As a bonus chart for this update, we borrowed from the work of our CGD colleagues who produce the Quality of Official Development Assistance. We analysed whether aid for education would get better or worse if one donor stopped funding education altogether. In other words, does a donor move the global education aid allocation toward or away from some sort of optimum?
Of course, what is an optimal distribution of education aid for one might not be for another—there are competing priorities in education and we make no judgement here on what the priority should be. So we analysed the data for options: firstly, allocating aid to countries where children have the lowest number of years of schooling; and secondly, allocating aid to countries that have the highest levels of learning poverty.
Figure 7. Are education donors helping or hindering an optimal distribution of education aid?
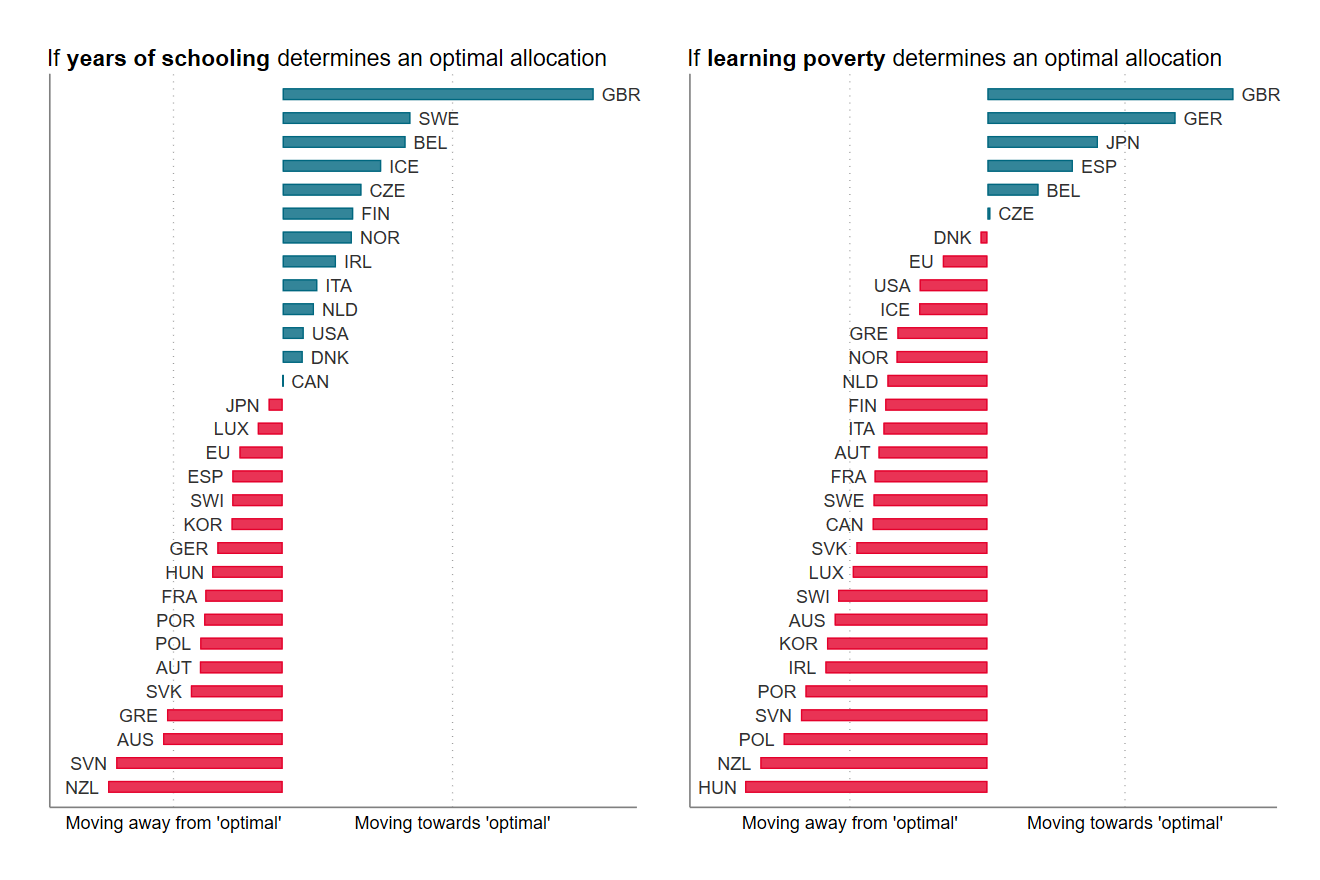
A tentative finding from this analysis is that there are about a dozen countries whose spending targets the largest shortfalls in years of schooling (left-hand side). The UK, on account of its support to big countries with major school-completion challenges—Pakistan, Ethiopia, Bangladesh—comes out well on this metric. So do several others, including Sweden, Belgium, Finland, and Norway. The picture changes quite a bit when ‘optimal’ is defined based on learning poverty (right-hand side). Japan and Spain climb, perhaps indicating the targeting of universal literacy over universal primary and secondary schooling. Germany also places well on the learning poverty analysis, since it’s a leading education donor to China which is (i) enormous and (ii) has 18 percent of children at late primary age who are not proficient in reading.
While we have reliable data on years of schooling across all aid recipients, there is a large caveat to the analysis with learning poverty. Learning poverty data are not available for several countries where there is likely to be learning poverty: Tanzania, Mozambique, and Nigeria, for example. Therefore donors—including Finland and Sweden—who give education aid money to these countries come out looking worse than they might actually be.
Watch this space for more from CGD on government perceptions of and priorities for education aid.
Many thanks to Sam Hughes and Ian Mitchell for advice on how to adapt the QuODA measure.
Topics
DISCLAIMER & PERMISSIONS
CGD's publications reflect the views of the authors, drawing on prior research and experience in their areas of expertise. CGD is a nonpartisan, independent organization and does not take institutional positions. You may use and disseminate CGD's publications under these conditions.