Recommended
BRIEFS
Today, we publish the fifth edition of QuODA—the Quality of ODA (Official Development Assistance)—which assesses the largest providers of development cooperation on four dimensions of quality. We preview some of our headline findings here, including what QuODA tells us about progress 10 years after the Busan agreement on effective development cooperation.
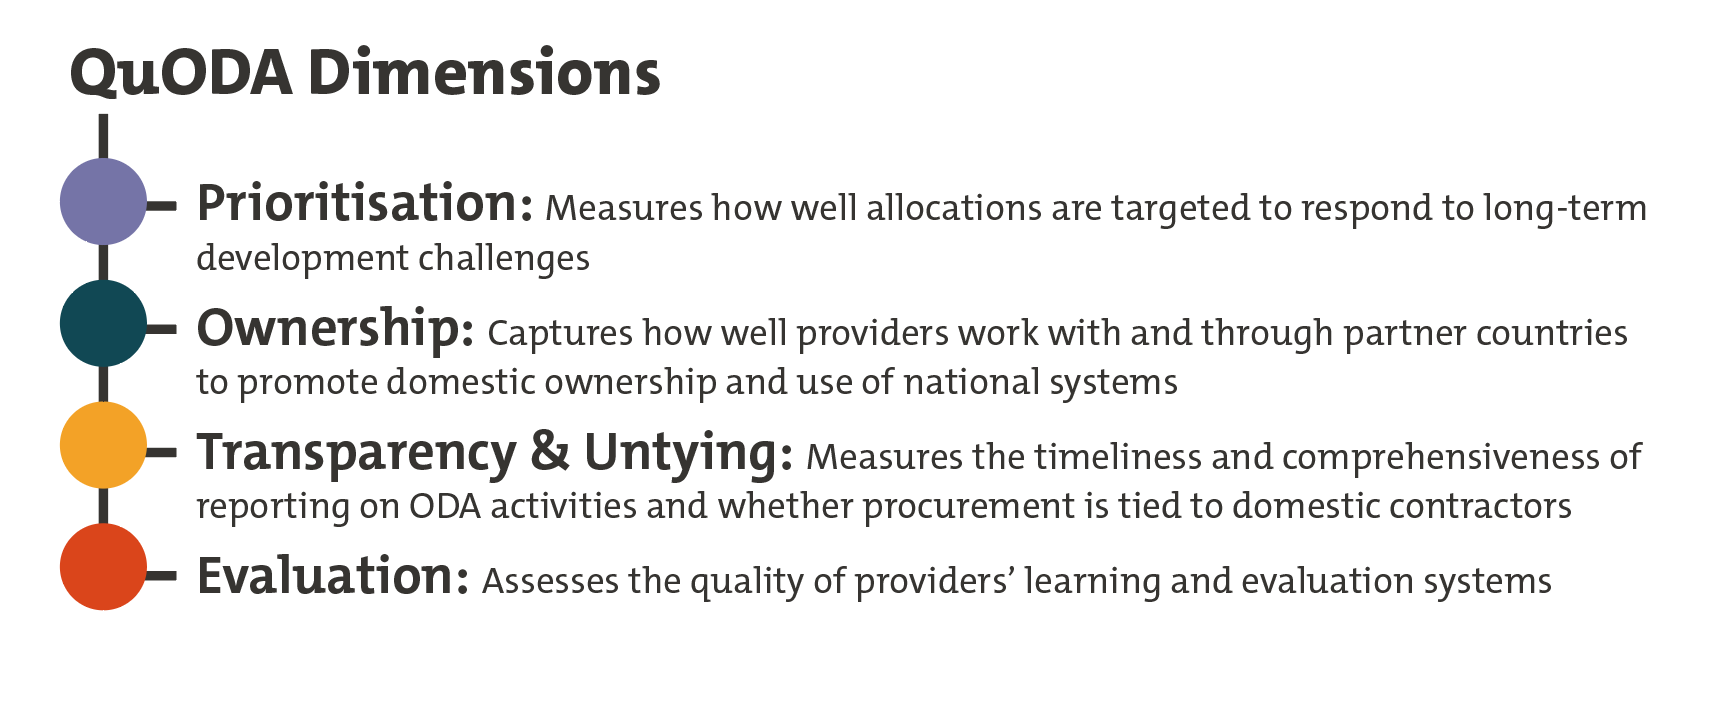
QuODA uses what we think are the most important agency and country-level indicators to assess 49 aid providers of over $150 billion by measuring four equally weighted dimensions:
Although our data across these dimensions relates mainly to 2019, providers’ performance on these dimensions has clear relevance to their COVID-related support. Measures like the sensitivity of allocations to need, the depth of partnerships with partner countries, the use of evaluation and learning to inform decision-making, and the openness of procurement are perhaps even more important during crisis.
While some argue a quantitative focus on aid quality is reductive, we think it’s an essential element of holding providers to account on commitments, and an important navigational tool for decision-makers. We hope the discussions that QuODA starts will lead to real improvements for partner countries.
1) The top-ranking aid spenders are multilateral organizations
Multilaterals dominate the overall rankings, taking each of the top five positions. Their allocation processes mean that they score very strongly on Prioritisation; nearly all of their resources get to partner countries, and they focus on the poorest, fragile, and under-aided countries. Recipient countries also report a high level of Ownership. Most top multilaterals score well on Transparency, and their procurement is not tied.
Table 1. QuODA 2021 rankings
| Agency | Rank |
|---|---|
| International Fund for Agricultural Development | 1 |
| African Development Fund | 2 |
| International Development Association | 3 |
| Global Fund | 4 |
| Global Alliance for Vaccines and Immunization | 5 |
| Sweden | 6 |
| United Nations Development Programme | 7 |
| Finland | 8 |
| Denmark | 9 |
| Canada | 10 |
| World Health Organization | 11 |
| Asian Development Bank | 12 |
| Belgium | 13 |
| European Union Institutions | 14 |
| United Nations Children's Fund | 15 |
| United Kingdom | 16 |
| Ireland | 17 |
| South Korea | 18 |
| Netherlands | 19 |
| Iceland | 20 |
| Australia | 21 |
| Luxembourg | 22 |
| New Zealand | 23 |
| Climate Investment Funds | 24 |
| Norway | 25 |
| International Labor Organisation | 26 |
| Switzerland | 27 |
| Germany | 28 |
| Japan | 29 |
| Islamic Development Bank | 30 |
| Italy | 31 |
| Spain | 32 |
| France | 33 |
| OPEC Fund for International Development | 34 |
| United States | 35 |
| Portugal | 36 |
| Inter-American Development Bank | 37 |
| Green Climate Fund | 38 |
| Arab Fund for Economic and Social Development | 39 |
| Food and Agriculture Organisation | 40 |
| Austria | 41 |
| Global Environmental Facility | 42 |
| International Monetary Fund (Concessional Trust Funds) | 43 |
| Czechia | 44 |
| Poland | 45 |
| Hungary | 46 |
| Slovenia | 47 |
| Slovakia | 48 |
| Greece | 49 |
Note: teal indicates bilateral providers, and grey indicates multilateral organizations
Multilaterals are not uniformly strong, however, and many have room for improvement. Take the three main climate multilaterals, for example; they score well on the indicator on global public goods, but only the Climate Investment Fund is in the top half, with the Green Climate Fund and Global Environment Facility scoring below average on both Ownership and Transparency.
For ministers making allocation decisions, then, these characteristics suggest their default position should be to allocate to the best performing multilateral providers as trusted and effective partners.
2) For bilateral donors, effort on quality is related to quantity
Our analysis suggests that agencies that give a higher proportion of their gross national income as ODA perform better on QuODA—a finding that runs directly counter to the narrative that higher spending leads to waste.
In terms of the top bilateral providers, Sweden ranks top, followed by Finland, Denmark, Canada, and Belgium. However, QuODA highlights strengths and weaknesses for all providers, so while Sweden ranks first on Evaluation, it has room for improvement on Ownership. Canada—the top G7 country on quality—scores well on Transparency & Untying but could do more to reach the poorest (Prioritisation). It’s also well below average on quantity.
3) A baseline for new strategies among the largest providers
Three of the largest providers—the UK, the US, and the EU—are going through important shifts in their approach to aid. The latest data (2019) predates the challenge of the pandemic but provides an important baseline for both pandemic response and these new strategies.
Currently, the US and the UK rank 35th and 16th, respectively. Each receives below average Ownership scores from recipients, despite their budgetary importance to their partner countries. There is no in-built disadvantage for large providers—IDA disbursed $18 billion in 2019 and ranks 3rd—so these countries have room for improvement. The US’s scores are middling in Prioritisation, Transparency & Untying, and Evaluation. The UK was the 6th highest quality bilateral provider in our 2019 data—which provides a baseline performance for its recent departmental merger and new strategy.
Earlier this year, the EU redesigned its Global Europe approach to development policy and spending. It has strengths to build on, with EU institutions ranked 14th overall and in the top five on both Evaluation and Transparency & Untying. Going forward, the EU should address a limited focus on the poorest and most-fragile countries as well as its performance on Ownership, where recipients’ feedback scores it below average.
France is the only country to provide above average quantity but below average quality. Still, its current legislative proposals have the potential to directly tackle its shortcomings, including focusing more on the most vulnerable countries, and introducing an “independent commission for the evaluation of official development assistance” could help improve its Evaluation score.
Finally, Germany, already the second largest country provider, is stepping up its ODA spending, and in 2021 will provide over $10 billion more than the UK. Germany does well on Transparency & Untying but is in the bottom five on Prioritisation.
As France and Germany step up their roles in development, they will have an even greater leadership position to play within and beyond the EU, and a challenge for all three is to focus on the poorest, fragile, and under-aided countries.
4) There has been little meaningful improvement since Busan
The agreement reached in Busan in 2011 set principles for development effectiveness, and countries and multilaterals committed to step up their efforts. There are some signs of progress; for example, the International Aid Transparency Initiative, established in 2008, now has over 1,000 organisations publishing to it, and 33 of our 49 largest providers report at least partially to it (see coverage for each provider in our tool).
But our analysis in three other areas is much less encouraging. First, there has been no improvement in reaching those most in need. The share of ODA actually reaching partner countries is flat at 70 percent (the remainder covering administrative, in-provider refugee, students, and research costs) and the average income of recipients has increased in the last decade.
Second, on Ownership—seen by many as the most important principle of aid effectiveness and surely important in pandemic response—recipients report virtually no improvement across the six survey questions used in QuODA. Furthermore, the only meaningful survey of recipient views, undertaken by the Global Partnership (GPEDC), has seen improved response rates, but they remain low (typically, just 32 percent of development partners responded in 2018). Providers must support the GPEDC’s survey to do better and do more by using partner systems and improving predictability.
Third, while there’s been progress on the share of ODA procurement that providers declare is “tied” to their own firms (i.e., excluding more efficient ones that are based abroad)—with the share down from 26 to 22 percent over the decade—this progress masks continued shortcomings. Our analysis shows that national contractors still win over half (57 percent) of contracts. And this pattern holds even after we account for the global market share of contracts in provider countries. Of course, these contracts may subcontract in-country providers, but this is not the characteristic of a free, fair, and efficient procurement system.
Where next for aid effectiveness?
In recent discussions on aid effectiveness, some have suggested the agenda is effectively dead. We disagree. For partner countries and taxpayers, aid effectiveness remains the key issue—and as high-income countries emerge from the COVID crisis, the need for aid will be stark. The message is clear: providers need to do better on aid effectiveness. QuODA provides a challenge and a starting point for prioritising improvement.
Check out the QuODA 2021 results for yourself here and read the brief here.
Disclaimer
CGD blog posts reflect the views of the authors, drawing on prior research and experience in their areas of expertise. CGD is a nonpartisan, independent organization and does not take institutional positions.
Image credit for social media/web: Adobe Stock