Recommended
Blog Post
Post-Brexit Resources for Global Britain
Introduction
This note lays out calculations of the UK’s net fiscal contribution to the EU budget between the years 2008 to 2018, and quantifies the support provided to other EU countries to promote their economic growth, regional convergence and rural development, but which is not classified as aid[1] (as recipients are not ODA eligible).
We update calculations on the UK’s contribution to the EU undertaken by the Institute for Fiscal Studies[2] and go on to examine in which areas the UK’s net contribution was spent, allowing us to quantify the UK’s non-aid overseas spend with the EU. This spend is significant and separate from the UK’s 0.7 percent spend on international aid, and 2 percent NATO commitment to defence spending.
Post-Brexit the UK’s payments to the EU will reduce; and the UK will need to consider whether any of its non-aid overseas spend through the EU should continue to support its “Global Britain” ambition.
Main Findings
We find that through its EU contributions, the UK has provided considerable non-aid funds to promote sustainable and inclusive economic growth, regional convergence and rural development in other EU countries. These funds have primarily been directed to the countries of Eastern and Southern Europe.
UK’s international spending within the EU
Taking the five-year period from 2014 to 2018, the UK provided an average net contribution of £6.4 billion per year (at constant 2019 prices) to the EU budget which was spent under expenditure categories whose primary purpose was to support the development of other EU economies. This equates to 0.31 percent of the UK’s GNI.
Looking at the largest net recipients of EU funds in these categories across 2014 to 2018, Poland was the largest absolute net recipient, receiving an average of £8.9bn per year from the EU. Romania, Hungary, and Greece which each received over £3bn annually from the EU. Allocating the UK’s £6.4bn spend in proportion to allocations to net recipients suggests the UK funding was around £1.4bn per year in Poland, £600m in Romania and Hungary, and £560m in Greece.
Alongside the UK’s commitment to spend 2 percent of the economy on Defence, and its adherence to the UN commitment to spend on 0.7 percent of national income on Official Development Assistance, this additional international spend of 0.31 percent of GNI is a substantial sum that is often overlooked. Taken together then, in the 5 years to 2018, the UK’s overseas spending has averaged over 1 percent of GNI.
Table 1: Overview of UK contributions to the EU 2014-2018 (2019 prices)
| Contribution | Average spend (£billion) | % GNI |
|---|---|---|
| Gross contribution | 14.19 | 0.68% |
| Net contribution | 8.22 | 0.40% |
| Non-aid overseas spend | 6.37 | 0.31% |
Source: Authors’ analysis of European Commission and World Bank WDI data
The UK’s total annual spending through the EU
Over the most recent five years for which data is available (2014 to 2018), we estimate that the UK’s annual gross contribution to the EU budget averaged £14.19 billion. This figure is after the UK’s rebate but before taking account of any EU spend in the UK (all values here are expressed as real GBP using constant 2019 prices). Over the same period, the EU spent £5.97 billion per year in the UK; and we calculate the UK’s annual net fiscal contribution to the EU to be £8.22 billion per year.
Post-Brexit trajectory
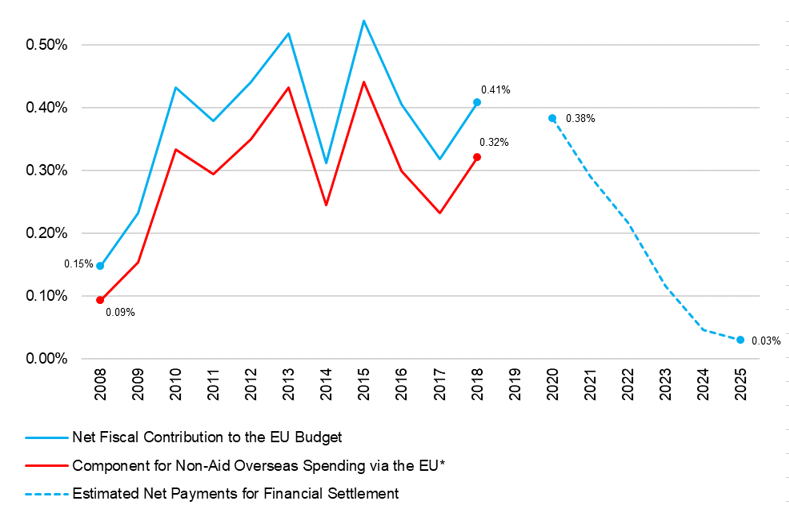
The Office for Budget Responsibility (OBR) estimates that the UK’s net spend through the EU will be £8.9bn in 2020, and that this will fall in coming years as commitments are fulfilled under the Withdrawal Agreement.[3] The OBR estimates that this net spend will be under £7bn in 2021, falling to under £1bn in 2025.[4] This assumes only the settling of outstanding financial obligations. The UK and EU could agree to continue payments to participate in EU programmes, for example the Horizon 2020 research and innovation programme.[5]
Figure 1 shows our calculations of the UK’s net EU spend, the component which is non-aid overseas spending via the EU, and the OBR’s projections for how the UK’s net payments to the EU will diminish over time post-Brexit.
Figure 1: The UK’s Past & Projected Net Contributions to the EU (Percentage of GNI)
UK EU spending by budget-line
The below table calculates the UK’s net contribution according to the EU’s budget headings. It splits the UK’s contribution according to the overall EU budget split; and then considers UK receipts to calculate the contribution by budget-heading. The UK was a net contributor in all budget-lines; but particularly in lines 1 and 2.
Table 2: UK Net Fiscal Contributions to the EU Budget by Expenditure Category,
2014-18 Annual Average (2019 GBP millions)
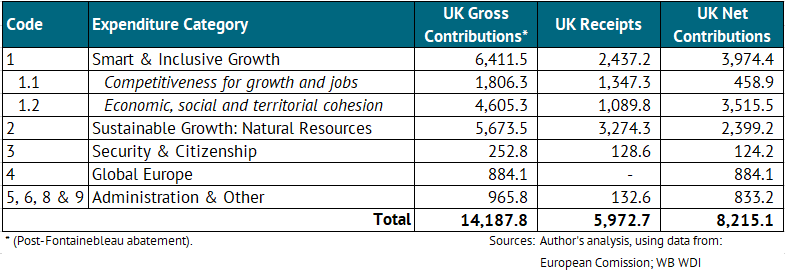
The first two headings – “Smart & Inclusive Growth” and “Sustainable Growth: Natural Resources” –are mainly intra-EU redistributive areas of spend which primarily support economic and rural development. If these resources were made to aid-eligible countries, they would qualify as aid (Official Development Assistance, ODA). These categories represent the UK’s non-aid international spending.
EU regional spend and overseas aid
The EU’s redistributive spend is substantial relative to the support given globally to poorer countries that are eligible for aid. Over the 2014-18 period, net receipts of EU expenditure in categories 1 and 2 exceeds 1 percent of Gross National Income (GNI) for many Central, Eastern and South-Eastern European countries with relatively lower incomes (including the Czech Republic, Lithuania, Estonia, Slovakia, Greece, Poland, Latvia, Romania, and Bulgaria), and ranging up to maximum of 2 percent of GNI in the case of Hungary. Bulgaria is the only EU country with income below the “high income” threshold in the World Bank’s classification[6]. By way of contrast, the 47 countries of lower middle-income status around the world received, on average, aid of 0.7 percent of their GNI in 2018.[7]
Methodology
We take a three-stage approach to calculating the UK’s non-ODA intra-EU international spend. First, we calculate the UK’s gross fiscal contribution to the EU budget. Second, we split this spend by expenditure category; and remove EU expenditure within the UK to obtain the UK’s net contribution by budget heading. Third, we remove the budget headings for administrative, non-EU, and security spending to identify the UK’s overseas spend within the EU.
UK fiscal contribution to the EU
In our first stage, we start with the UK’s gross contribution to the EU budget. UK contributions are primarily derived from three sources: GNI-based contributions, VAT-based contributions, and contributions based on EU customs and levies. These are summed and then adjusted downwards by the Fontainebleau abatement, commonly referred to as the “UK rebate”, to arrive at the UK’s (post-rebate) gross contribution. This is presented in Equation 1 below, where subscript t denotes time period, i.e. year.

EU expenditure in the UK is then subtracted from the UK’s gross contribution to calculate the UK’s net contribution to the EU budget. Equation 2 lays this out below; here, in addition to subscript t, subscript j refers to the recipient country of EU expenditures (note that j = UK in Equation 2).
![]()
Statistics on gross contributions to the EU and EU expenditure are taken from European Commission DG Budget Data; they are available up to the most recent year of 2018.[8] European Commission yearly data are reported in nominal euros. In order for these nominal values to be comparable, it is necessary to convert them into real values at a constant price level: 2019 prices are used in this analysis. Values are also converted into GBP to aid the British reader. To do both of these, Consumer Price Indices (CPI) and official exchange rates are taken from the World Bank’s World Development Indicators (WDI).
UK contributions to the EU by budget heading
Second, we calculate the UK’s net fiscal contribution by expenditure category. That is, the UK’s spending in each EU budget heading, less any EU spend under that heading in the UK. The EU expenditure classification system uses four main budget headings (plus administration and other categories) to classify its spending[9]:
- Smart and Inclusive Growth – Expenditure in this area includes research and development, education and training, employment and social policy. Two further sub-headings are covered by this overarching category
- Competitiveness for growth and jobs
- Economic, social and territorial cohesion
- Sustainable Growth: Natural Resources – Expenditure in this area includes spending on the Common Agricultural Policy, fisheries, rural development, and measures aiming to contribute to food quality and a cleaner environment.
- Security & Citizenship – Expenditure in this area includes immigration, migration, security, and fundamental rights and justice
- Global Europe – Expenditure in this area is focused on EU foreign policy and international development.
- Administration and Other Categories – Expenditure classified as “administration” covers the functioning of the EU institutions, including remuneration and allowances for staff and members, pension costs, and rent and other building costs. Several minor expenditure categories are combined with “administration” under “other” in this analysis; these include compensations, negative reserves, and special instruments.
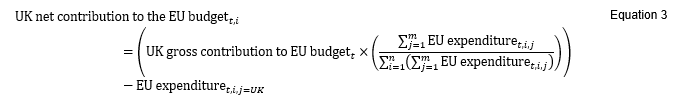
Equation 2 can be adapted into Equation 3 in order to calculate the UK’s net fiscal contribution to the EU budget which spent on a specific expenditure category, denoted by subscript i. For instance, this expenditure category could be budget heading “1. Smart & Inclusive Growth”, “2. Sustainable Growth: Natural Resources”, or “4. Global Europe”.
Equation 3 determines, for year t, the UK’s net fiscal contribution to the EU budget that is spent on expenditure category i. This is calculated as follows. The UK’s total gross contribution to the EU’s budget is multiplied by the share of total EU expenditure across all recipient countries that is spent on category i, before deducting category i EU expenditure in the UK. We are assuming here that the UK’s fiscal contribution to the EU goes into a general pot and is not ringfenced for any specific purpose.
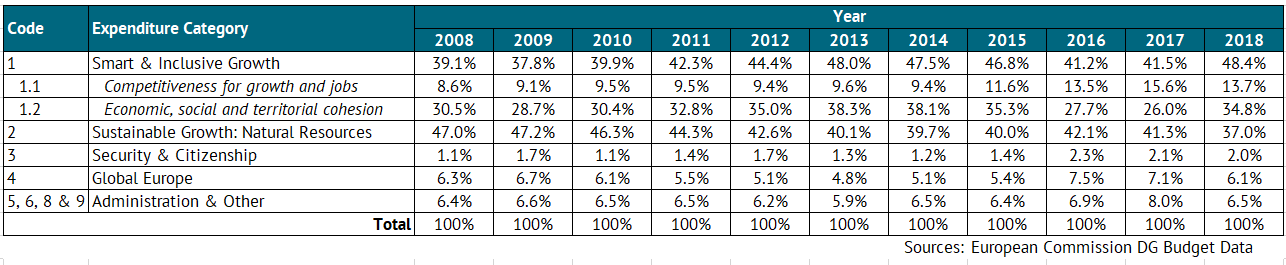
The UK’s net fiscal contribution to the EU budget spent on a particular expenditure category in a given year therefore not only depends upon the UK’s gross contribution or on UK receipts from the EU, but also upon the sectoral composition of EU expenditure. And this composition has indeed changed over time, with budget heading 1 expanding at the expense of heading 2. The table below presents this.
UK international spending within the EU
Our objective in this note is to determine the UK’s non-ODA overseas spending via the EU. Our final step is to focus on the EU budget headings which relate to this spending.
The first two headings–“1. Smart & Inclusive Growth” and “2. Sustainable Growth: Natural Resources”–have similar objectives to overseas aid, acting as vehicles for intra-EU redistribution to promote economic growth, regional convergence and rural development. The key difference being that they are spent in relatively prosperous EU countries which are not ODA-eligible. EU expenditure under headings 1 and 2 includes the following initiatives:
- European Regional Development Fund (ERDF)
- European Agricultural Guarantee Fund (EAGF)
- European Agricultural Fund for Rural Development (EAFRD)
- European Social Fund (ESF)
- Cohesion Fund (CF)
- Fund for European Aid to the Most Deprived (FEAD)
- European Maritime and Fisheries Fund (EMFF)
- LIFE Programme for the Environment and Climate Action
In this analysis, the UK’s net fiscal contribution to the EU budget spent under headings 1 and 2 is therefore defined to sum to the UK’s non-aid overseas spend through the EU.
Budget headings “3. Security and Citizenship” and “5. Administration and Other Categories” are excluded from this calculation as expenditure in these categories does not seek to promote traditional development objectives. Budget heading “4. Global Europe” is excluded as this expenditure category is primarily spent as aid, and so the UK’s net contribution to this budget heading is already counted towards the UK’s commitment to spent 0.7 percent of its GNI on ODA.
Undertaking the same exercise for other EU countries (using the methodology laid out above), we can also determine which countries are net recipients of EU funds under budget headings 1 and 2, and calculate the absolute value of their net receipts in these areas. Using this figure, we can calculate the proportion of overall net receipts in expenditure categories 1 and 2 which are allocated to a particular country.[10] These proportions are then used to determine the determine the geographic allocation of the UK’s net fiscal contribution in expenditure categories 1 and 2 (defined as the UK’s non-aid overseas spend through the EU). This is presented in figure 3.
Full Results and Tables
In this section, we present summary statistics and provide a detailed breakdown of our full results.
In our main findings, we focus on the period from 2014 onwards for our summary statistics, as these relate to the most recent Multi-Annual Finance Framework (MFF)[11].
Figure 3 presents the geographic distribution of the UK’s non-aid overseas EU spend by recipient countries. For the period 2014-18, it presents the UK’s absolute annual average net contribution to the EU budget spent on expenditure categories 1 and 2 and allocated according to the funding received by each net recipient EU country. Countries are ordered in terms of their GNI per capita, with the relatively richest countries on the left, and poorest on the right[12].
Figure 2: UK Non-Aid Overseas Spend via the EU* by Recipient Country, 2014-18 Annual Average (2019 GBP millions)
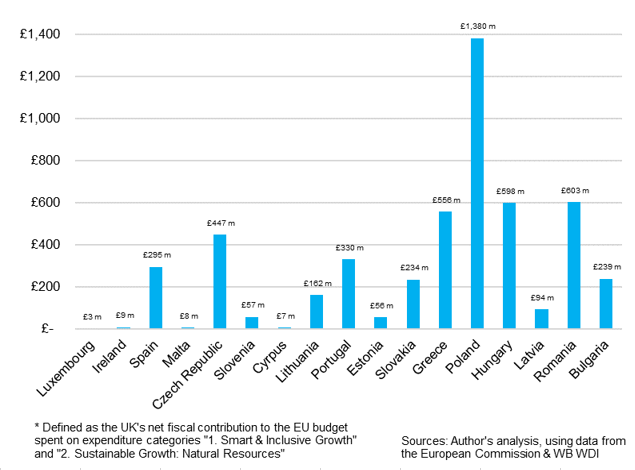
Table 4 presents a detailed breakdown of the UK’s net fiscal contributions to the EU budget by expenditure category for the years 2008 to 2018. Furthermore, it also reports statistics of the UK (post-rebate) gross contribution to the EU each year, as well as annual EU expenditure in the UK. Calculations are based upon Equation 3.
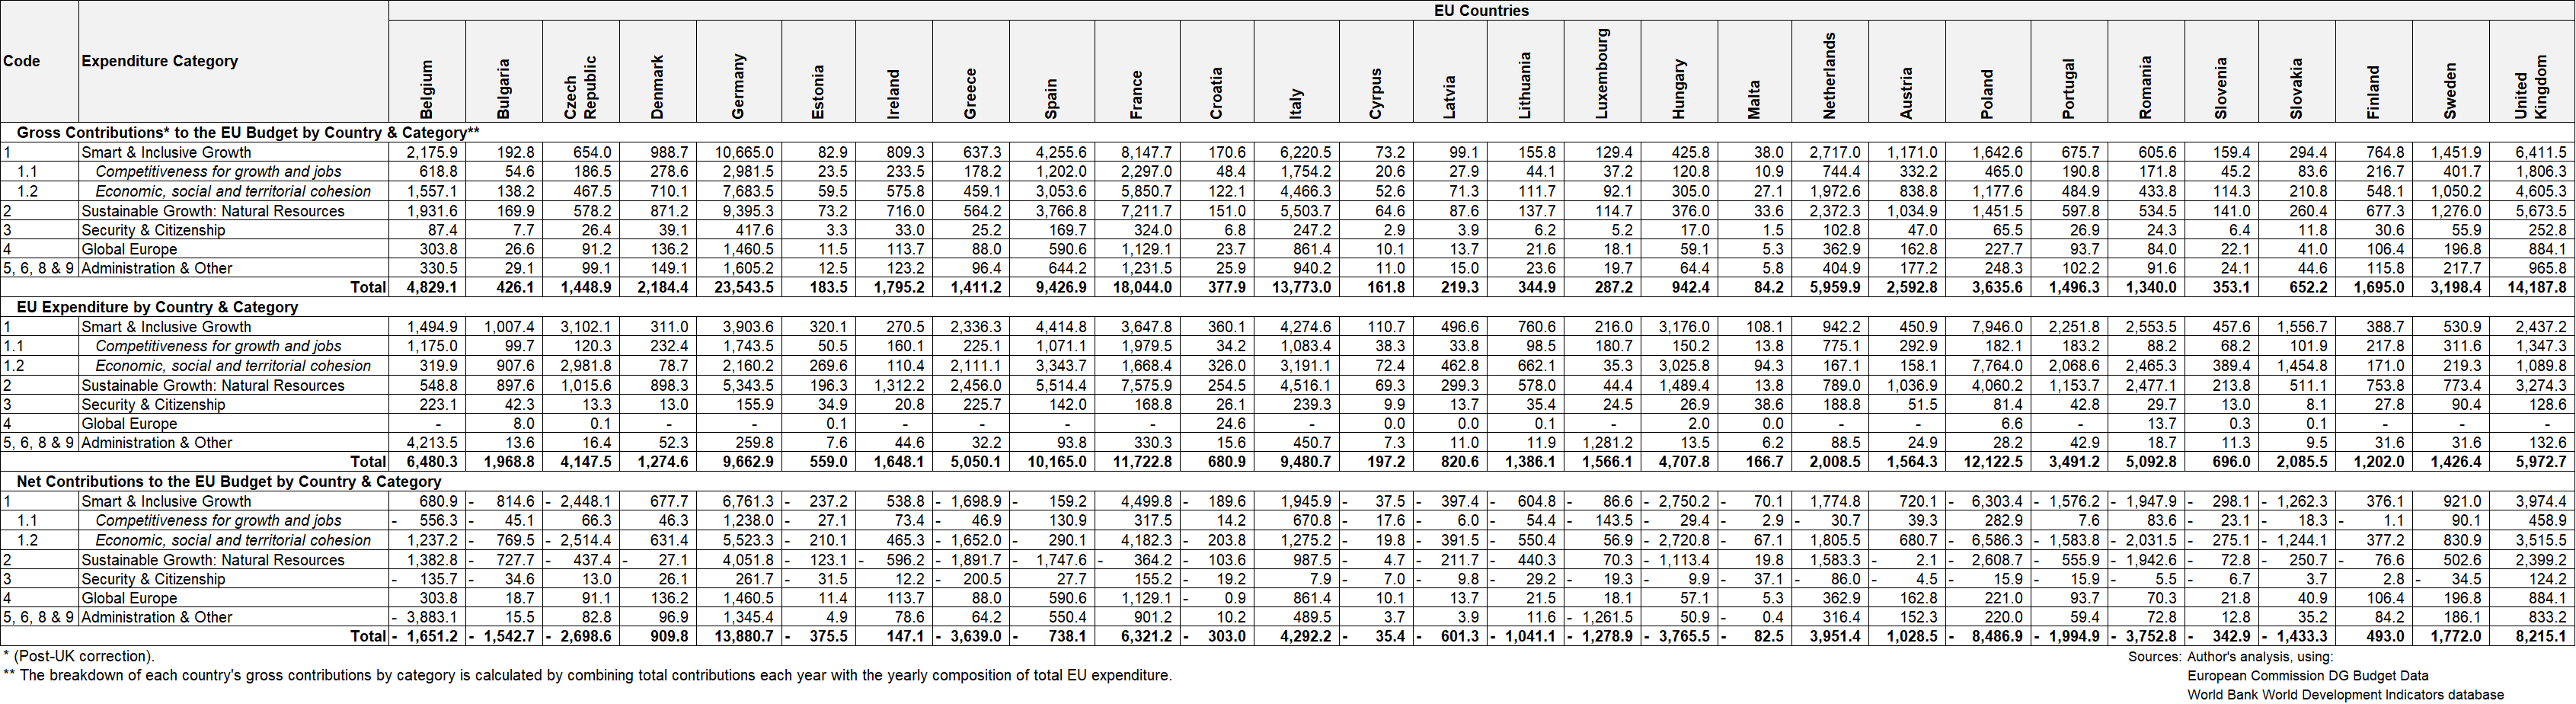
Table 5 presents the equivalent breakdown for the 2014-18 period for all EU countries. From this, it can be seen which EU countries are net recipients of EU funds in a particular expenditure category. This forms the input data to Figure 2, which looks at just categories “1. Smart and Inclusive Growth” and “2. Sustainable Growth: Natural Resources.”
ANNEX – Results Tables:
Table 4: UK Net Fiscal Contributions to the EU Budget by Year & Expenditure Category (2019 GBP millions), 2008 to 2018
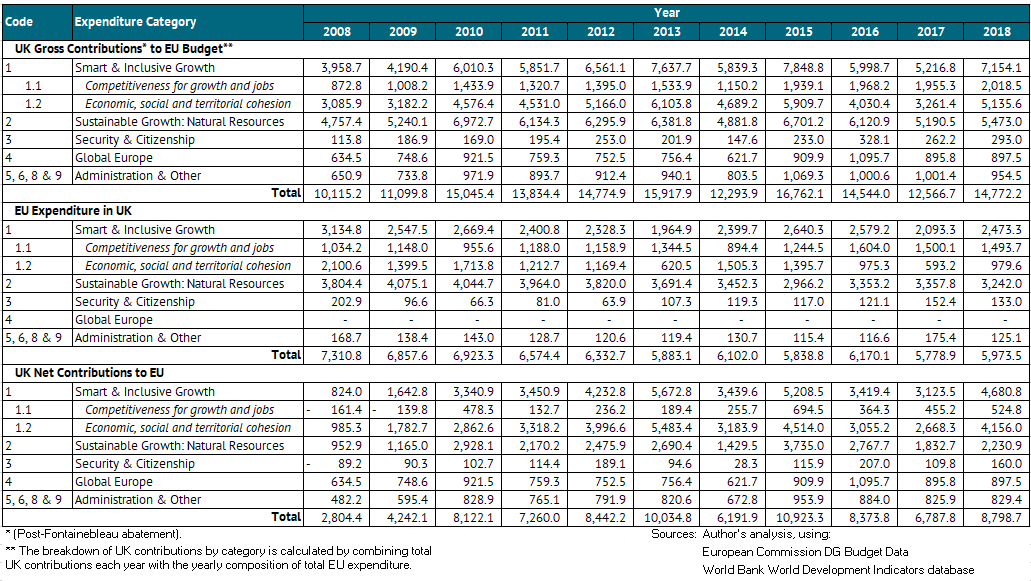
Table 5: Net Fiscal Contributions to the EU Budget by Country & Expenditure Category (2019 GBP millions), 2014 to 2018 Annual Average
[1] In this note, we use ‘aid’ as a shorthand for Official Development Assistance (ODA), the OECD’s definition for international development assistance. To quality, recipients must be eligible ‘developing countries’, which excludes “high income” countries and EU members.http://www.oecd.org/dac/financing-sustainable-development/development-finance-standards/daclist.htm
[2] James Browne, Paul Johnson & David Phillips (April 2016) The budget of the European Union: a guide. IFS Briefing Note BN181 https://www.ifs.org.uk/uploads/publications/bns/BN181.pdf
[3] Matthew Keep (March 2020) Brexit: the financial settlement - in detail. House of Commons Library Briefing Paper Number 8039 https://commonslibrary.parliament.uk/research-briefings/cbp-8039/
[5] Horizon 2020 is recorded in the EU expenditure classification system under sub-category “1.1. Competitiveness for growth and jobs”. This is a significant programme for the UK: in 2018 it comprised 38% of the UK’s receipts from the EU under expenditure category “1. Smart & Inclusive Growth”.
[6] World Bank Lending Groups, accessed 137th Jul 2020, https://datahelpdesk.worldbank.org/knowledgebase/articles/906519-world-bank-country-and-lending-groups
[7] In 2018 the (31) Low Income Countries (LICs) on average received ODA equivalent to 11.0% of their GNI. The average ODA/GNI ratio of the (47) LMICs in 2018 was 0.7%; and for upper-middle income countries it was 0.1%. World Bank World Development Indicators. See: http://wdi.worldbank.org/table/6.11
[8] Available from: https://ec.europa.eu/budget/graphs/revenue_expediture.html [accessed 29/06/2020]
[9] Note that these have been the titles of the EU expenditure categories since 2014. Prior to this, the name of each heading was slightly different to the current classification system. Between 2007 and 2013, heading 1 was instead labelled “Sustainable Growth”, 1.1 was called “Competitiveness for growth and employment”, 1.2 “Cohesion for growth and employment”, 2 “Preservation and Management of Natural Resources”, 3 “Citizenship, Freedom, Security and Justice”, 4 “The EU as a Global Partner”. Despite the difference in titles, these categories still correspond to the same types of expenditure as the current ones.
[10] Note that not all EU expenditure in categories 1 and 2 is recorded as being allocated to a specific EU country, although the vast majority is. Of the remainder, some is recorded as being “earmarked”, some under “other”, and some is allocated to non-EU countries. Therefore, it is important to note that our determination of the UK’s non-aid overseas spend in each EU country does not sum to our calculation of the UK’s total non-aid overseas spend via the EU.
[12] Note that these figures sum to £5bn, rather than the UK total spend on headings 1 and 2 of £6.4bn. The difference relates to spend not assigned to a country, and an amount of around £160m to non-EU countries.
Topics
CITATION
Mitchell, Ian, and Sam Hughes. 2020. The UK’s Fiscal Contribution to the EU Budget and its International Element. Center for Global Development.DISCLAIMER & PERMISSIONS
CGD's publications reflect the views of the authors, drawing on prior research and experience in their areas of expertise. CGD is a nonpartisan, independent organization and does not take institutional positions. You may use and disseminate CGD's publications under these conditions.