Recommended
Executive summary
This note updates and builds on analysis from 2014 by Stefan Dercon,[1] which projects carbon dioxide emissions by the poorest countries to understand their likely future contribution to global emissions. Whilst these countries’ emissions are currently very low, there is concern that rapid economic growth could alter this picture.
We assume that economic growth is rapid for the 52 poorest countries, home to 1.4 billion people, over the next decade, and that their economies each reach income per head of $6,000. We consider scenarios where the carbon intensity of their economies stays the same or increases to the average for lower-middle-income countries.
- In the latest data,[2] the 52 lowest income countries produced only 1.6 percent of global CO2 emissions in 2014, despite holding 19 percent of the world’s population. Looking at cumulative emissions, their contribution is even smaller.
- If the lowest income 52 countries grow their economies rapidly without changing the CO2 intensity of their economies (the ratio of CO2 to GNI), by 2030 their CO2 emissions per capita would still only be 8 percent of today’s emissions in the OECD.
- Even if all other countries reduced emissions linearly to net zero by 2050, emissions in the poorest countries would still only be 6 percent of global emissions in 2030, assuming they do not change the CO2 intensity of their income.
- Even relatively large changes in the CO2 intensity of income for the poorest countries make little difference in global terms. Even a steep increase in CO2 intensity of GNI in those countries (i.e., to typical current levels) would only increase their share of global emissions in 2030 from 6 to 11 percent. Per capita emissions in the OECD would be four times higher.
In summary, assuming the 52 poorest countries grow their economies very fast and with no “greening” of their economies, they will still make up a small fraction of global CO2 emissions.
Whilst there are, and will be, opportunities for these lower-income countries to take advantage of low-carbon technology, the vast majority of global emissions will remain in countries with higher incomes. This suggests that concerns about growth in emissions in low-income countries could be misplaced, and that efforts to materially reduce emissions will need to be concentrated elsewhere. In addition, as technological advances identify and implement opportunities that will eventually be passed on to lower-income countries, current efforts to reduce global emissions, in line with the Paris Agreement, seem likely to be more effective where greenhouse gas emissions per capita are highest.
We are grateful to a number of people for advice on our approach and in particular to Lee Robinson for his review of our modelling. Any views and all errors are those of the authors.
Introduction
Climate change is a threat to the life and living standards of poor people all over the world, and agencies are rightly responding. This note looks at what share of emissions the lowest income countries are currently responsible for, and, using a simple model, looks forward at how this might change in 2030 according to their growth and progress on emissions elsewhere in the coming decade. It concludes with some implications for the use of aid in relation to climate.
We update analysis by Dercon (2014), which showed that poor countries’ CO2 emissions were very likely to remain relatively small in global terms and suggested that concerns about growth in emissions in low-income countries could be misplaced.
The lowest income countries are the least to blame for climate change, having emitted the least. Cumulatively, the picture is stark. Of total of the 1.5 trillion tonnes CO2 emitted since 1751, the OECD has produced 59 percent, and the poorest 52 countries only 1 percent.[3] They have also benefited the least from the economic and technological development that caused climate change.
Figure 1. Cumulative CO2 emissions, 1751–2017 (million tonnes)

Source: Authors’ calculations using data from Our World in Data
The argument goes that although these countries might have low emissions now, as they get richer their emissions will rise, and so they need to get on a low-carbon path before they get richer or they will represent a major contributor to climate change. Below we look at recent (annual) emissions data (in thousand tonnes, Kt) which shows that low-income countries contribute just 1.6 of global emissions, even though they hold 19 percent of the world’s population—the same as China and more than the entire OECD.
Table 1. Global distribution of CO2 emissions (2014)
| CO2 emissions 2014 | Population | |||
|---|---|---|---|---|
| Country group | Kt | % world | Per capita | % world |
| OECD members | 12,151,111 | 33.6 | 9.6 | 18 |
| China | 10,291,927 | 28.5 | 7.5 | 19 |
| India | 2,238,377 | 6.2 | 1.7 | 18 |
| All others | 10,867,521 | 30.1 | 5.6 | 27 |
| Lowest income countries | 589,349 | 1.6 | 0.4 | 19 |
Source: Authors’ analysis of World Bank World Development Indicators.
In the remainder of this note, we consider various scenarios where lower-income countries do indeed grow rapidly to 2030 and look at how their emissions would change if they retain their current carbon intensity and if they follow a similar carbon path to other economies.
Approach
We follow the general approach laid out in Stefan Dercon’s 2014 paper “Climate Change, Green Growth and Aid Allocation to Poor Countries.” By updating this analysis with newer data for poorer countries up to a higher income threshold, we show that a key insight is still valid. The lowest income countries contribute very little to global climate change and will continue to do so even if they grow their economies without policies to “green” their growth.
Following Dercon, we use CO2 emissions rather than all greenhouse gas emissions. The commonly repeated goal of reaching net zero by 2050 generally refers to CO2. According to the Intergovernmental Panel on Climate Change, “limiting warming to 1.5°C implies reaching net zero CO2 emissions globally around 2050.”[4] The IPCC estimates that to keep to 1.5°C warming, we must reach net zero greenhouse gasses between 2060 and 2080.[5] A fuller analysis could include all greenhouse gases, with different date ranges.
Dercon (2014) defined the poorest countries as those with a GNI per capita of $3,500 or less, and projects what would happen if all these 52 countries were to increase their income to $4,000. Dercon selected this income level based on analysis by Martin Ravallion[6] that showed it would be “unlikely to be economically distortive or politically impossible” to eliminate extreme poverty using redistributive taxation.
We have picked a higher income threshold of $6,000 per capita GNI for three reasons. First, it allows us to keep a similar list of countries to that used by Stefan Dercon.[7] Second, even at this higher threshold, the countries concerned are still extremely poor. $6,000 per year GNI is slightly less than the average for lower-middle-income countries. On average, 14 percent of people in lower-middle-income categories live on less than $1.90 per day.[8] Third, even with this higher threshold, CO2 emissions remain low. Our group of countries includes 29 low-income countries, and 23 lower-middle-income countries. We use data from 2018 on GNI per capita at purchasing power parity (PPP). The richest large countries on our list are Nigeria and Pakistan. India is above the threshold.
We assume that on average GNI per capita in these countries increases to $6,000 by 2030 without any “greening” of their economies—that is, without any decrease in the carbon intensity of their GNI. Because we aggregate emissions for the whole group of countries, these assumptions are consistent with different variations at a country level. Richer countries like Nigeria and Nicaragua could reach $6,000 much earlier, and then level off their emissions by starting to “green” growth, whilst poorer countries grow extremely fast. This would be an excellent outcome for human development and would take us significantly towards the achievement of Sustainable Development Goal 1 to eliminate extreme poverty.
However, the assumptions are also consistent with a high common growth rate across these countries (also without any greening), which would make large economies in the group like Pakistan and Nigeria, much bigger emitters, while poorer countries do not reach $6,000 per year. This seems a more likely scenario. On average, to reach $6,000 a year GNI per capita, these countries would need to grow their GNI by 6.6 percent a year.
Total CO2 emissions for a country can be calculated by multiplying CO2 emissions per capita by population. CO2 emissions per capita can be defined as GNI per capita multiplied by the carbon intensity of GNI. We project CO2 emissions per capita by making assumptions about GNI and the carbon intensity of GNI.
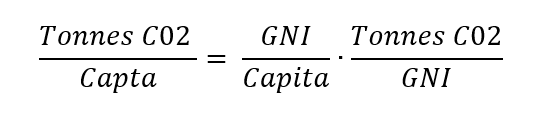
In order to project CO2 emissions per capita in future years for the 52 lowest income countries, we assume that these countries reach $6,000 GNI on average by 2030. We project two different growth paths using different assumptions about carbon intensity of GNI. Carbon intensity of GNI is calculated as tonnes of CO2 emitted divided by GNI (PPP, current international dollars).
The first scenario assumes that carbon intensity of GNI remains flat at 134 tonnes of CO2 per $1m of GNI. The second scenario assumes that carbon intensity of GNI increases to 244 tonnes per $1m of GNI, which was the average level in 2014 for lower-middle-income countries, which had an average GNI per capita of $7,585. On average, OECD countries emit 235 tonnes of CO2 for each $1m of GNI.
In order to consider how lower-income countries’ emissions might compare with other countries and the global total, we project two potential emissions pathways for the rest of the world, one optimistic and one pessimistic. In the first, we assume that all other countries starting in 2020 reduce their emissions linearly towards net zero in 2050. In the second, we assume that emissions in the rest of the world stay stable until 2030. This could be because decreases in emissions in some high-income countries are offset by increases in emerging economies.
Unless otherwise stated, all data is from the World Bank’s World Development Indicators. This analysis uses four datasets: GNI, PPP (current international $); GNI per capita, PPP (current international $); CO2 emissions (kt); and population (total, projected).
Results
Table 2 sets out the projected emissions and population to 2030 for the lowest income countries, and table 3 compares them to the OECD and global total (full results are available in the spreadsheet here).
In the “stable” scenario, where there is no change in the carbon intensity (greening) of their income, by 2030 these countries would still only have per capita emissions of 0.8 tonnes of CO2. This is less than a tenth of OECD countries’ per capita emissions today.
Table 2. Projected CO2 emissions: 52 lowest income countries
| Per capita | Thousand tonnes | Population (% world) | ||||
|---|---|---|---|---|---|---|
| 52 lowest income countries tonnes CO2 per $m GNI | 2014 | 2030 | 2014 | 2030 | 2014 | 2030 |
| Stable (134) | 0.4 | 0.80 | 589,349 | 1,583,955 | 19 | 23 |
| Rises (244) | 0.4 | 1.46 | 589,349 | 2,884,423 | 19 | 23 |
Source: Authors’ analysis of World Bank World Development Indicators.
If emissions in the rest of the world were to stay constant until 2030 (see table 3, scenario B, below), that would mean that despite holding 23 percent of the world’s population, the 52 lowest income countries would only produce 4 percent of global CO2 emissions.
Lower middle-income countries, whose average GNI per capita is just over $7,500, emit more CO2 for each dollar of GNI than the average of the 52 lowest income countries. It is therefore possible that as their economies grow, the poorest countries will become more CO2 intensive. But this is not assured. CO2 intensity of GNI has been steadily decreasing worldwide with GNI growing faster than emissions, including in both lower-middle-income countries and the lowest income 52 countries (see figure 2). It seems likely that with improvements of technology, growth will continue to outstrip emissions. However, if developing countries did follow this carbon-intensive path, what would be the outcome?
Figure 2. CO2 intensity of GNI
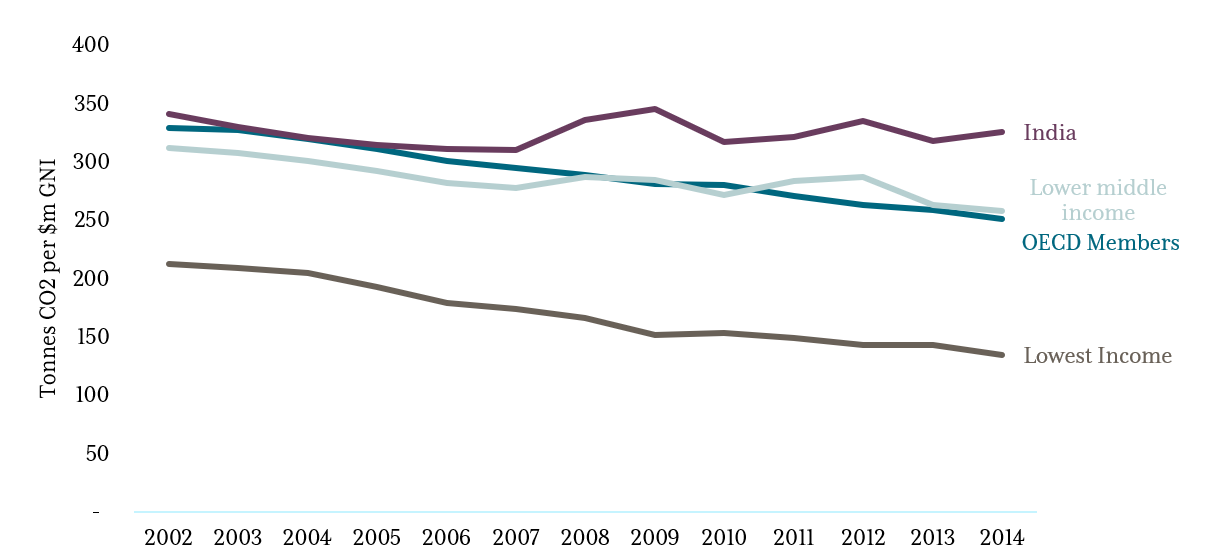
Source: Authors’ analysis of World Bank data: GNI PPP (constant international dollars), CO2 (tonnes)
In the “rises” scenarios (C and D), we assume again that all the 52 lowest income countries grew to $6,000 a year GNI per capita by 2030, but that the carbon intensity of their per capita income increases to the average for lower-middle-income countries in 2014 (the latest year for which we have emissions data). In this case, by 2030 the poorest countries would have CO2 emissions per capita of 1.46 tonnes. If all other countries froze their emissions (D), this would be 16 percent of per capita emissions in the OECD, and only 8 percent of total global emissions.
Even assuming the lowest income countries’ increase emissions intensity and all other countries (including China and India) begin reducing emissions today in line with net zero by 2050 (scenario C), in 2030 the 52 lowest income countries would still make up only 11 percent of global carbon emissions. In per capita terms, their emissions would still be only one-quarter of those of OECD countries.
Table 3. Projected share of global and OECD emissions for 52 lowest income economies
| Scenario | Assumptions | % of global CO2 emissions (tonnes CO2 per $m GNI) | CO2 emissions per capita % of OECD | |||
|---|---|---|---|---|---|---|
| Lowest income 52 countries Tonnes CO2 per $m GNI | All other countries’ emissions | 2014 | 2030 | 2014 | 2030 | |
| A | Stable (134) | Net zero by 2050 | 1.6 | 6 | 4 | 14 |
| B | Stable (134) | stable | 1.6 | 4 | 4 | 9 |
| C | Rises (244) | Net zero by 2050 | 1.6 | 11 | 4 | 25 |
| D | Rises (244) | stable | 1.6 | 8 | 4 | 16 |
Source: Authors’ analysis of World Bank World Development Indicators.
The two scenarios for emissions in low-income countries which we outline are radically different relative to low-income countries current emissions. The higher emission path implies 82 percent higher emissions by 2030 than the lower. However, in global terms they are small. If all other countries reduce emissions in line with net zero by 2050, the “stable” lower emissions path implies that global emissions would fall by 33 percent. The “rises” higher emissions path implies that global emissions would fall by 29 percent.
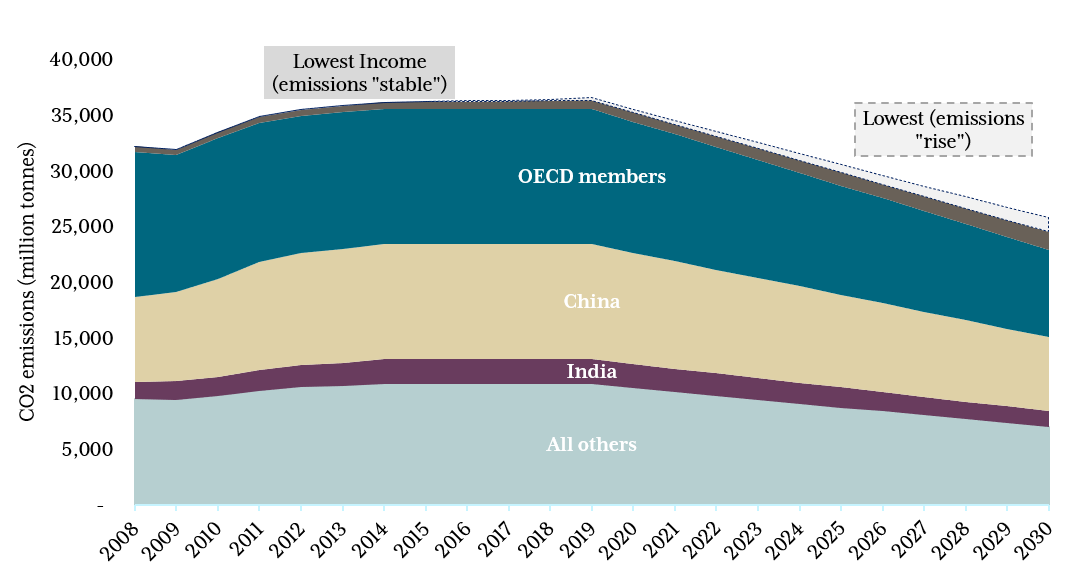
Figure 3 visualises this point. It shows how global emissions would be distributed assuming that all other countries reduce their emissions linearly towards net zero in 2050. The green section shows how significant the lowest income 52 countries emissions would be if CO2 intensity remained stable. The pink section shows the extra emissions if CO2 intensity rose.
Figure 3. Projected global CO2 emissions assuming all other countries reach net zero by 2050

Source: Authors’ projections using World Bank data
Conclusion
Updating Dercon’s 2014 paper “Climate Change, Green Growth and Aid Allocation to Poor Countries,”[9] we show that the poorest 52 countries currently produce only 1.6 percent of global CO2 emissions (575mt per year)—less than Germany alone. The OECD produces 34 percent (12,151mt), despite having a smaller population.
The Sustainable Development Goals and development efforts are keen to see strong economic growth, and we consider a scenario where each of these countries’ GNI grows to $6,000 per head by 2030 and consider the implications for global emissions.
Our simple model of the future path of global CO2 emissions shows that even if the rest of the world makes straight-line progress towards zero emissions in 2050, and even if the poorest 52 grow very rapidly with a historically consistent rise in the carbon intensity of GNI, then those 52 countries will still only account for only eleven percent of global emissions. In arguably more likely scenarios, it would be 6-8 percent; or potentially as low as 4 percent.
In conclusion, even radical reductions in emissions in the poorest countries will have very small effects on the global goal of reaching net zero carbon emissions by 2050.
References
Dercon, S. 2014. "Climate Change, Green Growth and Aid Allocation to Poor Countries," CSAE Working Paper Series 2014-24, Centre for the Study of African Economies, University of Oxford.
Intergovernmental Panel on Climate Change (2018) Special report: Global Warming of 1.5, Chapter 2: “Mitigation Pathways Compatible with 1.5°C in the Context of Sustainable Development,” page 95.
Our World in Data: Cumulative CO2 emissions. https://ourworldindata.org/co2-and-other-greenhouse-gas-emissions
Ravallion, M. 2010. "Do Poorer Countries Have Less Capacity for Redistribution?" Journal of Globalization and Development. 1(2), Article 1: 1-28.
Annex 1. List of 52 poorest countries
| Country name | ISO | World Bank Income Group (2019) | GNI per capita PPP, 2018 |
|---|---|---|---|
| Afghanistan | AFG | LIC | 1,960 |
| Burundi | BDI | LIC | 740 |
| Benin | BEN | LIC | 2,400 |
| Burkina Faso | BFA | LIC | 1,920 |
| Bangladesh | BGD | LMIC | 4,560 |
| Central African Republic | CAF | LIC | 870 |
| Cote d'Ivoire | CIV | LMIC | 4,030 |
| Cameroon | CMR | LMIC | 3,700 |
| Congo, Dem. Rep. | COD | LIC | 900 |
| Congo, Rep. | COG | LMIC | 5,050 |
| Comoros | COM | LMIC | 2,730 |
| Eritrea | ERI | LIC | 2,080 |
| Ethiopia | ETH | LIC | 2,010 |
| Ghana | GHA | LMIC | 4,650 |
| Guinea | GIN | LIC | 2,480 |
| Gambia, The | GMB | LIC | 1,680 |
| Guinea-Bissau | GNB | LIC | 1,790 |
| Honduras | HND | LMIC | 4,780 |
| Haiti | HTI | LIC | 1,870 |
| Kenya | KEN | LMIC | 3,430 |
| Kyrgyz Republic | KGZ | LMIC | 3,780 |
| Cambodia | KHM | LMIC | 4,060 |
| Liberia | LBR | LIC | 1,130 |
| Lesotho | LSO | LMIC | 3,610 |
| Madagascar | MDG | LIC | 1,580 |
| Mali | MLI | LIC | 2,230 |
| Mozambique | MOZ | LIC | 1,300 |
| Mauritania | MRT | LMIC | 4,160 |
| Malawi | MWI | LIC | 1,310 |
| Niger | NER | LIC | 1,030 |
| Nigeria | NGA | LMIC | 5,700 |
| Nicaragua | NIC | LMIC | 5,390 |
| Nepal | NPL | LIC | 3,090 |
| Pakistan | PAK | LMIC | 5,840 |
| Papua New Guinea | PNG | LMIC | 4,150 |
| West Bank and Gaza | PSE | LMIC | 5,990 |
| Rwanda | RWA | LIC | 2,210 |
| Sudan | SDN | LMIC | 4,420 |
| Senegal | SEN | LMIC | 3,670 |
| Solomon Islands | SLB | LMIC | 2,280 |
| Sierra Leone | SLE | LIC | 1,520 |
| Somalia | SOM | LIC | 316 |
| South Sudan | SSD | LIC | 1,550 |
| Sao Tome and Principe | STP | LMIC | 3,430 |
| Chad | TCD | LIC | 1,920 |
| Togo | TGO | LIC | 1,760 |
| Tajikistan | TJK | LIC | 4,040 |
| Tanzania | TZA | LIC | 3,160 |
| Uganda | UGA | LIC | 1,970 |
| Yemen, Rep. | YEM | LIC | 2,570 |
| Zambia | ZMB | LMIC | 4,100 |
| Zimbabwe | ZWE | LMIC | 3,010 |
Source: World Development Indicators, World Bank
Note: LIC = low-income country; LMIC= lower-middle-income country
[1] Stefan Dercon, 2014. "Climate Change, Green Growth and Aid Allocation to Poor Countries," CSAE Working Paper Series 2014-24, Centre for the Study of African Economies, University of Oxford.
[2] 2014 is the latest year for which the World Bank produces CO2 emissions data for all countries.
[3] Author’s analysis of data from Our World in Data, https://ourworldindata.org/co2-and-other-greenhouse-gas-emissions
[4] IPCC (2018) Special report: Global Warming of 1.5, Chapter 2: “Mitigation Pathways Compatible with 1.5°C in the Context of Sustainable Development,” page 95
[5] Ibid, page 116
[6] Ravallion, M. 2010, "Do Poorer Countries Have Less Capacity for Redistribution?" Journal of Globalization and Development. 1(2), Article 1: 1-28.
[7] Three countries considered by Dercon—Laos, Myanmar, and Guyana (with GNI per capita of $6,480; $7,090; and $8,570, respectively)—no longer fall into this category in our analysis. However, three countries not considered by Dercon do fall into this category: Honduras, Nicaragua, and West Bank and Gaza (with GNI per capita of $4,780; $5,390; and $5,990).
[8] World Bank, poverty headcount $1.90
[9] Stefan Dercon, 2014. "Climate Change, Green Growth and Aid Allocation to Poor Countries," CSAE Working Paper Series 2014-24, Centre for the Study of African Economies, University of Oxford.
Topics
CITATION
Baker, Arthur, and Ian Mitchell. 2020. Projecting Global Emissions for Lower-Income Countries. Center for Global Development.DISCLAIMER & PERMISSIONS
CGD's publications reflect the views of the authors, drawing on prior research and experience in their areas of expertise. CGD is a nonpartisan, independent organization and does not take institutional positions. You may use and disseminate CGD's publications under these conditions.