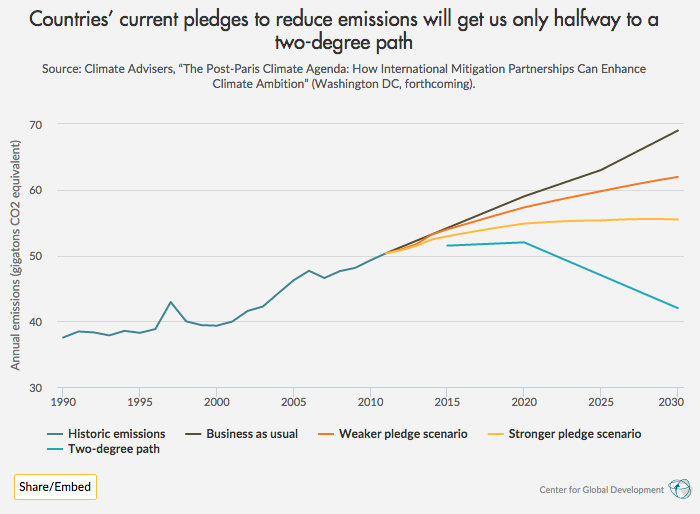
Year,Historic emissions,Business as usual,Weaker pledge scenario,Stronger pledge scenario,Two-degree path
1990,37527.34215,,,,
1991,38440.16112,,,,
1992,38301.73628,,,,
1993,37851.23027,,,,
1994,38539.73541,,,,
1995,38232.89203,,,,
1996,38810.18051,,,,
1997,42922.72193,,,,
1998,39995.06906,,,,
1999,39409.64001,,,,
2000,39323.87726,,,,
2001,39951.18235,,,,
2002,41561.09582,,,,
2003,42242.9844,,,,
2004,44255.60642,,,,
2005,46231.07858,,,,
2006,47675.22597,,,,
2007,46578.21172,,,,
2008,47617.63235,,,,
2009,48118.77307,,,,
2010,49267.82195,,,,
2011,50331.76433,50331.76433,50331.76433,50331.76433,
2012,,51294.90163,50927.26749,50801.26125,
2013,,52258.03893,51744.25767,51480.66874,
2014,,53221.17622,53210.72643,52438.61004,
2015,,54184.31352,53967.31217,52921.76972,51500
2016,,55147.45082,54648.65774,53346.1489,51600
2017,,56110.58811,55328.1772,53755.29148,51700
2018,,57073.72541,56002.25457,54145.09622,51800
2019,,58036.8627,56666.79246,54510.96806,51900
2020,,59000,57317.1629,54847.76775,52000
2021,,59800,57836.61279,55011.05825,51000
2022,,60600,58344.54375,55144.16638,50000
2023,,61400,58838.95601,55244.42204,49000
2024,,62200,59317.79821,55309.07241,48000
2025,,63000,59778.95997,55335.27147,47000
2026,,64200,60256.73095,55448.21049,46000
2027,,65400,60715.29642,55521.40797,45000
2028,,66600,61152.23537,55551.76478,44000
2029,,67800,61565.01354,55536.03558,43000
2030,,69000,61950.96187,55470.80406,42000

More Reading

Blog Post
India Should Keep Forests in the Fiscal Devolution Formula
Jonah Busch
et al.
October 24, 2019


