Update: On August 2, 2017, White House senior adviser Stephen Miller called for slashing U.S. immigration by half, citing the study that is discussed in this blog post. A more recent discussion of the flaws in that study is here, and the updated research paper is here.
Do immigrants from poor countries hurt native workers? A study by an influential immigration economist at Harvard University recently found that a famous flood of Cuban immigrants into Miami dramatically reduced the wages of native workers.
That study lit a small fire last year in The Atlantic, National Review, and New Yorker. Celebrity advocates of restricting immigration declared that the study had “nuked” their opponents’ views. The study, by George Borjas, is a centerpiece of his own mass-market book on immigration, We Wanted Workers, cited by the U.S. Attorney General as proving the economic harms of immigration.
But there’s a problem. The Borjas study had a critical flaw that makes the finding spurious. That flaw is explained in a new research paper that I co-authored with Jennifer Hunt, who is the James G. Cullen Professor of economics at Rutgers University. In this blogpost, I explain the flaw and why it reinforces earlier findings that the Mariel Boatlift influx of Cuban immigrants did not reduce wages of Miami workers.
The flaw was not known to the academic peers who reviewed the study for publication. The finding that the Cuban immigrants caused Miami wages to collapse is an artifact of how the study handles its data. The study is based on a wage survey from a sample of workers. The study focuses on a small group within that larger sample, a group where the sample shifted to include a lot more black male workers with relatively low wages—simultaneously with the Boatlift. This has the effect of sharply reducing the average wage of people in the sample, but this had nothing to do with the Cuban influx.
This is noteworthy because what happened in Miami is the one historical event that has most shaped how economists view immigration. To explain what went wrong, I have to pan out and describe the historical setting under study.
The Mariel Boatlift
For an economist there’s a straightforward way to study how low-skill immigration affects native workers. Find a large, sudden wave of low-skill immigrants arriving in one city only. Watch what happens to wages and employment for native workers in that city, and compare that to other cities where the immigrants didn’t go.
An ideal experiment like this actually happened in Miami in 1980. Over just a few months, 125,000 mostly low-skill immigrants arrived from Mariel Bay, Cuba. This vast seaborne exodus is known as the Mariel Boatlift. The workforce of Miami rose by 8%, the low-skill workforce shot up by 20%. If immigrants compete with native workers, this is exactly where you should see natives’ wages drop. Of course, if they did drop, you would want to make sure that it wasn’t just a regional or national trend. You would compare wage trends in Miami after 1980 to the same trends in other, similar cities that didn’t get a migrant surge.
Economist David Card of U.C. Berkeley did exactly this, in a massively influential study in 1990. Card’s work became one of the most cited economic studies of immigration. The design of the study was elegant and transparent. But even more than that, what made the study memorable was what Card found.
Nothing. The Card study found no difference in wage or employment trends in Miami, flooded with new low-skill workers, and other cities—not for any workers, including low-skill workers. That study concluded that “the Mariel immigration had essentially no effect on the wages or employment outcomes of non-Cuban workers in the Miami labor market.”
Economists ever since have tried to explain this remarkable result. Was it that the affected U.S. workers had simply moved away? Had low-skill Cubans made native Miamians more productive, stimulating the local economy? Was it that the Cubans’ own demand for goods and services had generated as many jobs as they filled? Was it that Miami employers shifted to production technologies that used more low-skill labor? Regardless, the real-life economy was evidently more complex than an ‘Econ 101’ model requiring wages to fall when immigrant labor arrives.
A critical flaw
This is where Borjas’s study came in, in 2015. The new paper by Borjas claimed that Card’s earlier analysis had obscured a large fall in the wages of native workers by using too general a definition of ‘low-skill worker’. Card’s study had looked at the wages of U.S. workers whose education extended only to high school or less.
Borjas’s paper divided up this group. It separately measured the wages of two slices of that larger group: 1) people who never finished high school, and 2) people who finished high school but went no further. It found that in the less-than-high-school group, wages plummeted right in 1980, just the year when all those low-skill Cubans had arrived. That happened in Miami to a much greater degree than in other cities. The study estimated that the Mariel Boatlift had slashed the wages of U.S. workers with less than high school by somewhere between 10 and 30 percent. It seemed like a smoking gun.
But it was in that act of slicing the data that the spurious result was generated. It created data samples that, exactly in 1980, suddenly included far more low-wage black males—accounting for the whole wage decline in those samples relative to other cities. Understanding how that happened requires understanding the raw data.
Both the Card and Borjas papers use data from the Current Population Survey or CPS, a representative sample survey of U.S. workers. This survey happens every month; it’s where we get the estimates for the U.S. unemployment rate. Two datasets taken from the CPS also report workers’ wages. These two datasets are called the ‘March Supplement’ and the ‘Outgoing Rotation Group’ (ORG). These aren’t surveys of all workers, but of a small number of workers chosen randomly from within subsets of the population, so that their answers to questions about wages will be representative of the wages of others like them.
Right in 1980, the Census Bureau—which ran the CPS surveys—improved its survey methods to cover more low-skill black men. The 1970 census and again the 1980 census had greatly undercounted low-skill black men, both by failing to identify their residences and by failing to sufficiently probe survey respondents about marginal or itinerant household members. There was massive legislative and judicial pressure to count blacks better, particularly in Miami. Starting in the 1981 CPS, survey coverage of lower-skill black men shifted sharply to include relatively more black men with less-than-high-school, and relatively fewer black men who had completed high school.
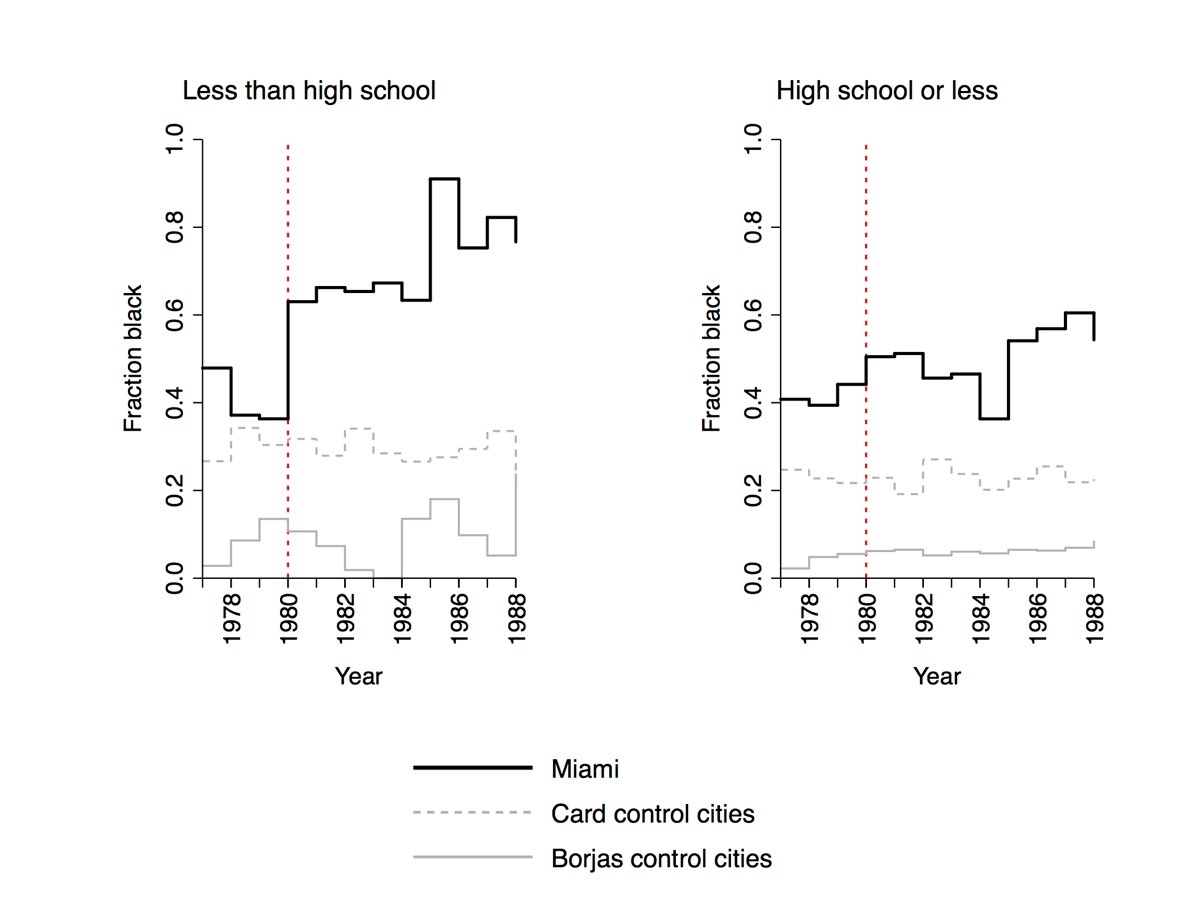
You can see the sample shift sharply in the graph below. In all graphs here, the 1981 CPS is shown above the year 1980 (as in the Borjas paper) because the wages reported there were mostly earned in late 1980.
On the left is the fraction of black workers in the exact March CPS samples used in the Borjas paper: male, non-Hispanic employed workers age 25–59, with less than high school. On the right is the same ‘fraction black’ in the same dataset, using the broader definition of low-skill used the Card paper: high school or less. The black line shows workers in Miami.
On the left, that’s a huge jump in the composition of the Miami sample in 1980. The fraction of blacks in the Borjas paper’s sample goes from just one third of the sample to two thirds, exactly when the Boatlift happens. Those new workers being surveyed aren’t the Cubans themselves: remember these are the non-Hispanic workers. And in the years thereafter the black fraction rises still more, reaching 91% (!) in 1985. That doesn’t happen among the broader education category used in the Card paper, on the right.
Those graphs show the same trends in the ‘control’ cities. Remember that both researchers test the effects of the Boatlift by comparing wages in Miami to wages in other, comparable cities that didn’t receive an immigrant surge. The two researchers choose these cities in slightly different ways, both of them based on finding cities with employment trends similar to Miami’s trend around the same time. Card uses Atlanta, Los Angeles, Houston, and Tampa-St. Petersburg; Borjas uses Anaheim, Rochester, Nassau-Suffolk, and San Jose.
But the black fraction doesn’t jump up in the samples from either group of ‘control’ cities. In fact, the fraction black in the control cities that the Borjas paper focuses on falls after 1980, actually reaching zero in 1983. At some points the Borjas study is comparing a city whose survey dataset is massively shifting to cover more low-wage blacks to cities where the CPS didn’t interview a single black man at this skill level.
The spurious finding
This shift in sample coverage of blacks is what creates the fall in measured wages. Among men in Miami with less-than-high-school at this time, wages are much lower among blacks than non-black workers. So including more blacks in the sample would make the average wage in the sample fall, even if nothing happened to the wages of any workers in the real population of Miami where the sample was picked. Take the shift in blacks in the sample, multiply it by the black-nonblack wage gap, and you get the fall in wages that would appear in sample used in the Borjas study.
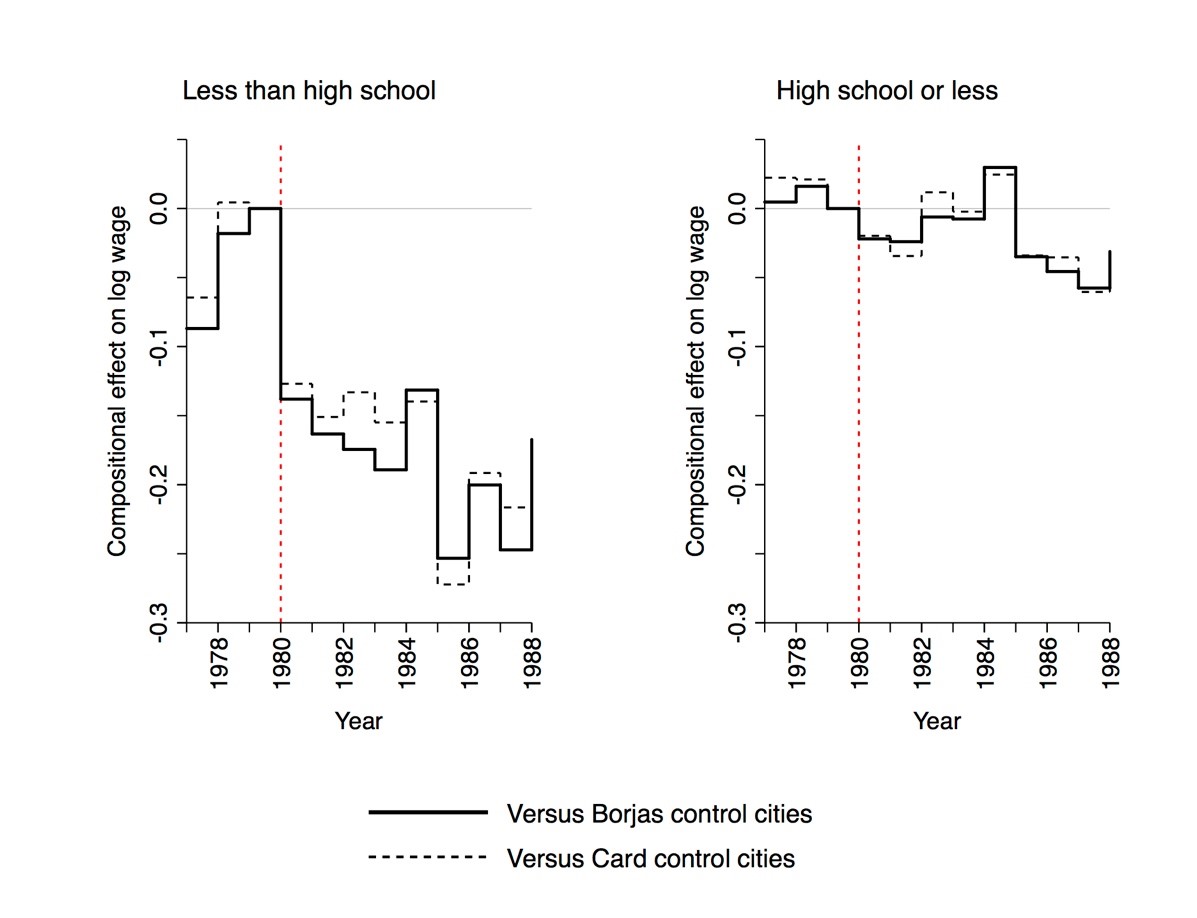
For example, the black fraction in the survey sample went up between 1979 and 1985 by 51 percentage points more in Miami than it did in the samples from the main control cities considered in the Borjas study. Multiply that by the 49% relative gap in wages between blacks and non-blacks among very low-skill workers in this time and place, and you get 25% lower wages by 1985 just from including more low-wage blacks in the survey. The graph on the left below does this for all the years after 1980:
The vertical axis there is roughly comparable to a percent change in the wage, where –0.1 is a 10% decline and –0.2 is a 20% decline (it’s the change in logarithm points). Looking at that graph you can see that the inclusion of more low-wage blacks in the sample would cause the average wage to fall drastically, a decline that hits about 25% a few years after 1980.
The effect of the Mariel Boatlift measured by Borjas is “between 10 and 30 percent”. In other words, the spurious decline in wages explains the entire effect estimated in Borjas’s study.
On the right, in the figure above, is the spurious wage decline that you would get if you studied wages in the Card paper’s broader education category of high-school-or-less. You saw above that there was a much smaller shift in the number of blacks surveyed in that broader group. There’s also a smaller gap between black and nonblack wages in that group. So the estimated wage drop following the Mariel Boatlift would be negligible using the grouping of workers in Card’s paper: just 2 or 3% for a couple of years, not enough to show up among the statistical noise. Card’s study was therefore essentially unaffected by the bias of shifting sample coverage. This can explain why the Card and Borjas studies reach such sharply different conclusions.
What I’m discussing here is just one of many ways that this change in the composition of the survey sample can explain discrepancies between earlier studies of the Boatlift. One of these is that a study by Giovanni Peri and Vasil Yasenov of U.C. Davis showed that the results in the Borjas study are sensitive to which dataset one uses. I mentioned above that the CPS has two wage surveys each year. The above graphs are for the March CPS that the Card paper used, and Borjas’s paper focuses on. Peri and Yasenov showed that the result is much smaller in the other wage survey (the ‘ORG’ survey), a result that is discussed in revised versions of the Borjas study. Specifically, the wage effect estimate in the Borjas study is three times larger in the March CPS survey data than it is in the ORG data. There is no clear reason why the true effect of an immigration wave would change that much between two different surveys. But our paper has a simple and definitive explanation for this result: the post-1980 increase in coverage of low-wage blacks is three times larger in the March CPS than in the ORG data. The glove fits, in this way and several others that we discuss in our paper.
The origin of this problem is the way that the survey data are sliced in the Borjas study. When the Census Bureau picks people to survey who will represent the population, they only choose them to represent broad categories of people. If researchers slice up the data too finely, the Census Bureau can’t promise that those slices will represent the population anymore. For example, if you narrowly sliced the data to include only 53 year-old female Peruvian-American surgeons, you might find that very few (or no) such people happened to have been included in the survey sample. But such a very small (or empty) group would not necessarily represent all people of that description in any given city.
A less extreme example is what happened in the March CPS data of Miami: under pressure to improve coverage of low-skill black men, their efforts led to a shift within their sample of black men with high school or less. Within that group, right after the Mariel Boatlift, they began covering far more black men with less than high school, and relatively fewer who had finished high school. That wouldn’t change the racial representativeness of the broader high-school-or-less group. By slicing that group too finely, the Borjas study created a sub-group where the representativeness of the population changed sharply, at precisely the moment that a wage decline would be inaccurately attributed to the Boatlift.
More light, less heat
The evidence from the Mariel Boatlift remains as found in David Card’s seminal research: there is no evidence that wages fell, or unemployment rose, among the least-skilled workers in Miami even after a sudden refugee wave raised the size of that workforce by 20%.
This does not by any means imply that large waves of low-skill immigration do not or could not displace any native workers, especially in the short term. But facile pronouncements in recent statements by politicians, that immigrants necessarily do harm native workers, must grapple with rigorously-studied real-world experiences to the contrary. The Mariel Boatlift remains one of the most enlightening experiences of this kind.
Update: On August 2, 2017, White House senior adviser Stephen Miller called for slashing U.S. immigration by half, citing the study that is discussed in this blog post. A more recent discussion of the flaws in that study is here, and the updated research paper is here.
¿Los inmigrantes de países pobres afectan negativamente a los trabajadores locales? Un estudio de un influyente economista que trabaja en temas de inmigración de la Universidad de Harvard descubrió recientemente que una famosa entrada de inmigrantes cubanos en Miami redujo drásticamente los salarios de los trabajadores locales.
Ese estudio generó una discusión acalorada el año pasado en The Atlantic, National Review y New Yorker. Los defensores célebres de la restricción de la inmigración declararon que el estudio había "derrotado" a las opiniones de sus opositores. El estudio de George Borjas es una pieza central en su famoso libro sobre inmigración, We Wanted Workers, citado por el Fiscal General de EE.UU. como prueba de los efectos económicos negativos de la inmigración.
Pero hay un problema. El estudio de Borjas tiene un defecto crítico que hace que el hallazgo sea espurio. Ese defecto se explica en un nuevo trabajo de investigación que coescribí con Jennifer Hunt, profesora James G. Cullen de Economía en la Universidad de Rutgers. En este blog post, explico el defecto y por qué refuerza los hallazgos de que el influjo de inmigrantes cubanos a partir del Éxodo del Mariel no redujo los salarios de los trabajadores de Miami.
La falla no era conocida por los economistas que revisaron el estudio para su publicación. El hallazgo de que los inmigrantes cubanos causaron el colapso de los salarios de Miami es un artefacto sobre cómo el estudio maneja su data. El estudio se basa en una encuesta de salarios de una muestra de trabajadores. El estudio se centra en un pequeño grupo dentro de esa muestra más grande, el cual se modificó para incluir a muchos más trabajadores hombres de raza negra con salarios relativamente bajos--simultáneamente con el Éxodo del Mariel. Esto tiene el efecto de reducir drásticamente el salario medio de las personas en la muestra, pero esto no tiene nada que ver con el influjo de cubanos.
Esto es digno de atención pues lo que sucedió en Miami es el evento histórico que más ha determinado la manera en que los economistas estudian la inmigración. Para explicar lo que salió mal, tengo que explorar y describir el escenario histórico bajo estudio.
El Éxodo del Mariel
Para un economista hay una manera directa de estudiar cómo la inmigración de mano de obra poco calificada afecta a los trabajadores locales. Encuentre una entrada grande y repentina de inmigrantes de baja cualificación solo a una ciudad. Observe lo que sucede con los salarios y el empleo de los trabajadores locales en esa ciudad, y compare esto con otras ciudades donde los inmigrantes no llegaron.
Un experimento ideal como este ocurrió en Miami en 1980. En apenas unos meses, 125 000 inmigrantes, en su mayoría de baja cualificación, llegaron de la bahía de Mariel, Cuba. Este inmenso éxodo marítimo se conoce como el Éxodo del Mariel. La fuerza laboral de Miami aumentó en 8%, la mano de obra poco calificada se disparó en 20%. Si los inmigrantes compiten con los trabajadores locales, este es exactamente donde se debería ver una caída de los salarios de los locales. Por supuesto, si cayeron, usted quisiera asegurarse de que esta caída no fuese una tendencia regional o nacional. Compararía las tendencias salariales en Miami después de 1980 con las mismas tendencias en otras ciudades similares que no obtuvieron una entrada migratoria.
El economista David Card de U.C. Berkeley hizo exactamente esto, en un estudio de gran influencia en 1990. El trabajo de Card se convirtió en uno de los estudios económicos más citados sobre inmigración. El diseño del estudio fue elegante y transparente. Pero aún más que eso, lo que hizo que el estudio fuera memorable fue lo que encontró Card.
Nada. El estudio de Card no encontró ninguna diferencia en las tendencias de salarios o empleo en Miami, la cual recibió nuevos trabajadores poco calificados, y otras ciudades--no para cualquier trabajador, incluyendo trabajadores poco calificados. Ese estudio llegó a la conclusión de que "la inmigración del Mariel tuvo esencialmente ningún efecto sobre los salarios o el empleo de los trabajadores no cubanos en el mercado de trabajo de Miami".
Desde entonces, los economistas han intentado explicar este notable resultado ¿Acaso los trabajadores estadounidenses afectados simplemente se mudaron a otro lado? ¿Los cubanos poco calificados hicieron que a los nativos locales de Miami fueran más productivos, estimulando la economía local? ¿Fue que la demanda de bienes y servicios de los cubanos mismos generó tantos empleos como los que llenaron? ¿Fue que los empleadores de Miami migraron hacia tecnologías de producción que requieren más mano de obra poco calificada? Sin embargo, la economía en el mundo real era evidentemente más compleja que un modelo 'Econ 101' que requiere que los salarios caigan cuando llegan inmigrantes.
Un defecto crítico
Aquí es cuando entra el estudio de Borjas, en 2015. El nuevo artículo de Borjas afirmó que el análisis de Card había oscurecido una gran caída en los salarios de los trabajadores nativos al usar una definición demasiado general de "trabajador poco calificado". El estudio de Card había examinado los salarios de los trabajadores estadounidenses cuya educación sólo se extendía hasta la escuela secundaria o menos.
El trabajo de Borjas dividió a este grupo. Midió por separado los salarios de dos proporciones de ese grupo más grande: 1) personas que nunca terminaron la escuela secundaria, y 2) personas que terminaron la escuela secundaria pero no obtuvieron grados educativos mayores. Borjas encontró que en el grupo con educación menor a la secundaria, los salarios se desplomaron justo en 1980, el año en el que todos los cubanos poco calificados llegaron. Eso ocurrió en Miami en un grado mucho mayor en comparación en otras ciudades. El estudio estimó que el Éxodo del Mariel redujo los salarios de los trabajadores estadounidenses con educación menor a la secundaria entre 10 y 30 por ciento. Parecía un jaque mate.
Pero fue este acto de dividir la data que generó el resultado espurio. Esto creó muestras de datos que, exactamente en 1980, incluyó repentinamente muchos más hombres de raza negra con salarios más bajos--lo que explicó la disminución salarial total de esas muestras en relación con otras ciudades. Comprender cómo sucedió requiere entender los datos sin procesar.
Los documentos de Card y Borjas usan datos del Current Population Survey o CPS, una encuesta representativa de la muestra de trabajadores estadounidenses. Esta encuesta se lleva a cabo cada mes; es donde se obtienen los estimados de la tasa de desempleo en EE.UU. Dos conjuntos de datos extraídos de la CPS también reportan los salarios de los trabajadores. Estos dos conjuntos de datos se denominan "Suplemento de marzo" y "Outgoing Rotation Group" (ORG). Estas no son encuestas para todos los trabajadores, sino para un pequeño número de trabajadores elegidos al azar dentro de subconjuntos de la población, de manera que sus respuestas a las preguntas sobre salarios sean representativas de los salarios de otros como ellos.
Justo en 1980, la Oficina del Censo--la cual llevó a cabo las encuestas de la CPS--mejoró sus métodos de encuesta para cubrir a una mayor cantidad de hombres de raza negra poco calificados. El censo de 1970 y, nuevamente, el censo de 1980, subestimaron en gran medida la cantidad hombres de raza negra poco calificados, por no identificar sus residencias y por no sondear suficientemente a los encuestados acerca de los miembros marginales o itinerantes del hogar. Hubo una presión legislativa y judicial masiva para contar de mejor manera a las personas de raza negra, particularmente en Miami. A partir de la CPS de 1981, la cobertura de la encuesta de hombres de raza negra poco calificados cambió drásticamente para incluir a relativamente más hombres de raza negra con educación menor a la secundaria, y relativamente menos hombres de raza negra que completaron la escuela secundaria.
Usted puede ver el cambio brusco de la muestra en el gráfico de abajo. En todos los gráficos, la CPS de 1981 se muestra por encima de la del año 1980 (como en el trabajo de Borjas) porque los salarios reportados se obtuvieron en su mayoría a finales de 1980.
A la izquierda se encuentra la fracción de trabajadores de raza negra en las muestras exactas de CPS de marzo utilizadas en el trabajo de Borjas: hombres, trabajadores no hispanos de 25 a 59 años de edad, con educación menor a la secundaria. A la derecha está la misma fracción en el mismo conjunto de datos, usando la definición más amplia de poca calificación utilizada en el trabajo de Card: escuela secundaria o menos. La línea negra muestra a los trabajadores en Miami.
The referenced media source is missing and needs to be re-embedded.
A la izquierda, ese es un enorme salto en la composición de la muestra de Miami en 1980. La fracción de personas de raza negra en la muestra del trabajo de Borjas va de apenas un tercio de la muestra a dos tercios, exactamente cuando ocurre el Éxodo. Los nuevos trabajadores que están siendo encuestados no son los propios cubanos: recuerde que estos son los trabajadores no hispanos. Y en los años siguientes la fracción de personas de raza negra se eleva aún más, alcanzando el 91% (!) en 1985. Eso no sucede en la categoría de educación más amplia utilizada en el trabajo de Card, a la derecha.
Esos gráficos muestran las mismas tendencias en las ciudades de "control". Recuerde que ambos investigadores prueban los efectos de la llegada del Mariel comparando los salarios en Miami con los salarios en otras ciudades comparables que no recibieron un influjo de inmigrantes. Los dos investigadores eligen estas ciudades de maneras ligeramente diferentes, ambas procurando encontrar ciudades con tendencias de empleo similares a la tendencia de Miami al mismo tiempo. Card utiliza Atlanta, Los Ángeles, Houston y Tampa-St. Petersburgo; Borjas utiliza Anaheim, Rochester, Nassau-Suffolk y San José.
Pero la fracción de personas de raza negra no aumenta en las muestras de ningún grupo de ciudades de "control". De hecho, la fracción de personas de raza negra en las ciudades de control en las que el trabajo de Borjas se centra cae después de 1980, llegando a cero en 1983. En algunos puntos el estudio de Borjas compara una ciudad cuyo conjunto de datos de la encuesta está cambiando drásticamente para cubrir más hombres de raza negra y de salarios más bajos donde la CPS no entrevistó a un solo hombre de raza negra en este nivel de habilidad.
El hallazgo espurio
Este cambio en la cobertura de la muestra de personas de raza negra es lo que genera la caída en los salarios. Entre los hombres de Miami con educación menor a la secundaria en este momento, los salarios son mucho más bajos entre las personas de raza negra que los trabajadores que no son de raza negra. Por lo tanto, incluir a más personas de raza negra en la muestra haría que el salario promedio de la muestra caiga, incluso si no sucediera nada con los salarios de cualquier trabajador de la población de Miami donde se tomó la muestra. Considere el cambio en la composición de gente de raza negra de la muestra, multiplíquelo por la brecha salarial de personas de raza negra vs no negra y obtendrías la caída de los salarios que aparecería en la muestra utilizada en el estudio de Borjas.
Por ejemplo, la fracción de gente negra en la muestra de la encuesta aumentó entre 1979 y 1985 en 51 puntos porcentuales más en Miami que en las muestras de las principales ciudades de control consideradas en el estudio de Borjas. Multiplique eso por la brecha relativa de salarios de 49% entre personas de raza negra y no negra entre los trabajadores muy poco calificados en este tiempo y lugar, y en 1985 se obtiene un salario 25% más bajo solo por incluir a trabajadores de raza negra de salarios bajos en la encuesta. El gráfico de la izquierda de abajo hace esto para todos los años después de 1980:
The referenced media source is missing and needs to be re-embedded.
El eje vertical es aproximadamente comparable a un cambio porcentual en el salario, donde -0.1 es un descenso de 10% y -0.2 es un descenso de 20% (es el cambio en los puntos logarítmicos). Observando ese gráfico, se puede ver que la inclusión de más trabajadores de raza negra con salarios bajos en la muestra haría que el salario promedio caiga drásticamente, una disminución que llega a unos 25% unos años después de 1980.
El efecto del Éxodo del Mariel medido por Borjas es "entre 10 y 30 por ciento". En otras palabras, la caída espuria de los salarios explica todo el efecto estimado en el estudio de Borjas.
A la derecha, en la figura anterior, se encuentra el decrecimiento salarial espurio que obtendría si estudiasen los salarios en la categoría de educación más amplia de educación secundaria o menor de Card. Usted vio arriba que hubo un cambio mucho más pequeño en el número de personas de raza negra encuestadas en ese grupo más amplio. También existe una brecha menor entre los salarios de trabajadores de raza negra y no negra en ese grupo. Por lo tanto, la caída del salario estimada después del Éxodo del Mariel sería insignificante utilizando la agrupación de trabajadores en trabajo de Card: sólo 2 o 3% durante un par de años, no lo suficiente como para aparecer del ruido estadístico. Por lo tanto, el estudio de Card no se vio afectado por el sesgo en el cambio en la muestra. Esto puede explicar por qué los estudios de Card y Borjas llegaron a conclusiones tan diferentes.
Lo que discuto aquí es sólo una de varias maneras en las que este cambio en la composición de la muestra de la encuesta puede explicar las discrepancias entre los estudios referidos al Éxodo del Mariel. Uno de ellos es un estudio de Giovanni Peri y Vasil Yasenov de U.C. Davis que mostró que los resultados en el estudio de Borjas son sensibles a qué conjunto de datos se utiliza. He mencionado anteriormente que la CPS tiene dos encuestas salariales cada año. Los gráficos anteriores corresponden al CPS de marzo que utilizó Card en su investigación, y en el cual Borjas se centra. Peri y Yasenov mostraron que el resultado es de mucho menor magnitud en la otra encuesta salarial (la encuesta 'ORG'), un resultado que se discute en versiones revisadas del estudio de Borjas. Específicamente, la estimación del efecto salarial en el estudio de Borjas es tres veces mayor en los datos de la encuesta de marzo de CPS que en los datos ORG. No hay una razón clara por la que el verdadero efecto de un influjo inmigratorio cambiaría tanto entre dos encuestas diferentes. Pero nuestro trabajo tiene una explicación sencilla y definitiva para este resultado: el aumento posterior a 1980 de la cobertura de trabajadores de raza negra de salarios bajos es tres veces mayor en la CPS de marzo que en los datos de ORG. La explicación tiene sentido de esta manera y en varios otros puntos que discutimos en nuestro artículo.
El origen de este problema es la forma en que los datos de la encuesta se dividen en el estudio de Borjas. Cuando la Oficina del Censo escoge a los encuestados que representarán a la población, sólo los elegirá para representar a categorías amplias de personas. Si los investigadores dividen los datos de manera demasiado fina, la Oficina del Censo no puede prometer que esas divisiones representarán a la población. Por ejemplo, si los datos se dividen para incluir a sólo cirujanas peruanas-estadounidenses de 53 años de edad, podrías encontrar que muy pocas (o ninguna) de esas personas fueron incluidas en la muestra de la encuesta. Pero un grupo tan pequeño (o vacío) no necesariamente representaría a todas las personas de esa descripción en una ciudad determinada.
Un ejemplo menos extremo es lo que sucedió en los datos de marzo de CPS en Miami: bajo la presión para mejorar la cobertura de hombres de raza negra poco calificados, sus esfuerzos condujeron a un cambio dentro de su muestra de hombres de raza negra con educación secundaria o menor. Dentro de ese grupo, justo después del Éxodo del Mariel, comenzaron a cubrir a muchos más hombres de raza negra con educación menor a la secundaria, y relativamente menos que habrían terminado la escuela secundaria. Eso no cambiaría la representatividad racial del grupo más amplio de educación secundaria o menos. Al dividir demasiado el grupo, el estudio de Borjas creó un subgrupo en el que la representatividad de la población cambió bruscamente, precisamente en el momento en que se atribuiría erróneamente un descenso salarial a partir del Éxodo del Mariel.
Mayor conocimiento, menos discusiones acaloradas
La evidencia a partir del Éxodo del Mariel se mantiene tal como se mostró en la investigación seminal de David Card: no hay evidencia sobre la caída de los salarios, o del aumento del desempleo entre los trabajadores menos calificados en Miami, incluso después de un influjo de refugiados que aumentó el tamaño de esa fuerza de trabajo en 20%.
Esto no implica de modo alguno que los grandes influjos de inmigración poco calificada no podrían desplazar a los trabajadores locales, especialmente en el corto plazo. Pero los pronunciamientos en las declaraciones recientes de políticos, argumentando que los inmigrantes necesariamente generan efectos negativos sobre los trabajadores locales, deben evaluarse frente a experiencias del mundo real rigurosamente estudiadas. El Éxodo del Mariel sigue siendo una de las experiencias más esclarecedoras de este tipo.
CGD's publications reflect the views of the authors, drawing on prior research and experience in their areas of expertise. CGD is a nonpartisan, independent organization and does not take institutional positions. You may use and disseminate CGD's publications under these conditions.