Recommended
Blog Post
Update on Lives Lost from USAID Cuts
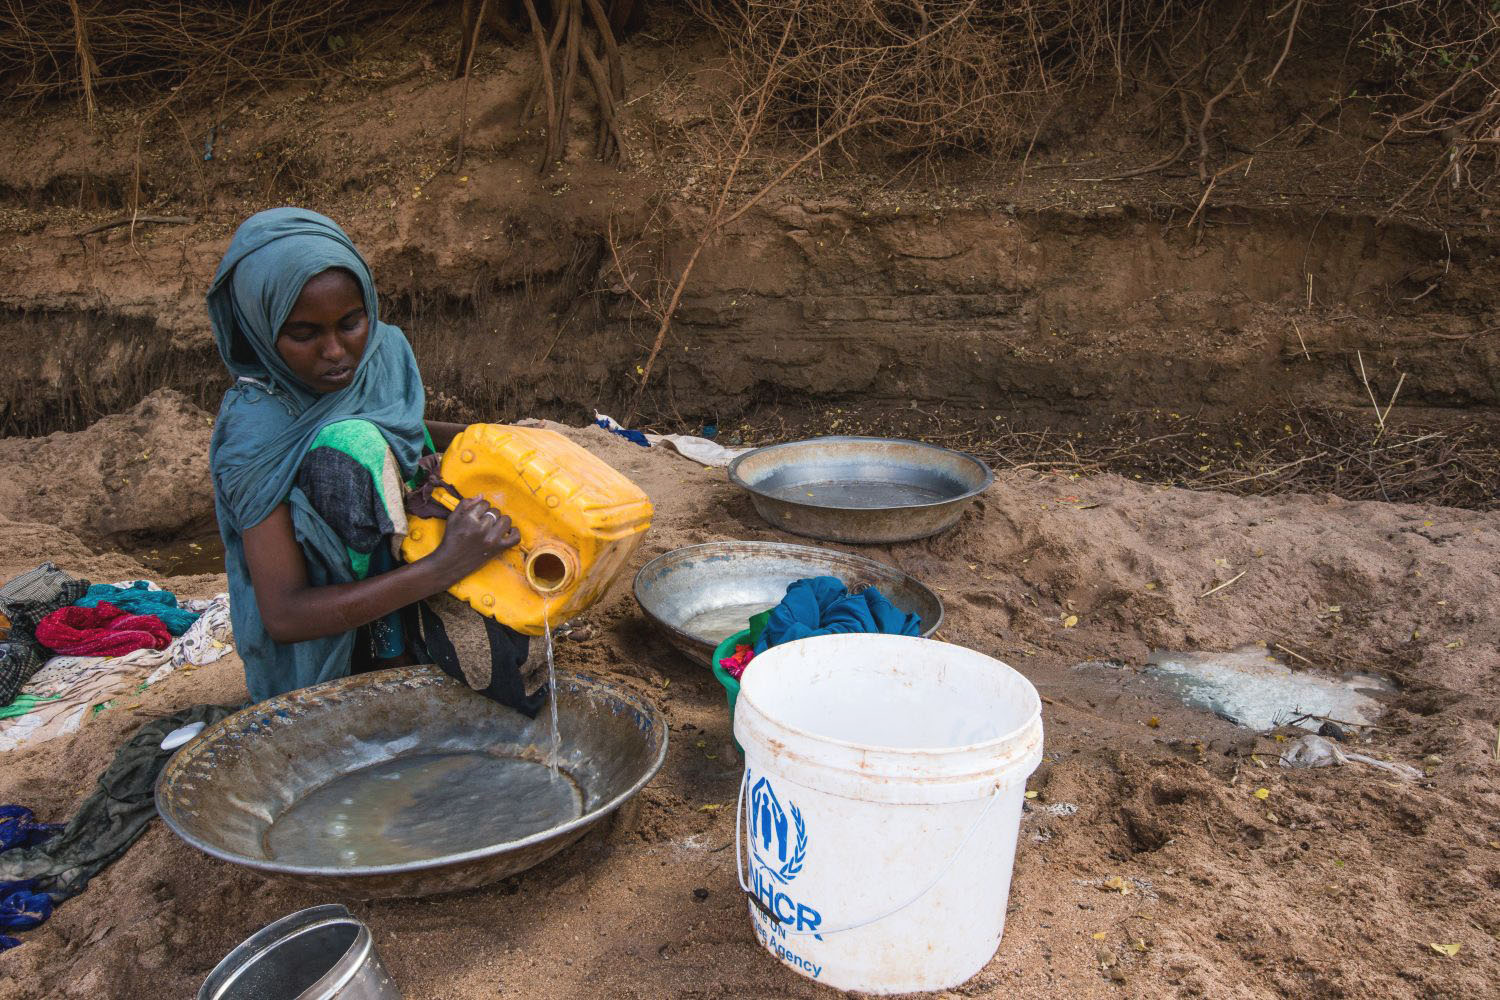
The cuts in US foreign aid have probably caused hundreds of thousands of people to die. My colleagues Justin Sandefur and Charles Kenny estimated between 500,000 and 1,000,000 in 2025 alone. But so far these estimates have been projections based on logic and historical patterns. Real-time data on what is actually going on has been scarce.
A new working paper by three Australian economists (Annabelle Tan, Ashani Amarasinghe, and David Ubilava) is the first I've seen to show systematic harms at scale using actual empirical data on what is happening on the ground. They use the Armed Conflict Location & Event Database (ACLED), which compiles data globally from news reports on political violence.
Tan et al. compare trends in armed conflict in heavily aid-dependent countries in Africa with similar trends for less aid-dependent countries. Before the cuts, these trends were similar. After January 2025 there is a clear break, with a roughly 5 percent increase in the number of conflict events for countries with higher exposure to USAID cuts. Their paper uses data through June 2025, but as ACLED data is near real-time, there are another six months of data available online. Adding in this data shows a remarkably consistent pattern.
Aid cuts caused a 5 percent increase in armed conflicts in Africa in 2025

Note: This figure is a replication and extension of analysis by Annabelle Tan, Ashani Amarasinghe, and David Ubilava in their paper “Aid, Interrupted: Conflict Dynamics Following the USAID Suspension in Africa.” Following their paper, the outcome is the inverse hyperbolic sine of conflict events per million people, with country and month fixed effects and standard errors clustered at the country level.
Their paper also focuses on country-level analysis. That means it’s based on a relatively limited sample of around 50 countries in Africa. That's a lot of weight on a small number of units. An alternative approach is to use the geocoded sub-national aid data (GODAD) to allow for more fine-grained analysis. By comparing more or less aid-dependent regions within countries, we can adjust for any shocks that might have affected a whole country, such as elections, regime changes, or commodity price shocks. After merging the ACLED data with the GODAD data I’m left with over 700 regions across 49 countries—more than ten times as many units.
The results hold up almost exactly. In both the national and subnational analyses, the aid cuts cause a roughly 5 percent increase in armed conflict events. The ACLED data also reports the number of fatalities. It’s harder to estimate the effect on fatalities at the country-level, because fatalities have higher variance than event counts. But the subnational data gives us additional statistical power. The effects are similar—a roughly 5 percent increase in fatalities due to armed conflict. That adds up to roughly 1,000 deaths over 2025.
Sub-national analysis shows a similar pattern: a 5 percent increase in armed conflicts in Africa in 2025

Note: This figure is a replication and extension of analysis by Annabelle Tan, Ashani Amarasinghe, and David Ubilava in their paper “Aid, Interrupted: Conflict Dynamics Following the USAID Suspension in Africa.” Following their paper, the outcome is the inverse hyperbolic sine of conflict events per million people. I show two specifications, a standard two-way fixed effects (TWFE) model, and as a robustness check a model with country×month fixed effects which absorbs all country-level time-varying shocks—anything common to regions within the same country in a given month—and restricts identification to within-country variation only. Standard errors clustered at the country level.
Aid cuts caused a 5 percent increase in fatalities from armed conflict

Note: This figure is a replication and extension of analysis by Annabelle Tan, Ashani Amarasinghe, and David Ubilava in their paper “Aid, Interrupted: Conflict Dynamics Following the USAID Suspension in Africa.” The outcome is the inverse hyperbolic sine of conflict fatalities. Standard errors clustered at the country level.
Why would aid cuts cause conflict?
Tan, Amarasinghe, and Ubilava outline two key mechanisms. First, the balance of power between the state and armed groups was disrupted. With fewer resources expected in the future, the incentives for armed groups shifted to short-term theft and violence. Second, the hit to local economies means a lower opportunity cost for unemployed young men to engage in violence. Both of these are well-established mechanisms in a variety of contexts. There are also the cancelled projects explicitly focused on peace-building and conflict-resolution.
Now, if you’re an economist you might be asking “what about the Nunn & Qian (2014) AER paper that found that more US food aid increased conflict” (the opposite result)? Well, Paul Christian and Christopher B. Barrett in 2017 argued in a replication that the result was fragile, driven by specific instrument choices, and didn't survive reasonable alternative specifications. More generally, there is growing concern around the use of these “shift-share” instruments. In this case, whilst the timing of US wheat production might be an exogenous predictor of US food aid, the prior country-level exposure to aid might not be. The new paper by Tan, Amarasinghe, and Ubilava has a much simpler research design, with testable and flat prior trends, which wasn’t possible in the same way with the Nunn-Qian paper. The aid-conflict question deserves healthy scepticism, but this is a much cleaner setting in which to answer it.
What this all means
In the short term, these impacts on conflict are almost certainly dwarfed by direct impacts on health from reductions in healthcare provision. But, they are based on real data. Increases in conflict also raise major longer-term risks. Conflict is development in reverse, and civil wars can drag on for decades, impeding all other efforts at progress. Close to half of the world’s extreme poor now live in fragile and conflict-affected states. To make further reductions in poverty we need to tackle conflict head on.
Thanks to Tan, Amarasinghe, and Ubilava for making their methodology clear enough to quickly replicate and extend, and to Charles Kenny and Justin Sandefur for helpful comments on this blog. Conflict data from ACLED. Aid data from GODAD. Replication code is available on GitHub. Any errors are my own.
Topics
DISCLAIMER & PERMISSIONS
CGD's publications reflect the views of the authors, drawing on prior research and experience in their areas of expertise. CGD is a nonpartisan, independent organization and does not take institutional positions. You may use and disseminate CGD's publications under these conditions.