Recommended
WORKING PAPER
Can Tax Buoyancy in SSA Help Finance the SDGs?
The IMF estimates that on average, low-income countries (LIC) will need additional resources amounting to 15.4 percent of GDP to finance the Sustainable Development Goals (SDGs) in education, health, roads, electricity, and water by 2030. These resource requirements are even greater in sub-Saharan Africa than in a typical LIC: the median sub-Saharan African country faces additional spending of about 19 percent of GDP. In the average LIC, the IMF estimates that of the required additional financing, 5 percentage points of GDP would have to come from domestic taxes.
Is it realistic to think that sub-Saharan African countries could grow their tax revenues by at least 5 percent of GDP with economic growth by 2030? In this blog post, we use the most up-to-date tax data to argue that countries in the region would drastically fall short of this goal unless they make important changes. Going forward, sub-Saharan African countries will need to pay much more attention to reforming their tax systems and adapting them to the changing structure of their economies. Our analysis suggests that tax reforms since 1999 have helped taxes to become more responsive to income changes, but increased efforts are needed to widen the tax net and improve tax compliance to generate additional tax revenues.
A quick look at the region’s record in raising tax revenues
One way to gauge sub-Saharan Africa’s potential to raise more taxes is to look to the past. On average, tax revenues in the region have grown by over 2 percent of GDP between 2000 and 2017. However, country performance varies: in more than half of countries, the 2017 tax-to-GDP ratio was less than the average of 16 percent. Many countries in this group are defined as fragile, with a UN or regional peacekeeping or peacebuilding mission during the last three years, or where the World Bank’s Country Policy and Institutional Assessment (CPIA) rating is 3.2 or less. (The CPIA measures a country’s effort to improve its institutions and policies to reduce poverty; country performance is rated on a scale of 1 to 6, with 1 being weak and 6 being strong.) These countries have weak fiscal institutions and are expected to take a long time to exit fragility.
Tax buoyancy
It is common for public finance experts to refer to the “buoyancy” of a tax system. Tax buoyancy captures the response of tax revenues to changes in national income, including the impact of tax changes that governments implement from time to time. A tax buoyancy of one implies that a 1 percent increase in GDP would increase tax revenues by 1 percent, thus leaving the tax-to-GDP ratio unchanged. A buoyancy greater than one is desirable if a country would like to raise revenues to strengthen fiscal stability and generate resources to support economic development over time. Ideally, one would like to see a tax buoyancy of more than one for sub-Saharan Africa.
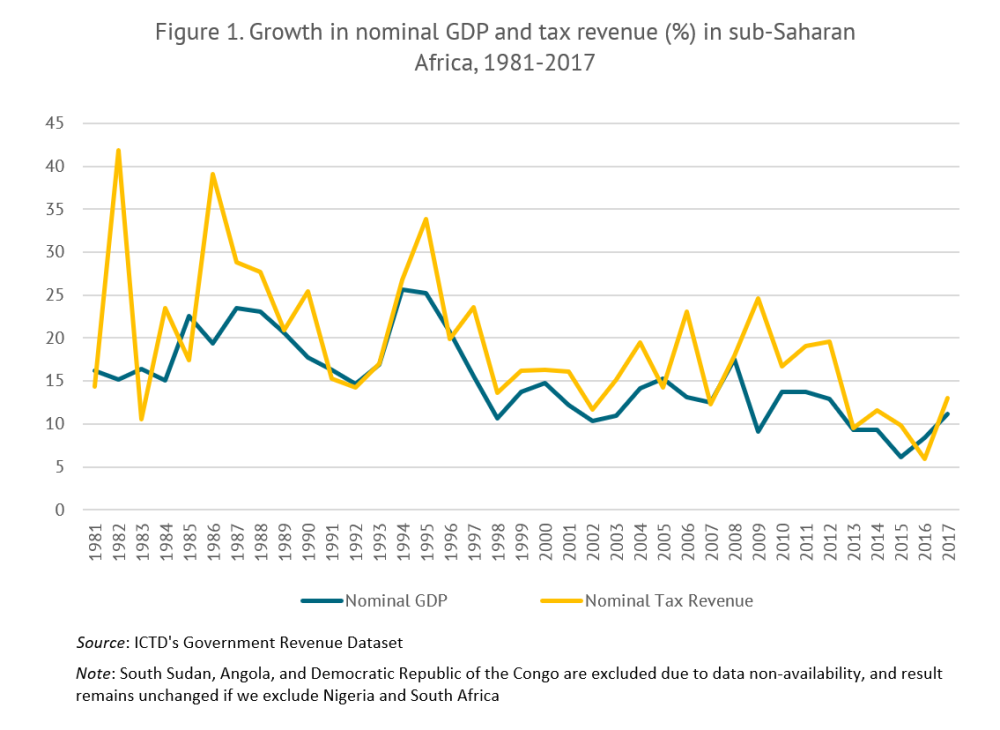
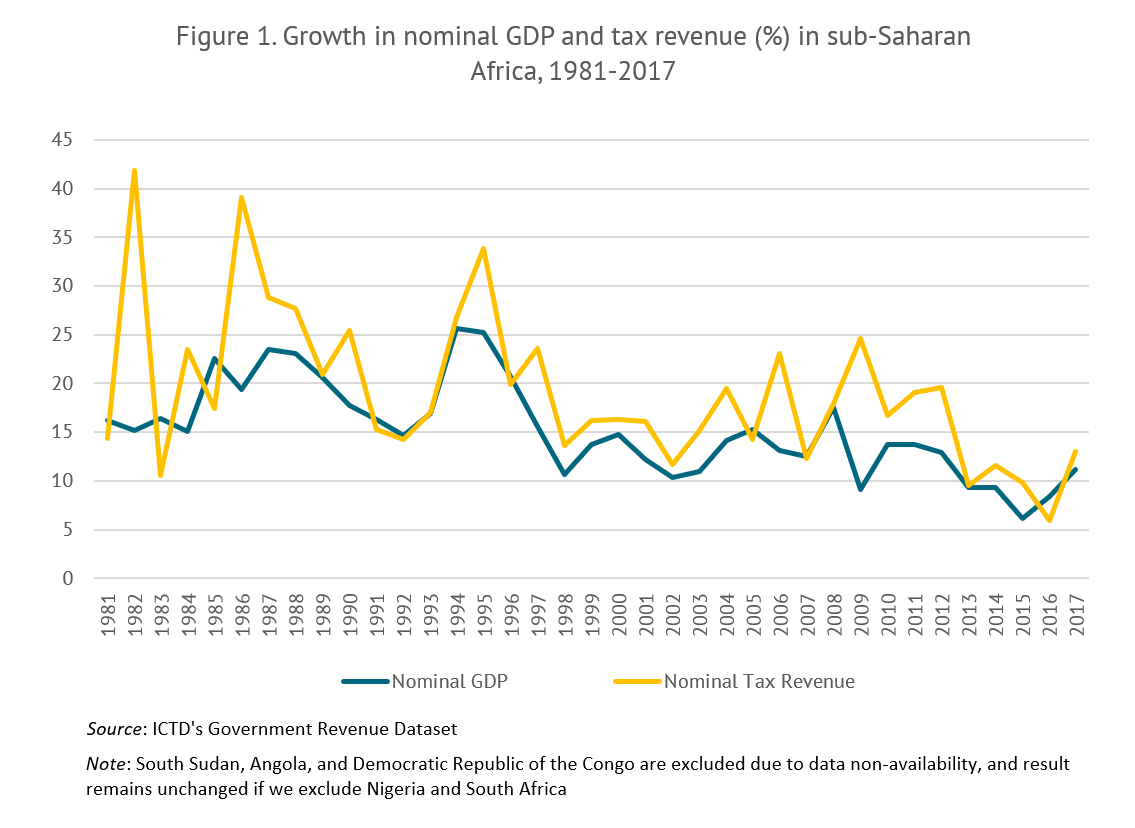
To understand how growth in tax revenues responded to growth in nominal GDP in the region, we consolidated nominal GDP and tax revenues of all countries during 1980 and 2017. The resulting series are plotted in Figure 1, which shows that nominal revenues seem to have grown faster than nominal GDP. This suggests that on average, tax buoyancy has been greater than one for most years from 1981 to 2017. This is consistent with increases in tax-to-GDP ratios from 2000 to 2017.
Tax buoyancy estimates
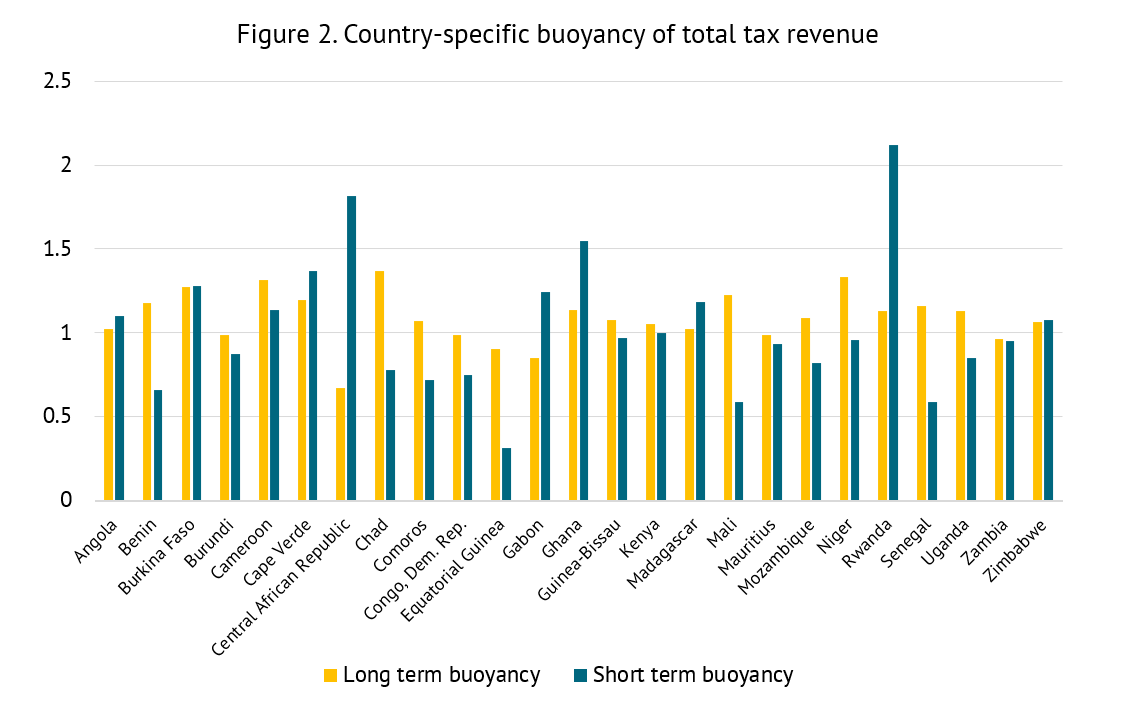
By using different techniques, we estimated both long-term and short-term buoyancies for total tax revenue (figure 2) (The details are available in a recent Center for Global Development paper). We found that long-term buoyancy exceeds one by a small margin. It is significantly smaller than one in three countries: Central African Republic, Equatorial Guinea, and Zambia. In seven countries (Burundi, Comoros, Democratic Republic of Congo, Gabon, Guinea-Bissau, Madagascar, Mauritius) the coefficient is not different from one, which means for these 10 countries, tax revenues are not growing faster than GDP growth.
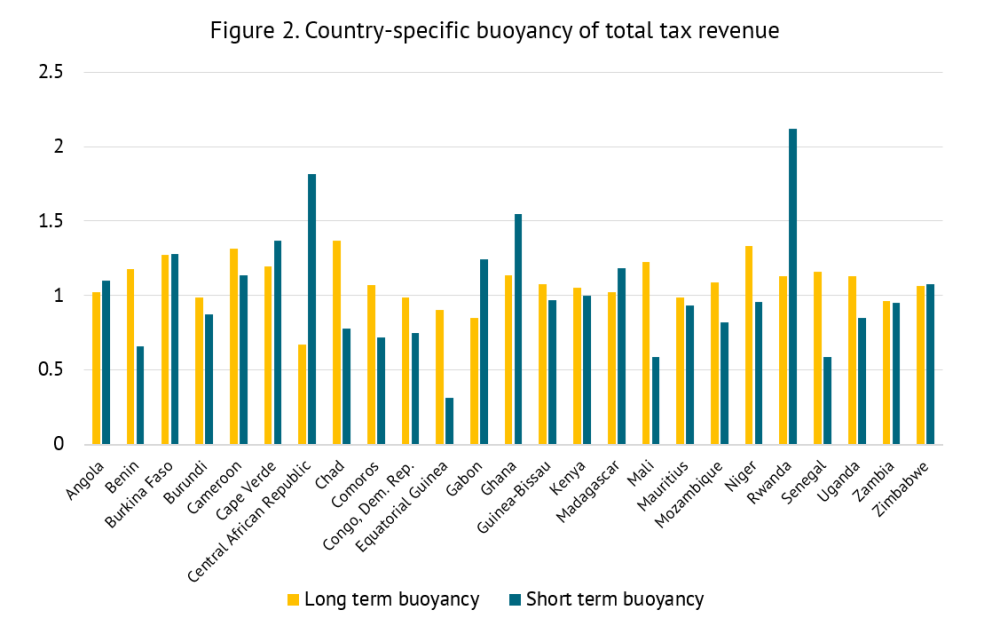
Short-term buoyancy reflects the extent to which income taxes and welfare spending in a country adjust to variations in real GDP. When the latter declines, spending on unemployment benefits rises and households pay less taxes because of the income fall. There is greater variation in short-term buoyancy than long-term buoyancy. Short-term buoyancy ranges from 0.314 in Equatorial Guinea to 2.118 in Rwanda.
With regard to different types of taxes, we find that long-term buoyancies for personal income tax, corporate income tax, and taxes on goods and services (such as the value-added tax) are higher than one for sub-Saharan Africa as a region, which suggests that these levies grow with income (that is, they are progressive). This is not the case for trade taxes. Estimates of corporate income tax buoyancy are in the same range as in the OECD countries.
Additional spending on SDGs and projected increases in tax-to-GDP ratio
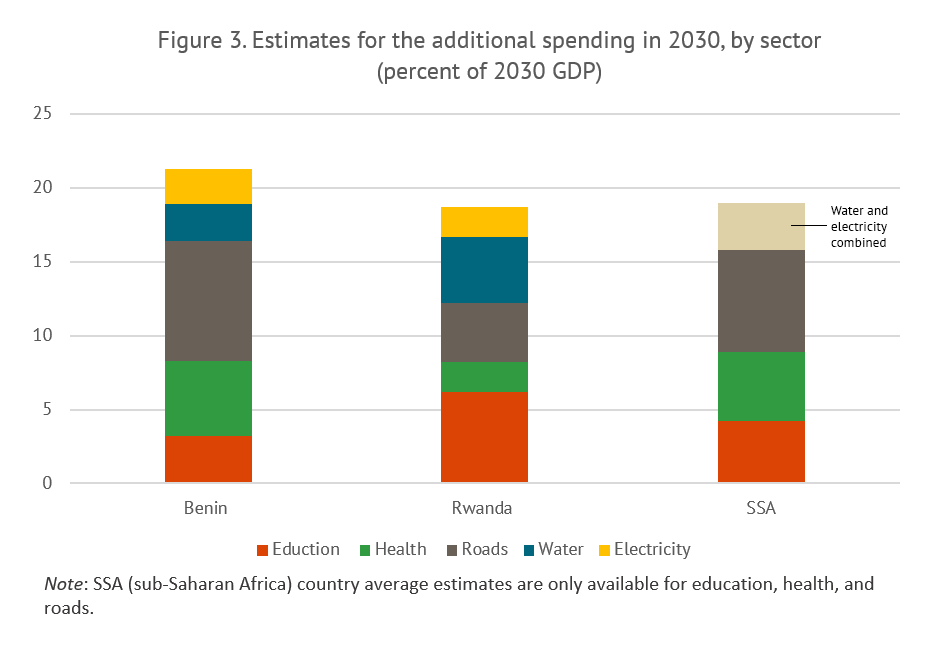
According to the IMF, Benin would need to spend an additional 3.2 percent of its GDP on education, 5.1 percent of GDP on health, and 2.5 percent of GDP on water to achieve the SDGs by 2030 (Figure 3). For Rwanda, required spending to meet the SDGs is the largest in education, estimated at 6.2 percent of GDP. Additional required spending is estimated at about 4 percent of GDP on roads, 2 percent of GDP on health, 2 percent of GDP on electricity, and 4.5 percent of GDP on water (Figure 3). Rwanda’s additional spending needs of 18.7 percent of GDP are close to the region’s median, while that for Benin, at 21.3 percent of GDP, are larger.

Table 1. Projected increases in tax-to-GDP ratio by 2030 in sub-Saharan Africa, Benin and Rwanda
| Tax-to-GDP ratio in 2016 (in percent) | Estimated tax buoyancy | Projected tax-to-GDP ratio in 2030 (in percent) | Increase in tax-to-GDP ratio | |
|---|---|---|---|---|
| Sub-Saharan Africa | 15.8 | 1.08 | 16.6 | 0.8 |
| Benin | 9.2 | 1.18 | 10.6 | 1.4 |
| Rwanda | 15.5 | 1.13 | 18.7 | 3.2 |
Given the tax-to-GDP ratio for 2016, the projected GDP growth, and our estimates of long-term buoyancy, we can calculate tax revenue growth for sub-Saharan Africa, Benin, and Rwanda during 2016 and 2030 (Table 1). The tax-to-GDP ratio in Benin would grow to 10.6 percent (an increase of 1.4 percent) and in Rwanda to 18.7 percent (an increase of 3.2 percent). The tax-to-GDP ratio for the region would grow modestly by 0.8 percent.
The bottom line? In all cases, incremental taxes generated by 2030 would fall short of the average 5 percent of GDP additional revenues needed by LICs to finance the SDGs, and the shortfall would be large for two countries (Rwanda and Benin) for which detailed resource estimates exist. This suggests that it is imperative that countries in sub-Saharan Africa continue to implement tax reforms to make their systems more responsive to income changes. At the same time, policymakers in Africa must complement tax-enhancing efforts with those directed at improving the quality of spending. It is possible generate up to 3 percent of GDP in resources by focusing on improving the efficiency of existing budget allocations.
Topics
DISCLAIMER & PERMISSIONS
CGD's publications reflect the views of the authors, drawing on prior research and experience in their areas of expertise. CGD is a nonpartisan, independent organization and does not take institutional positions. You may use and disseminate CGD's publications under these conditions.


