Recommended
REPORTS
Effective procurement of health products—medicines, diagnostics, and devices—is a foundational function for any health system and essential for progress toward the health-related Sustainable Development Goals. But a CGD Working Group found that national and international procurement systems are often failing to deliver access to essential medicines at affordable prices—and will need to further adapt as countries transition from donor aid, disease burdens shift, and health systems evolve.
Global health procurement is an admittedly technical subject. You can read the full (lengthy) Working Group report here, with lots more detail. But with just four graphs, highlighted below, you can get a crash course in how the world buys health products—and where things go wrong.
1. Purchasers in low- and middle-income countries often face high—and highly—variable prices.
We found that some countries pay as much as 20 to 30 times a minimum international reference price for basic generic medicines, such as the heartburn treatment drug omeprazole or the common pain reliever paracetamol. And in the Republic of the Congo, a World Bank analysis found that drug prices were four times higher than international reference prices, essentially doubling the cost of the proposed health benefits package.
Comparison of Public and Private Pharmaceutical Prices ($)
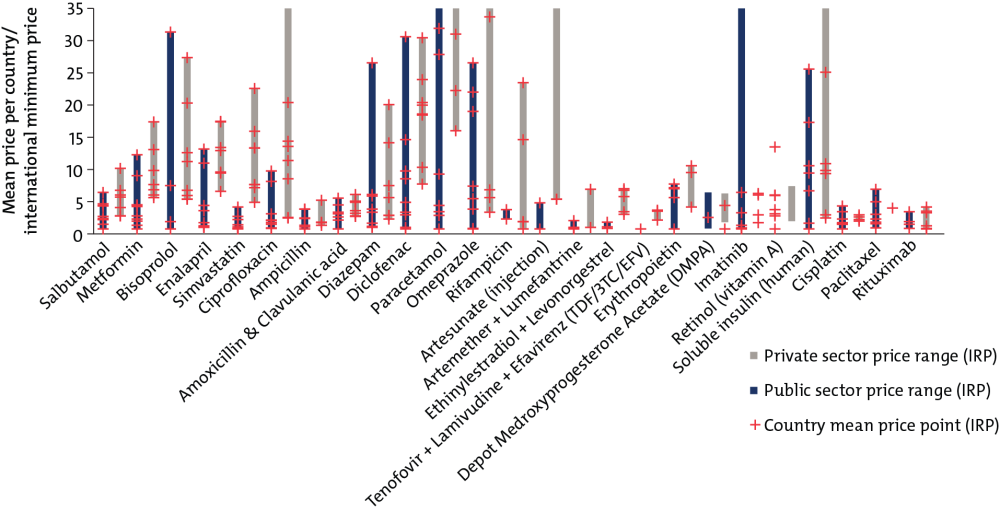
For source and notes see full report. Data copyright IQVIA AG and its affiliates. All rights reserved. 2017.
2. Low- and middle-income countries disproportionately purchase expensive branded generic drugs rather than cheaper unbranded generics.
In higher-income countries, patients tend to trust that generic medicines, priced lower than their branded competitors, are safe and effective. In the United States and United Kingdom, for example, unbranded generics account for more than 80 percent of pharmaceutical prescriptions by volume and about 30 percent by value. But in some low- and middle-income countries, weaker and under-resourced regulatory and quality control systems can lead patients and healthcare workers to opt for more expensive branded medicines that they hope will signal quality; these off-patent, branded drugs make up two-thirds of the market by volume and value. Unbranded generics, usually the least expensive option, are a tiny sliver, only 5 percent of the market by volume and 3 percent by value.
Health Product Markets in Low- and Middle-Income Countries by Brand and Licensing Status
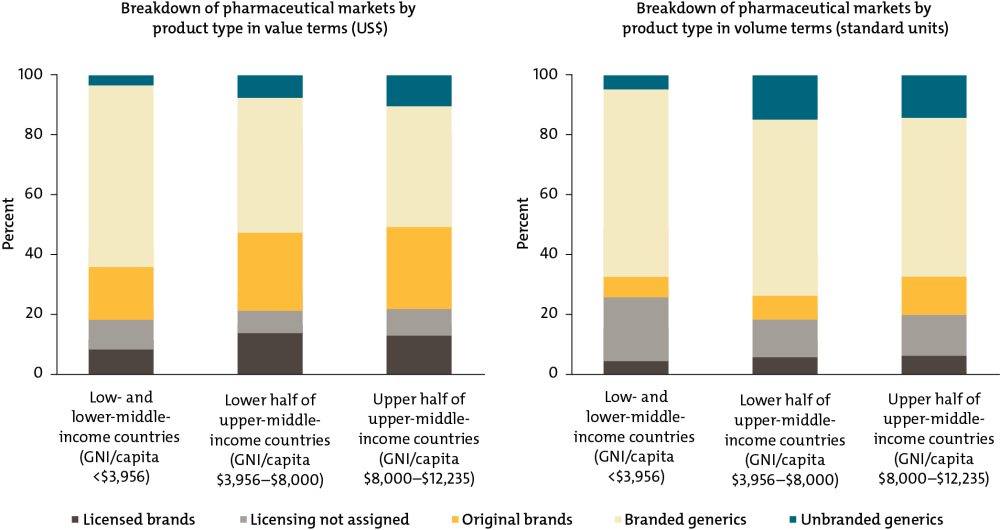
For source and notes see full report. Data copyright IQVIA AG and its affiliates. All rights reserved. 2017.
3. As countries become wealthier, donor financing for health products becomes less important.
Donors account for half of all expenditure on health products in low-income countries, but for 4 percent in lower-middle income countries. Instead, 80 percent of health products in lower-middle-income countries are procured through the private sector, where most individuals pay out-of-pocket for medicines. This “missing middle” problem (also discussed in IHME’s analysis of global health financing trends) could undermine progress toward universal health coverage.
Private, Government, and Donor/NGO Financing as a Share of the Total Estimated Market (Value) for Healthcare Products by Country Income Groups
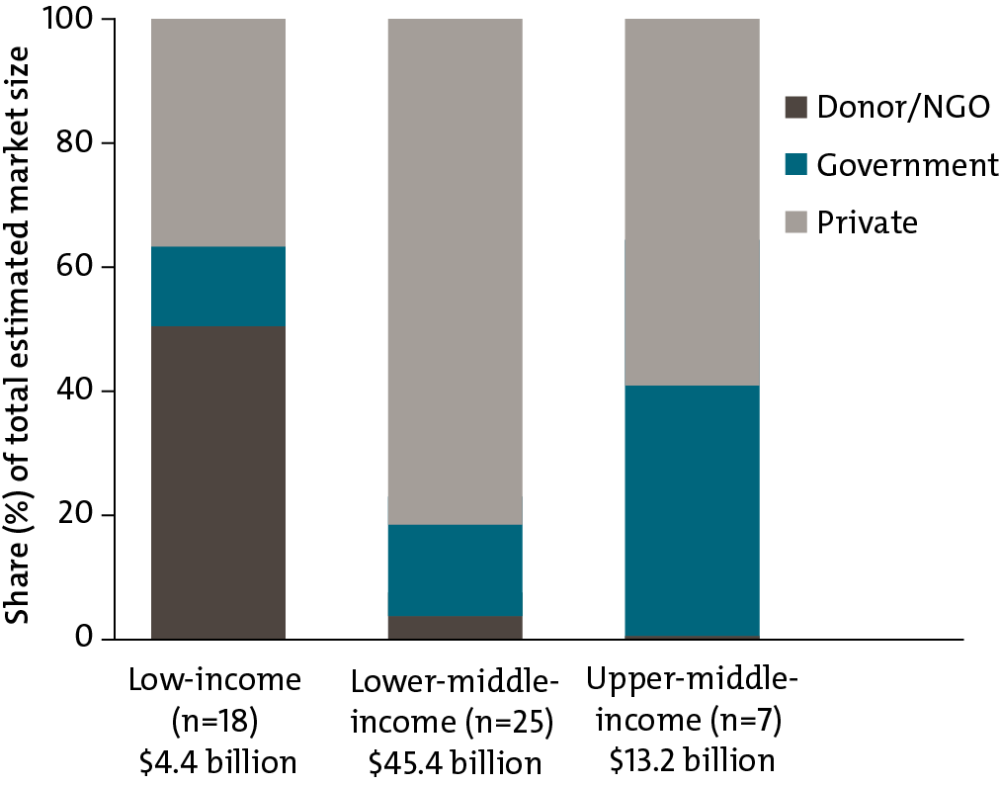
For source and notes see full report. Data copyright IQVIA AG and its affiliates. All rights reserved. 2017.
4. Markets in low- and middle-income countries have very little competition in the supply of essential medicines.
When a small number of suppliers dominates the market, public procurers and consumers usually pay more because firms can charge higher prices without losing market share to competitors. In some low- and middle-income countries, the largest seller can account for upwards of 85 percent of all sales for certain therapy classes, such as contraceptives in Kerala, Philippines, Senegal, and Zambia; cancer medicines in Zambia and Kerala; and antiparasitics in South Africa, Tunisia, Philippines, and Zambia.
One-Firm Concentration Index by Therapy Area for Selected Countries/States (Sample of 40 Molecules Only)
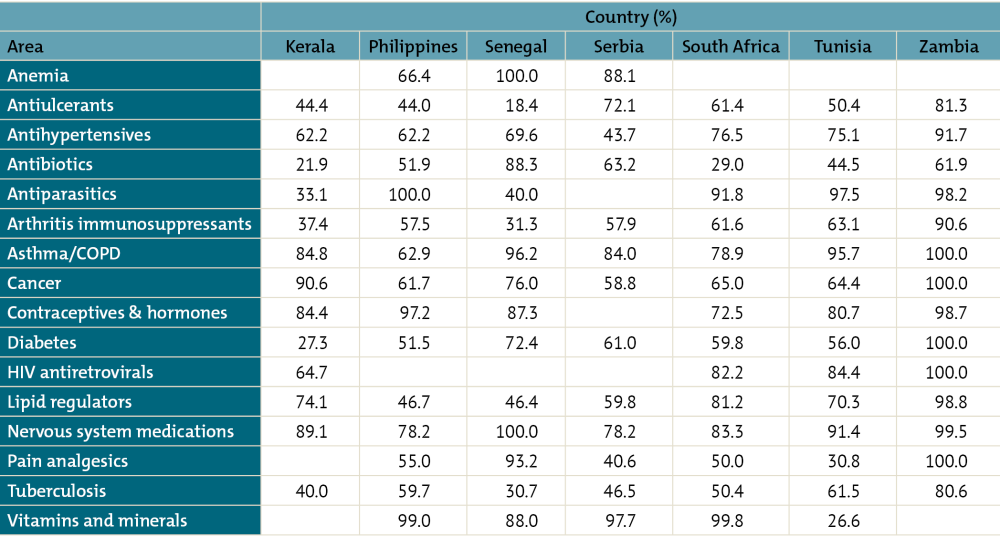
For source and notes see full report. Data copyright IQVIA AG and its affiliates. All rights reserved. 2017.
Together, these figures demonstrate an unfinished agenda in getting health products to those who need them most. By elevating and optimizing procurement as an essential health system function, we can begin to address these challenges—helping countries to stretch scarce resources further, improving health, and realizing universal health coverage. You can read more about the Working Group’s recommendations for smarter procurement policy and practice here.
To read the final report of CGD’s Working Group on the Future of Global Health Procurement, visit cgdev.org/better-health-procurement.
Disclaimer
CGD blog posts reflect the views of the authors, drawing on prior research and experience in their areas of expertise. CGD is a nonpartisan, independent organization and does not take institutional positions.