Recommended
Last year at this time, the World Bank announced its intention to provide $104 billion in financing to developing country governments to help them respond to the COVID-19 crisis. We took stock of those efforts seven months ago in a Center for Global Development working paper and accompanying blog post. We noted that Bank lending had accelerated significantly in 2020 relative to 2019, but that actual disbursements were not on track to meet the Bank’s own COVID lending goals, that the absolute magnitudes were dwarfed by the depth of the crisis facing low- and lower-middle income countries, and that the Bank bureaucracy was failing to pivot to more flexible, rapid financing instruments at its disposal.
More than a year into the pandemic, it’s time to check in again on the Bank’s crisis financing. We revisit four basic questions about the Bank’s lending performance since it originally announced its COVID response.
1. Is the World Bank fulfilling its promises from early 2020?
It depends how you count. The Bank is on track to meet its goals in terms of new loans committed, but will only disburse about 60 percent of that money by its self-imposed deadline.
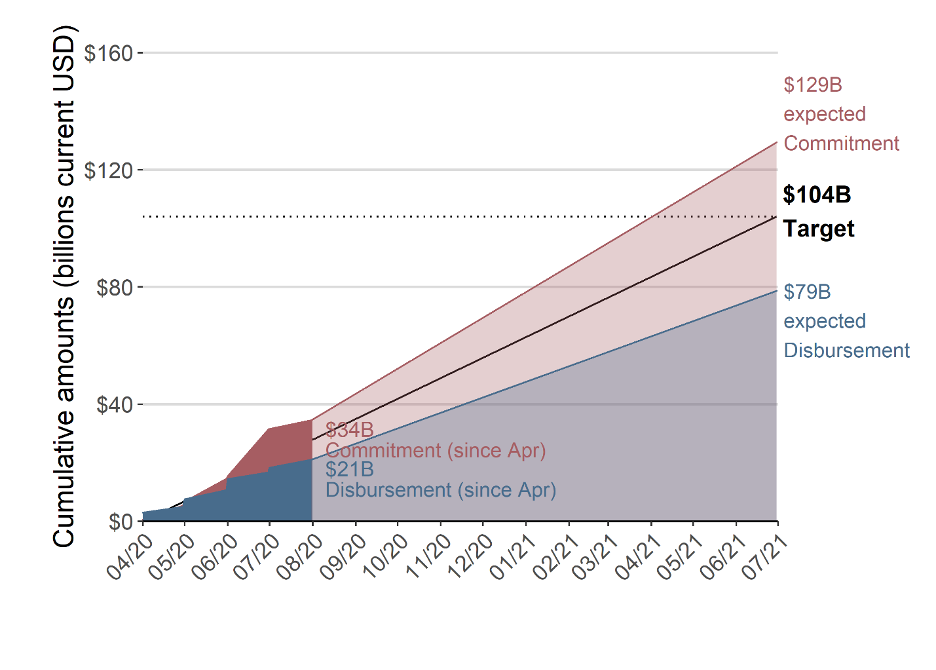
A snapshot of where things stand can be seen in Figure 1. Again, early last year the Bank announced that from Apr 1st, 2020 to February 1st, 2021 it would spend $104B on COVID relief. Thus far (as of the beginning of February 2021) it has committed 72 billion dollars and has dispersed 42 billion of these dollars. By simple linear extrapolation, this leads us to estimate that the Bank—combining both IBRD and IDA loans—will have committed $108 billion by its target date of the end of June 2021, but will have disbursed only $64 billion. Note we ignore the Bank’s spending on private companies through its investment arm, IFC, for which it has separate, additional COVID financing targets.
Figure 1. Total commitments and disbursements (Apr. 1, 2020–Feb. 1, 2021)
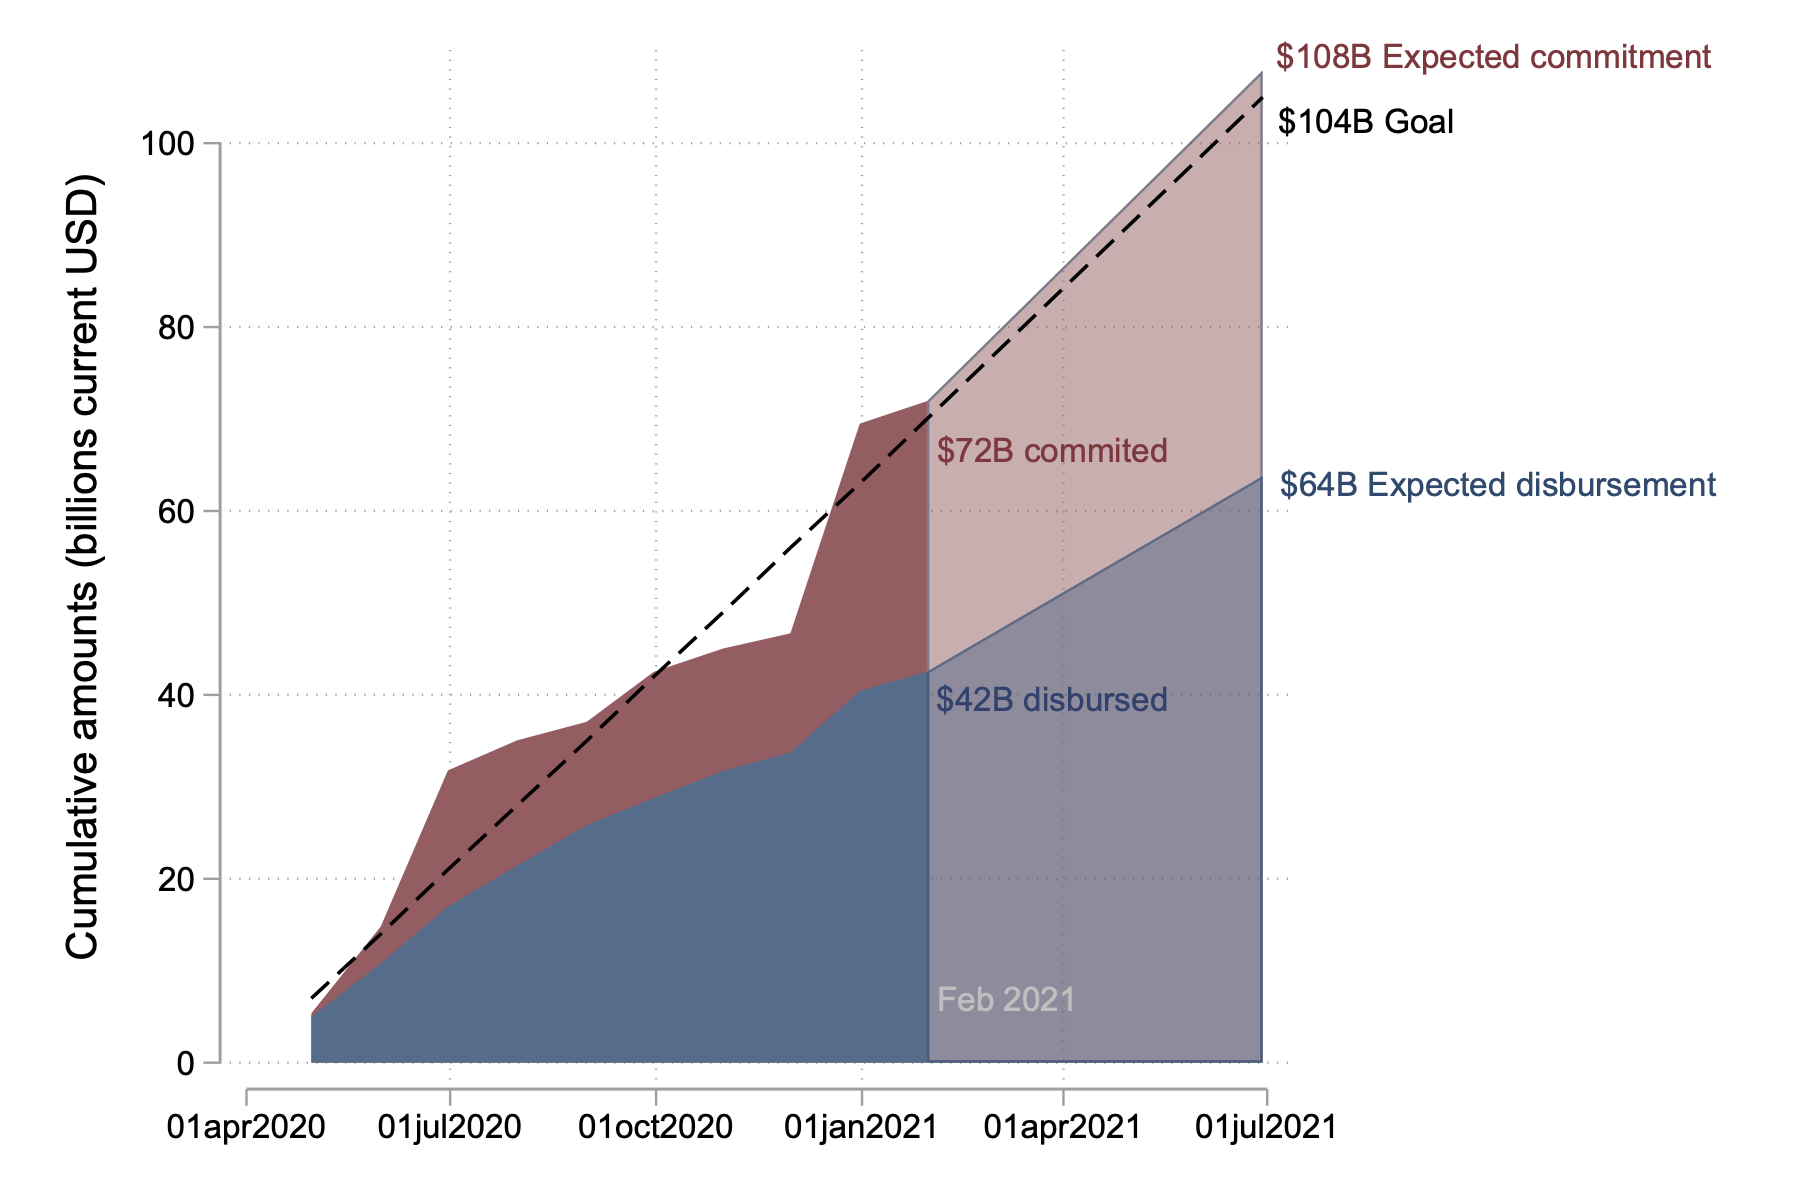
Note: Data are pulled completely from the IBRD and IDA Statement of Loans, and therefore the graph does not rely on any scraped datasets.
The trends in Figure 1 imply the Bank will only reach roughly 60 percent of its stated target for actual COVID lending. Furthermore, our count is somewhat generous here. We are including all World Bank lending to all countries for all purposes in our tally. So the $64 billion in actual disbursements that we forecast are not strictly additional funds relative to previous years nor strictly COVID related.
2. How does the speed and scale of the World Bank’s response compare to the financing needs of client countries?
It’s useful to know whether the Bank is (or isn’t) meeting its own lending targets. But that begs the question of whether World Bank lending is sufficient to meet the financing needs facing its client countries amidst the biggest economic crisis since the creation of the Bretton Woods institutions. As decades of continuous global poverty reduction get sent into reverse, is the World Bank rising to the challenge?
There’s no clear consensus on how much external finance is enough to enable a developing country to weather this crisis. Nor is the World Bank the sole (or even the primary) source of financing for fiscal stimulus during a crisis, especially for middle income countries. But we can get some insights by looking at a couple of benchmarks, which are particularly salient for poorer countries more dependent on World Bank lending.
First, the 2020 increase in World Bank lending (green and orange bars in Figure 2) is dwarfed by the magnitude of the decline in GDP growth experienced in developing countries (red bars). Final numbers have yet to come in, but the IMF estimates that low income countries saw growth fall by over 6 percentage points in 2020 relative to the previous year; meanwhile they received an increase in World Bank loan commitments of about 1.3 percent of GDP, and actual disbursements of about 0.4 percentage points. The numbers are even starker for lower-middle income countries: a roughly 10 percent drop in GDP growth offset by 0.3 percent of GDP in additional World Bank commitments and vanishingly small growth in World Bank disbursements.
Figure 2. Spending as compared to need
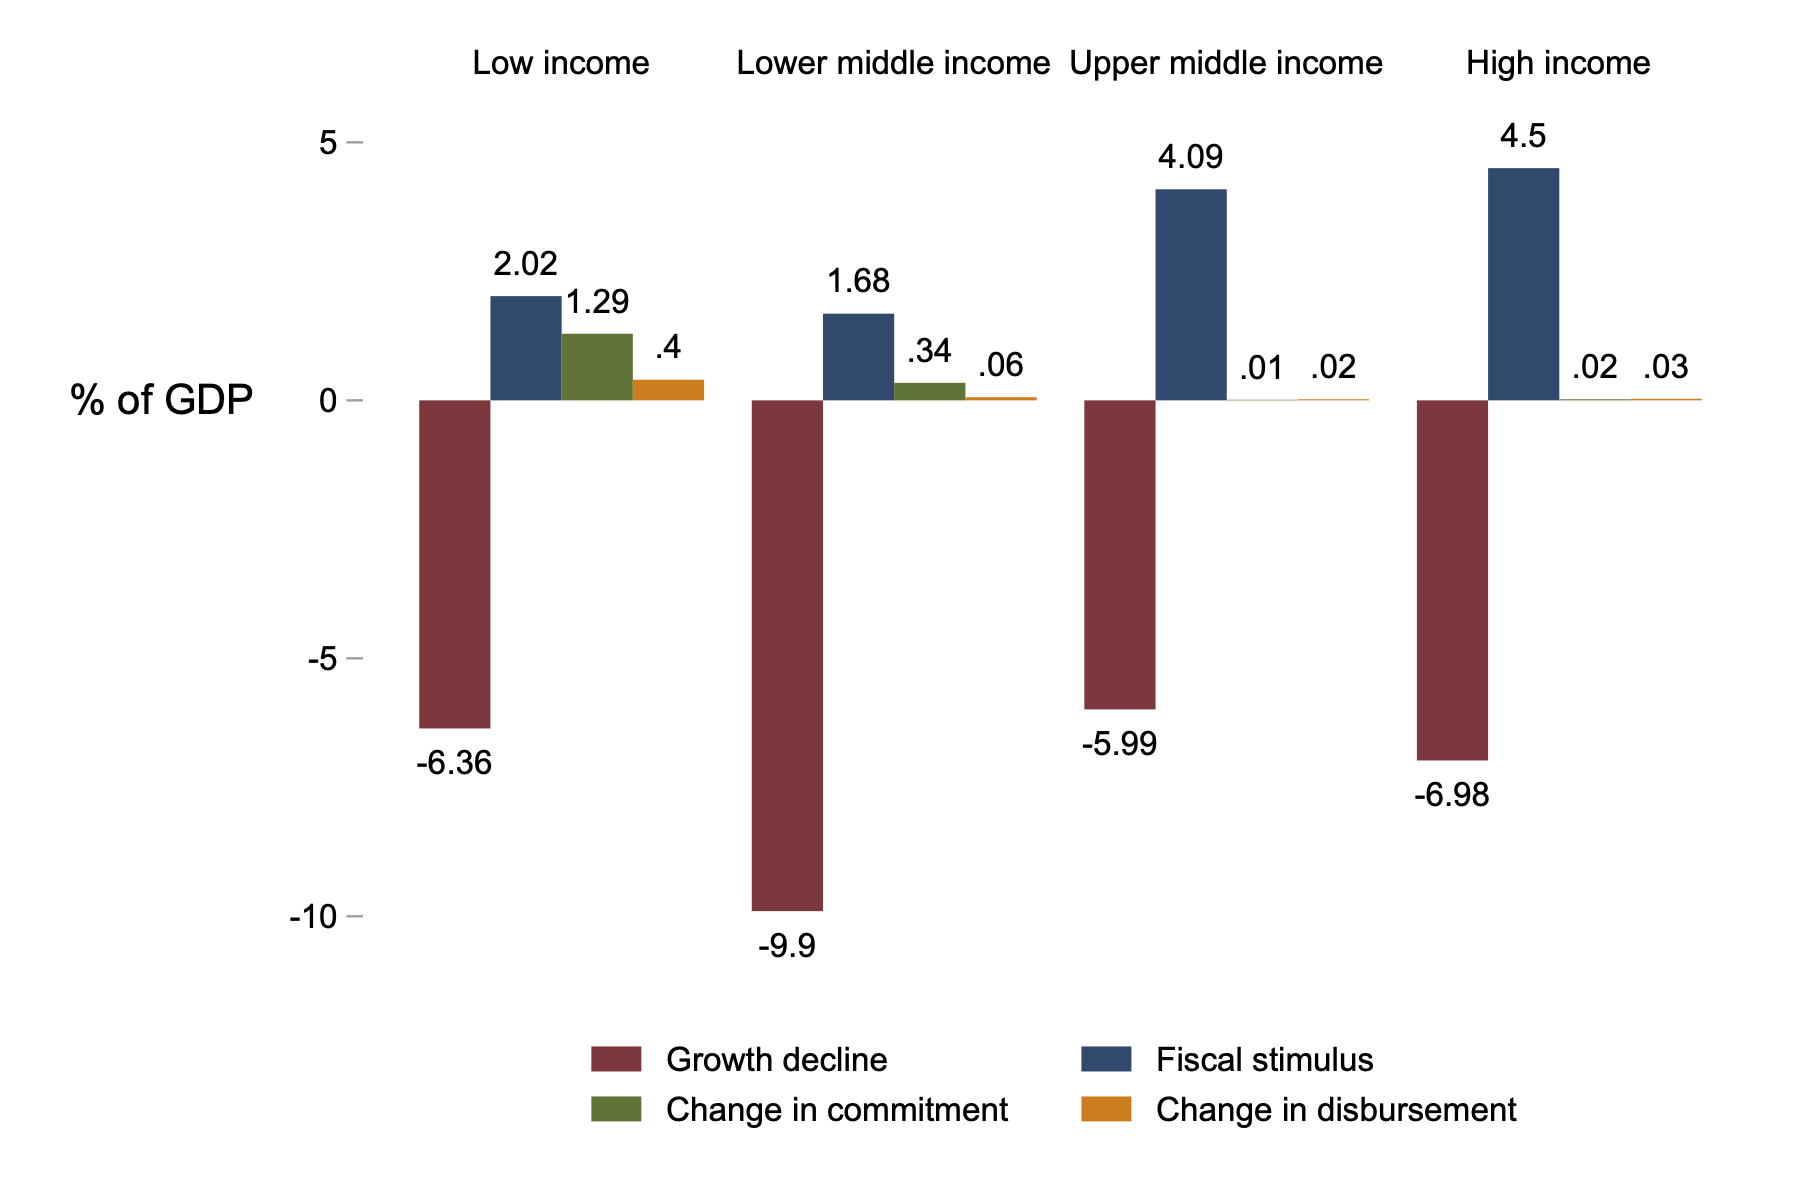
Note: All figures are weighted averages (by population) for the countries in each income group; for comparability, we use countries’ 2020 World Bank income classifications. Amounts refer to totals for February 1, 2020 to December 31, 2020. The growth decline is defined as the change in growth rates from 2019 to the (IMF’s October WEO) 2020 forecast.
Second, compare the scale of World Bank lending to the developing world to the size of the fiscal stimulus undertaken in high income countries (red bars in Figure 2). Rich countries have access to cheap domestic finance, and have enacted fiscal stimulus worth about 4.5 percent of pre-crisis GDP in the face of a forecast 7 percent GDP decline. Meanwhile, low- and lower-middle income countries have experienced similar or bigger hits to GDP growth, but only managed fiscal stimulus that is, in proportional terms, about one-third to one-half as big. World Bank lending is nowhere close to sufficient to enable them to offset the economic crisis to a similar degree as OECD economies.
3. Are loan repayments to the World Bank a major drain on developing country finances during the COVID crisis?
Following our paper from October last year, we focus here on the “net flow” position of the Bank’s borrowers. New financing commitments are good, but a better measure of Bank assistance to these governments during the crisis is the actual flow of funds to the countries net of the countries’ payments to the Bank to service prior loans.
So far the World Bank has resisted calls to join the G20’s Debt Service Suspension Initiative, or DSSI. In that context, it is particularly salient to ask: how much have developing countries been forced to repay the Bank during the crisis? Who would benefit, and how much, if the World Bank suspended debt payments during the crisis?
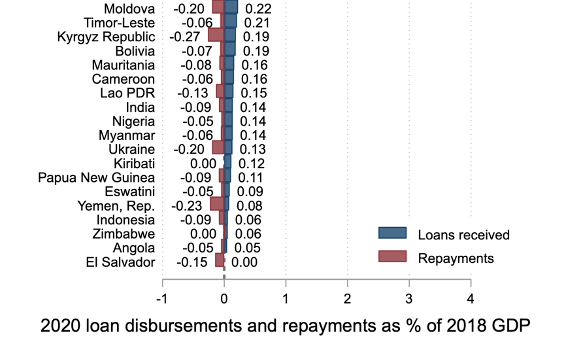
In Figure 3 we show a ranked ordering of countries by their net flows as a proportion of 2019 (or if unavailable, 2018) GDP. For almost all LICs and LMICs, net flows are significantly more positive for most countries compared to our estimates from last August, which suggests a sustained effort to increase net flows over the course of the year. For a small number of countries, the effect relative to GDP has been large (4% or more), and for about half of the countries, net financing from the World Bank amounted to at least 1% of GDP. That said, for nearly one-third of countries, net flows amount to less than 0.5% of GDP.
Only one country has repaid more to the World Bank than it has received during COVID: El Salvador. Thus, our verdict is that loan repayments, on aggregate, do not appear to be a major drain on World Bank finances during the COVID crisis compared to disbursements.
Figure 3. Payments to and from the World Bank during COVID
Gross receipts from and repayments to World Bank as % of GDP
Note: Data from February to June 2020 were scraped from the World Bank website. Data from July 2020 to December 2020 are taken from the World Bank net flows portal. The World Bank’s most recent net flows data does not provide separate data for projects that are funded simultaneously by IDA and IBRD, therefore some of the disbursements to these countries may be double counted.
4. Internally, is the bank relying on flexible loan products to get money out the door quickly?
Given our finding above that the bank is on course to disburse only about 60 percent of its COVID financing target by June 2021, it stands to reason that the institution would be doing everything possible to expedite the flow of funds. But it’s unclear if that’s the case.
Among the bank’s various lending instruments, the quickest way to get money out the door is through “development policy lending”, essentially budget support, as opposed to investment projects which disburse as costs are incurred or program-for-results loans which pay against achieved milestones.
Figure 4. Financing as share of total commitments (up to Dec. 31, 2020)
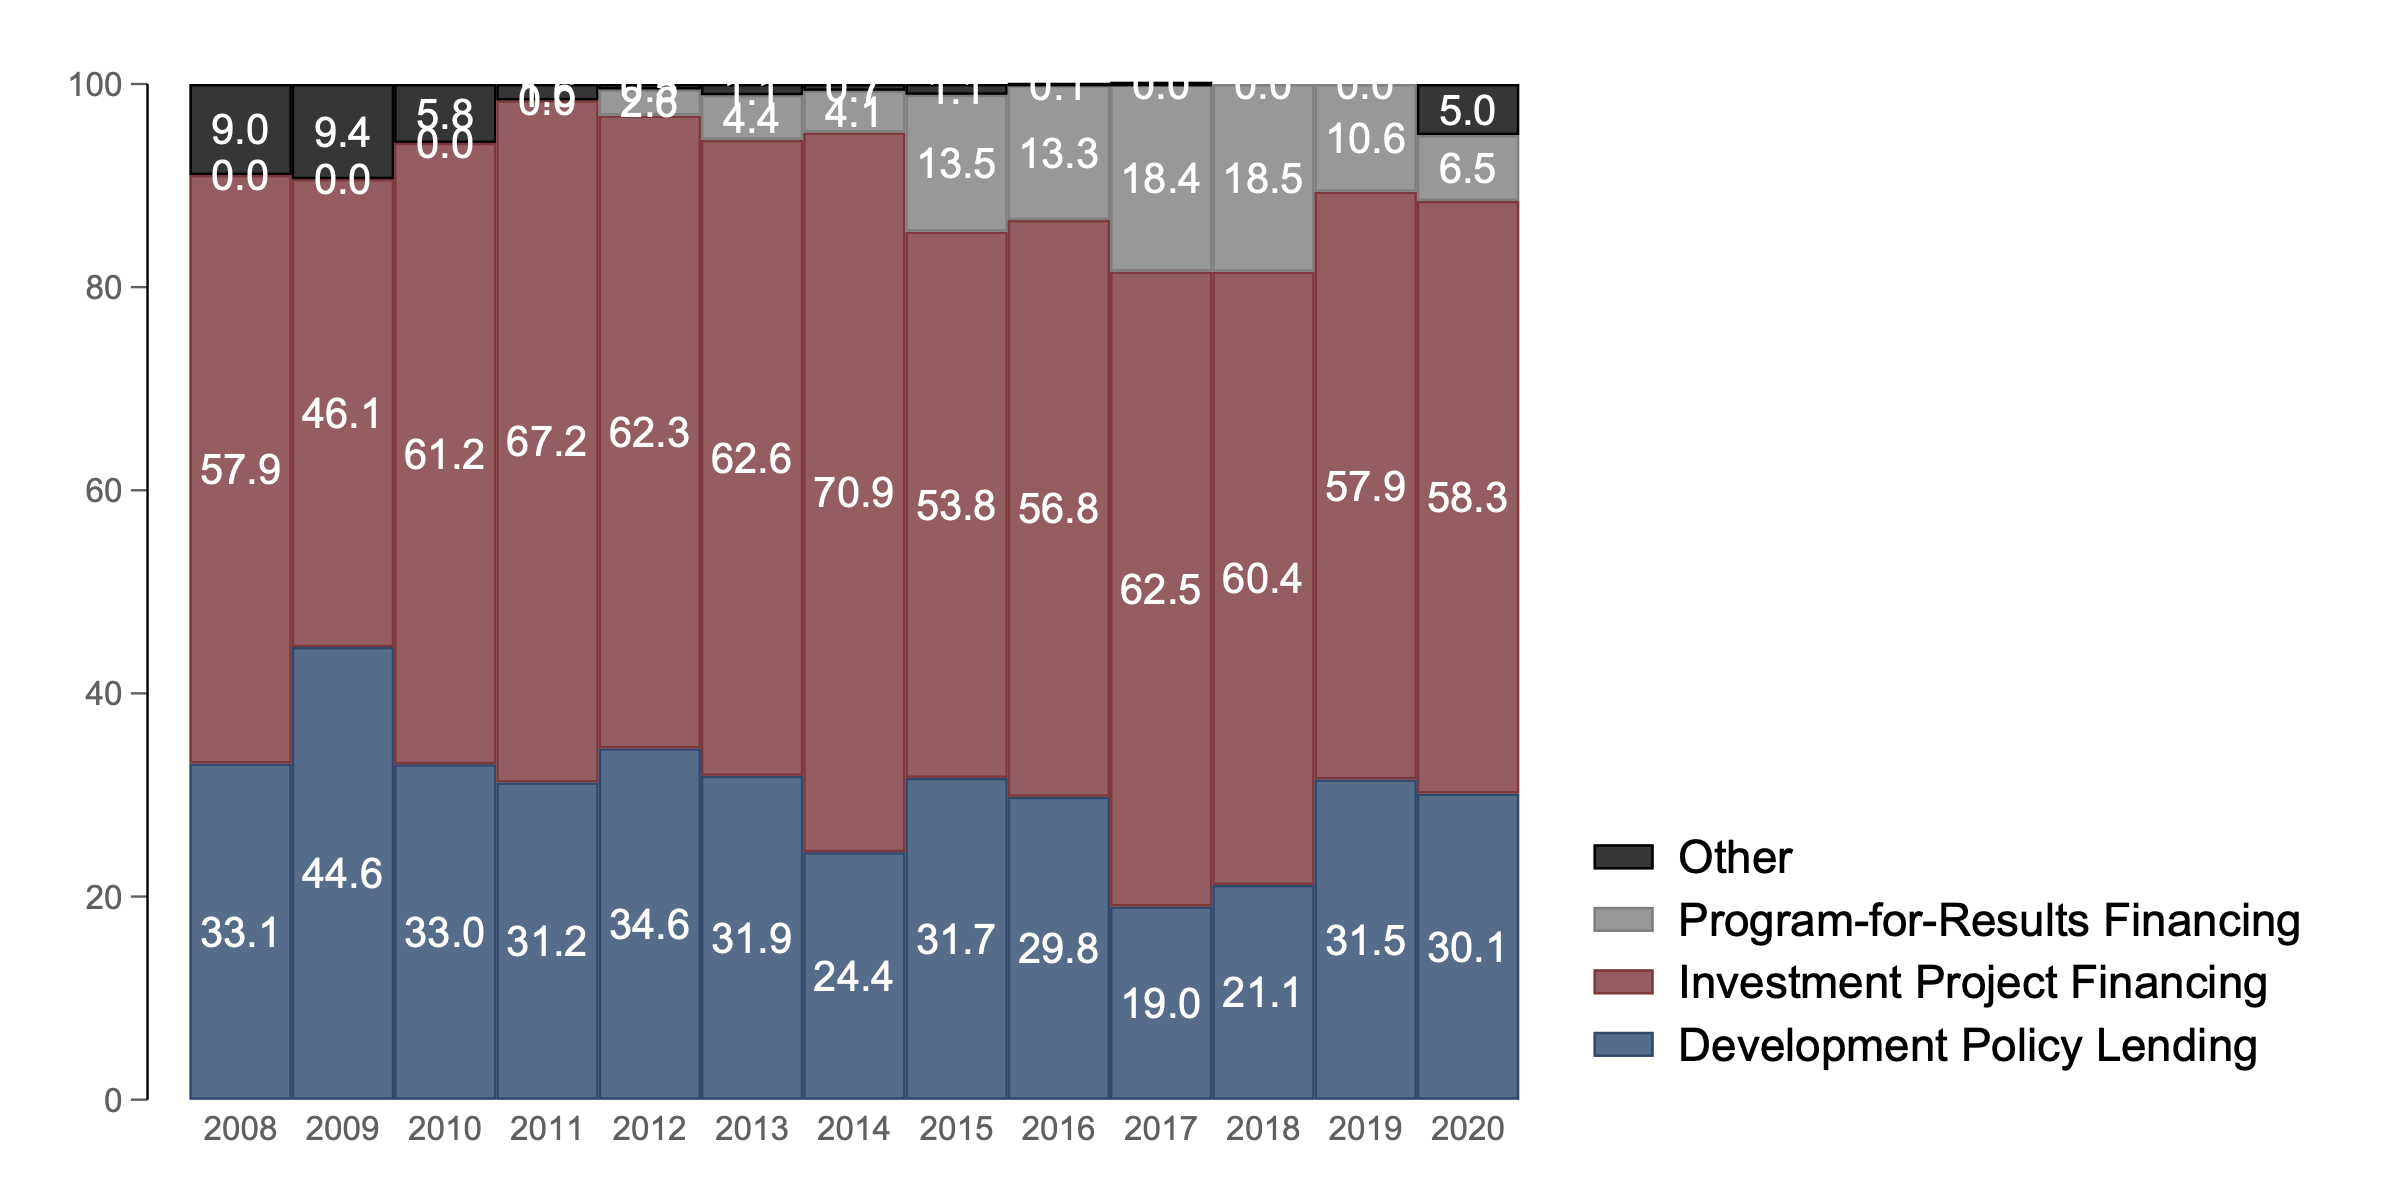
Note: years in this figure are calendar years. If a project received additional financing, the minimum of the project approval dates was used. Data are taken from the IBRD and IDA ‘Statement of Loans’.
The share of the bank’s loan portfolio routed through development policy lending has been essentially unchanged through the crisis though, as seen in Figure 4, at about 30 percent in 2020 compared to 31 percent in 2019. We remain puzzled why the bank has not pivoted to more development policy lending during the pandemic, given the urgent need for emergency financing.
Finally, we would like to acknowledge that, since the time of our initial research, the World Bank has taken a step forward in data transparency by publishing net flows country data on a fiscal year basis. Given the importance of understanding and monitoring Bank financing on net terms, we appreciate the institution’s willingness to report more clearly in this area. Ultimately, it’s for World Bank shareholders to decide whether net flows are a useful measure of corporate performance, as we believe they are. With more regular reporting, the Bank will be in better position to explain its financing program, and country-level decisions that affect net flows, throughout the crisis period.
Appendix: A note on data sources
For our October 2020 paper, we constructed a transaction-level dataset of all commitments and disbursements from, and repayments to, the World Bank from the 1990s through mid-2020. To do so, we combined a variety of World Bank sources with data we scraped from project documents and landing pages. See Duggan et al. (2020) for full details.
We are pleased to say that this update, which assesses bank lending from the start of the crisis through the end of 2020, was made easier by the World Bank’s decision—in the wake of our October 2020 paper—to publicly release its net lending data. With this release, we no longer need to painstakingly scrape other World Bank sources for data, or at least we mostly don’t have to do that.
In order to match the bank’s fiscal year data to the crisis period, we continue to rely on our data set for the period February-June 2020. We are forced to do this in order to split the 2020 fiscal year into the pre-COVID period which we ignore, and the post-COVID period included here. (The bank’s official releases aggregate the fiscal year, whereas our scraped data comes at daily frequency.) We use only the new World Bank data releases for the 2021 fiscal year, which is entirely post-COVID (July 1, 2020 onward).
Since we combine ‘official’ World Bank FY2021 data releases with data scraped from the bank’s website for FY2020 and before, it is important to establish that these sources agree for periods when they overlap. Comparing across fiscal years, we find, in 2010 through 2019, few differences between our scraped data and the World Bank's recent data releases. From 2010 to 2019, our scraped data of commitments, disbursements, and payments back to the Bank differed from those of the World Bank by 4%, 3%, and 10%, respectively. On the other hand, the story for 2020 data is different. In 2020, these figures were 19%, 3%, and 7%. In 2020, Bank data show significantly higher commitments compared to our scraped data, and we estimate greater disbursements for IBRD but lower disbursements for IDA compared to World Bank released data. For repayments on principal, interest, and fees, our estimates almost across every year overestimate the total net flows back to the World Bank (except 2010 and 2011). We do not have any explanation for these differences.
Thanks to Julian Duggan, our coauthor on the first installment of this project, whose code to scrape the World Bank website still underlies parts of the data used here.
Topics
CITATION
Morris, Scott, Justin Sandefur, and George Yang. 2021. Tracking the Scale and Speed of the World Bank’s COVID Response: April 2021 Update. Center for Global Development.DISCLAIMER & PERMISSIONS
CGD's publications reflect the views of the authors, drawing on prior research and experience in their areas of expertise. CGD is a nonpartisan, independent organization and does not take institutional positions. You may use and disseminate CGD's publications under these conditions.