Recommended

POLICY PAPER
Some Unpleasant ODA Arithmetic
Official development assistance (ODA) can be and often is spent in well-off countries, where a vanishingly small proportion of the population live in poverty (Dissanayake & Tahmasebi, 2021). Such spending is sometimes justified either on the grounds that a large number of the global poor nevertheless live in well-off countries or that spending in these countries supports the delivery of important global public goods (GPGs), such as action against climate change or the hosting of refugees—though the extent to which such spending really has “the welfare and economic development of developing countries” at its heart can and should be disputed (Dissanayake, 2021).
The extent to which this pattern of distribution reflects political and public preferences or technocratic preferences, however, is less clear. One possibility is that the justifications offered for spending in richer places should be taken at face value, and technocrats would allocate a substantial proportion of ODA to relatively wealthy countries because of the poverty and GPG implications of such spending if left to their own devices. Another possibility is that allocations reflect (actual or perceived) political preferences and technocrats are required to implement a less pro-poor country distribution of ODA than they would select themselves. A third possibility is that the observed distribution of ODA is an accident, driven less by a grand vision of where aid should be spent and more by the accrual of country- or programme-level decisions that result in a large portion of ODA going to relatively well-off countries. Indeed, though regression analysis suggests that the existing distribution of ODA across recipient countries is driven partly by poverty and income and partly by donor-recipient ties (either historical or economic), a large part of the variation across donors in aid allocation remains unexplained (Kenny & Yang, 2021).
In this note, we use data from a survey of middle and senior managers working in agencies that provide ODA to developing countries to document that such technocrats hold inaccurate beliefs about the actual distribution of ODA their agency and country provide to different kinds of recipient; that they express preferences for a much more pro-poor country allocation of ODA than their agencies actually undertake; and that they expect that their agencies’ actions will in the future become more pro-poor country than they think it currently is. We discuss why we might observe such systematic discrepancies between actual outcomes and the beliefs of senior managers, and suggest both the potential and the limitations to what better information might achieve. The note proceeds as follows: the next section describes the survey and the data available. The third section summarises the key results. The final section concludes with a discussion of the implications of the results, focusing on what they contribute to our understanding of how donor aid allocations across country types should be understood.
A novel survey and dataset
Our survey tool was sent to 314 officials across around 100 distinct agencies. We used a convenience sample, based on existing relationships with the surveyed respondents. This sample is not representative of the agencies. The officials we survey are systematically more likely to be senior decision-makers, to be involved in the aid effectiveness agenda, to be working on questions of agency strategy, and to be interested in research about ODA and development, based on their history of engagement with CGD. We received 94 partial responses (yielding a response rate of 30 percent), and 72 full responses. Our survey covered a range of issues relating the distribution of ODA by sector, geography, and specific activities; and about the broader aid effectiveness agenda. Only results relating to the geographical distribution of ODA are reported in this note (the remaining data will be analysed and reported separately). We asked four questions specifically related to the distribution of ODA across countries:
- To the best of your current knowledge (i.e., without doing any further research to answer this question), what percentage of ODA provided by your country is actually spent in support of countries at different income levels?
- In your personal opinion, what percentage of ODA should be spent in countries at different income levels?
- Your organisation receives an unexpected increase in its ODA allocation of $100 million. How would you allocate the funding across countries at different income levels?
- Thinking ahead to the next 10 years, how do you think the current leadership of your organisation would like the percentage of ODA provided by your agency to eventually be spent in support of countries at different income levels?
For each question, we asked respondents to enter a value for low-, middle-, and high-income countries (LICs, MICs, and HICs, respectively), and imposed the restriction that their answers must sum to 100. We also asked about each official’s level of seniority in the organisation and the primary location of their career in the agency (headquarters or in country offices, or evenly divided), and inferred from their agency name whether their country is a member of the OECD’s Development Assistance Committee (DAC). We do not report the agency or country name for any specific response, as promised in the informed consent text for the survey. All data are individually anonymised.
We received usable responses for these questions from 70 respondents across 46 agencies for these questions. Thirty-four of the officials described themselves as senior managers; 47 are based at agency headquarters; and 60 of them work for agencies based in DAC members. The results are presented in the next section.
Officials are far more pro-poor country than their agencies
We focus on the results relating to the allocation of ODA to LICs and MICs throughout this note, as the portion of ODA respondents either chose to allocate to HICs or thought their agency or country already was allocating to them was very small. Table 1 summarises the share of ODA to LICs and MICs respondents selected for each of the four questions posed. It is immediately clear that officials’ own beliefs about the optimal allocation of ODA to LICs and MICs is substantially more heavily weighted to LICs than their belief about the current practice in the countries they work in. Accordingly, when asked to allocate a hypothetical additional pot of $100 million across income classifications, they are slightly more pro-LIC than even their preferred final balance across LICs and MICs. They also typically think that their own agency will, over time, drift towards their preferred allocation—at odds with both the current trend in ODA allocations (Dissanayake & Tahmasebi, 2021) and most media coverage.
Table 1. Summary of survey results
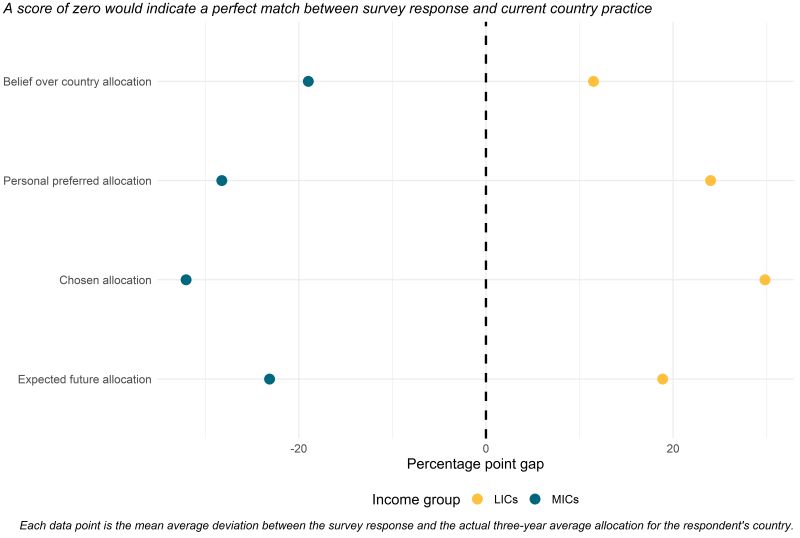
These results become even more striking when compared to the actual allocation of ODA provided by their agency. We took each individual’s responses and compared them to the actual average ODA allocations across LICs and MICs made by their country over the last three years.[1] Figure 1 summarises these results. The x axis is the average difference between the actual practice of the donor country the respondent works in and their answers to the survey questions. Negative values thus indicate that their answer reflects a smaller allocation than the actual practice of their country; positive values suggest the survey response is greater than the actual practice of their country.
Figure 1. Difference between survey respondents’ answers and actual country allocations
In the results presented above we limit our analysis to bilateral ODA with a specified recipient country; including imputed multilateral spending does not change the results substantively.[2] Officials are not just progressive (in that they prefer allocations heavily weighted towards LICs) and optimistic (in that they think future movements in ODA allocation will bring their agencies more in line with this preference), they are also deeply misinformed. On average, they believe their countries allocate around 11 percentage points more of their ODA to LICs than they actually do, and underestimate the proportion allocated to MICs by almost 20 percentage points (the discrepancy arises from the fact that they also hold mistaken beliefs about the prevalence of ODA spending in high-income countries). These are not small mistakes. For a donor the size of Germany, this would amount to overestimating the volume of ODA allocated to LICs by around $3,080 million, and underestimating the amount allocated to MICs by around $5,600 million. These misapprehensions are widespread in the sample. Indeed, only nine respondents made an estimate of their country’s allocation within 5 percentage points of the actual proportion of ODA their country provides to LICs. This makes the professed preference of donor officials for spending ODA in LICs even more remarkable–they are not just more progressive than their organisations, but substantially so: they prefer an allocation which shifts ODA allocations towards LICs by almost one-third of the current portfolio size.
The appeal and limits of better information
A tempting conclusion from the foregoing analysis is that it would be simple to incentivise a reallocation of ODA away from MICs and towards LICs. Since decision-makers at aid agencies hold incorrect beliefs about the actual actions of their agencies, and have preferences for an ODA allocation that is substantially more progressive than current practice, perhaps informing them of this discrepancy can motivate change. Evidence from a range of settings has shown that simple information provision interventions can shift outcomes meaningfully (see, for example, Jensen 2010, Nakasone 2013, Labonne & Chase 2009, and FAO 2017).
Such a conclusion may be unduly optimistic. While providing information can have large effects in cases where it is costly to obtain, difficult to interpret, or simply unavailable altogether, none of these characterise information on the allocation of ODA by any given donor. Sixty of the 70 respondents of this survey work for DAC member countries. Complete, reliable, and comparable information on the allocation of ODA for each of these countries is trivially easy to obtain—indeed, similar data is already collected and presented for every DAC member as part of the OECD’s Development Finance Data dashboard. If a sample consisting of around 50 percent senior managers and 50 percent middle managers from a range of donors holds, on average, highly incorrect beliefs about the distribution of ODA across income classifications despite the ease with which it can be found, sheer laziness and ignorance is a less plausible explanation than low returns to holding such beliefs for their day-to-day work.
If senior technocrats would like to spend more ODA in poorer countries, but do not invest in accurate information about current practice even in their own organisations, it suggests that the constraint to allocating ODA to poorer places is not technocratic preference due to either the existence of poor populations in large countries or the need to spend on GPGs. That leaves two possibilities. One is that the institutional decision-making process for ODA allocation is sufficiently decentralised that final allocations bear little resemblance to agency or technocrat preferences. This seems unlikely: most DAC donors either support the World Bank’s system for generating an optimal distribution of ODA or have their own, as the UK does (Mitchell & Hughes, 2020). This does not necessarily imply that such a system is the only input into determining aid allocations, but does such that extreme decentralisation is less likely to be driving these results.
That leaves political drivers at odds with technocratic preferences. In the UK at least, there is sufficient anecdotal evidence that political preferences lean towards spending in geopolitically important, but substantially more developed, locations; Boris Johnson, announcing the merger of the UK’s Department for International Development with the Foreign and Commonwealth Office to form the Foreign, Commonwealth and Development Office suggested that one reason behind his decision was so that the UK would shift its gaze from countries like Zambia towards much wealthier countries like Ukraine. A number of observational studies have found that either political (Tingley, 2009, and Greene & Licht, 2017) or geostrategic (Neumayer, 2003, and Kibria, Oladi, & Bosworth, 2021) concerns explain observed choices or changes in the allocation of foreign aid, though as noted before, a substantial part of the variation remains unexplained in most of these studies.
That said, there has been little work eliciting either stated preferences or preferences revealed through directly observed choices over the distribution of ODA among either of politicians or the public. None of the polls that we found asked any questions at all about ODA allocation by geography or income status.[3] In fact, among the public, respondents are more likely to express support for the moral mission of aid provision, hardly in line with a focus on richer places of geopolitical interest. Better understanding stated preferences and if and how they are at odds with the actual allocation of ODA may provide avenues for exploring on which margins observed allocation patterns are most amenable to change. Political preferences in a single domain (spending in richer or poorer places) may conflict with preferences in other domains (spending in ex-colonies or other countries). Understanding such conflicts can help us frame choices to more clearly highlight trade-offs.
The evidence presented in this note suggests donor officials have preferences that are much more progressive than the actual decisions taken by the agencies they represent. While this is unsurprising given the likelihood of mission-based matching of aid bureaucrats to aid agencies, it does suggest that institutional and political drivers of allocation decisions are important; the dearth of research directly documenting the channel through which they impact allocations suggests that our understanding of why donor practice looks like it does is incomplete.
References
Dissanayake, R. (2021). The Roots of Policy Incoherence: Domestic Policy, Global Public Goods, and International Development. Center for Global Development. Retrieved from /publication/roots-policy-incoherence-domestic-policy-global-public-goods-and-international
Dissanayake, R., & Tahmasebi, A. (2021). Some Unpleasant ODA Arithmetic. Center for Global Development. /publication/some-unpleasant-oda-arithmetic
FAO. (2017). Building Agricultural Market Information Systems: A literature review. Food And Agriculture Organization of the United Nations. Retrieved from https://www.fao.org/3/i7151e/i7151e.pdf
Greene, Z. D., & Licht, A. A. (2017). Domestic Politics and Changes in Foreign Aid Allocation: The Role of Party Preferences. Political Research Quarterly. Retrieved from https://journals.sagepub.com/doi/10.1177/1065912917735176
Jensen, R. (2010). The (Perceived) returns to education and the demand for schooling. The Quarterly Journal of Economics. Retrieved from https://www.jstor.org/stable/27867489
Kenny, C., & Yang, G. (2021). Why Do Some Donors Give More Aid to Poor Countries? Center for Global Development. Retrieved from /publication/why-do-some-donors-give-more-aid-poor-countries
Kibria, A., Oladi, R., & Bosworth, R. (2021). Political economy of aid allocation: The case of Arab donors. The World Economy. Retrieved from https://onlinelibrary.wiley.com/doi/abs/10.1111/twec.13139
Labonne, J., & Chase, R. S. (2009). The Power of Information: The Impact of Mobile Phones on Farmers’ Welfare. The World Bank Sustainable Development Network. Retrieved from https://documents1.worldbank.org/curated/en/132511468297548935/pdf/WPS4996.pdf
Mitchell, I., & Hughes, S. (2020). Which Countries Miss Out in Global Aid Allocation? Center for Global Development. Retrieved from /publication/which-countries-miss-out-global-aid-allocation
Nakasone, E. (2013). The role of price information in agricultural markets. International food policy research institute. Retrieved from https://www.ifpri.org/publication/role-price-information-agricultural-markets
Neumayer, E. (2003). The Determinants of Aid Allocation by Regional Multilateral Development Banks and United Nations Agencies. International Studies Quarterly. Retrieved from https://www.jstor.org/stable/3096078
Tingley, D. (2009). Donors and domestic politics: Political influences on foreign aid effort. The Quarterly Review of Economics and Finance. Retrieved from https://scholar.harvard.edu/dtingley/files/qref.pdf
[1] We used OECD CRS data.
[2] For the responses for which such an adjustment was possible, including multilateral ODA exacerbates the discrepancies observed above for some, and for others it attenuates them. Both on average and for the individual donors checked, the effect is small.
[3] We looked at major polling organisations in the US, UK, and Europe and also used broad Google searches to find polls relating to foreign aid. None ask directly about ODA allocation, but one survey from the EU Barometer did find support for ‘”deepening relationships and financial investments in Africa.”
Topics
CITATION
Dissanayake, Ranil, and Bernat Camps Adrogué. 2021. Progressive, Optimistic, and Misinformed: What Donor Officials Believe about ODA Allocations. Center for Global Development.DISCLAIMER & PERMISSIONS
CGD's publications reflect the views of the authors, drawing on prior research and experience in their areas of expertise. CGD is a nonpartisan, independent organization and does not take institutional positions. You may use and disseminate CGD's publications under these conditions.


