Recommended

Blog Post
Half a Trillion in Dry Powder?
CGD NOTE
World Bank Budget Support in the Time of COVID
Blog Post
Can DFIs Be First Responders in a Crisis?
Key takeaways
The pandemic and its economic impact have been a revealing test of the multilateral development bank (MDB) system and of individual MDBs. Although lending by the MDBs as a group rose significantly in 2020 (39 percent), this is much less than the rise in MDB lending in response to the Global Financial Crisis (GFC) (77 percent), despite the much greater economic and social costs of the pandemic.
Performance across institutions has varied greatly, but overall, growth was considerably stronger in finance to the public sector than to the private sector. Total non-sovereign (private) MDB finance increased by only 11 percent and actually fell 2 percent for countries eligible to borrow from the International Development Association (IDA)—the World Bank’s concessional window for poor countries. (The International Finance Corporation [IFC], the private sector arm of the World Bank, was an exception with a 43 percent increase in commitments to poor countries, including trade credits.)
IDA was a bright spot on the sovereign side. In contrast to the GFC period, sovereign lending to IDA-eligible countries grew more rapidly than lending to higher income developing countries (61 versus 28 percent). IDA more than doubled its commitments in 2020 to reach a record $38 billion.
In general, the sector focus in sovereign lending appeared aligned with needs, with the exception of the health sector. Social protection and public sector management grew most in absolute terms, delivering much needed financing for fiscal support and social transfers. But both public and private MDB finance for the health sector, though up sharply, remained tiny in volume terms.
Financial sector commitments saw the biggest uptick for private finance operations, though a significant portion of 2020 commitments was short-term trade credits, which generally go to larger banks and firms.
At this stage, we draw four preliminary policy implications:
-
MDBs should consider concentrating broad budget support more on poorer countries and focusing budget support for middle-income countries more on global public goods (GPGs) like combatting climate change, reducing pandemic risk, and improving pandemic readiness.
-
MDBs need to find ways to mount a more vigorous countercyclical surge in financing to the private sector during crises, including in poor countries.
-
Despite the 2020 lending increases, the pandemic is sounding a wake-up call on the urgent need to bolster MDB efforts on health.
-
Even during this global crisis, the MDBs failed to function collectively and cooperatively as a system. It has become increasingly clear that we are missing a critical piece of global architecture for multilateral governance—a body responsible for holding MDBs accountable as a group for crisis responses and ongoing support for GPGs.
Overview
In a CGD note earlier this year, we compared the scale of the multilateral development banks’ (MDBs) response in 2020 to the COVID-19 crisis to their response to the Global Financial Crisis (GFC),[1] finding that, though commitments did increase substantially in 2020, their growth lagged well behind the expansion following the GFC (Figure 1). The smaller 2020 response contrasted with the relative scale of economic damage in the two periods. Developing economies suffered a 3.5 percent contraction in GDP in 2020, compared to slower but still positive 1 percent growth in 2009.[2] This note expands on that analysis, updating the data to include the African Development Bank (AfDB) and disaggregating 2020 sovereign and non-sovereign commitments by sector and by country income group.[3]
Figure 1. Percent change in MDB commitments, by crisis period

Note: The GFC percent change was calculated for 2008–2009 average annual commitments compared to 2005–2007 average annual commitments, as reported by the World Bank’s Internal Evaluation Group.[4] The COVID-19 percent change compares the 2020 commitments to the 2019 commitments.
For this graph, IADB does not include IDB Invest, which was launched after the GFC. The World Bank does not include MIGA.
Sovereign commitments
MDB sovereign commitments rose 39 percent from 2019 to 2020,[5] from $87 billion in 2019 to over $120 billion in 2020 (Figure 2). As we identified in our previous analysis,[6] IDA’s crisis response stands head and shoulders above the rest of the pack, both in terms of absolute and percentage increases, more than doubling is commitments to reach $38 billion in 2020.
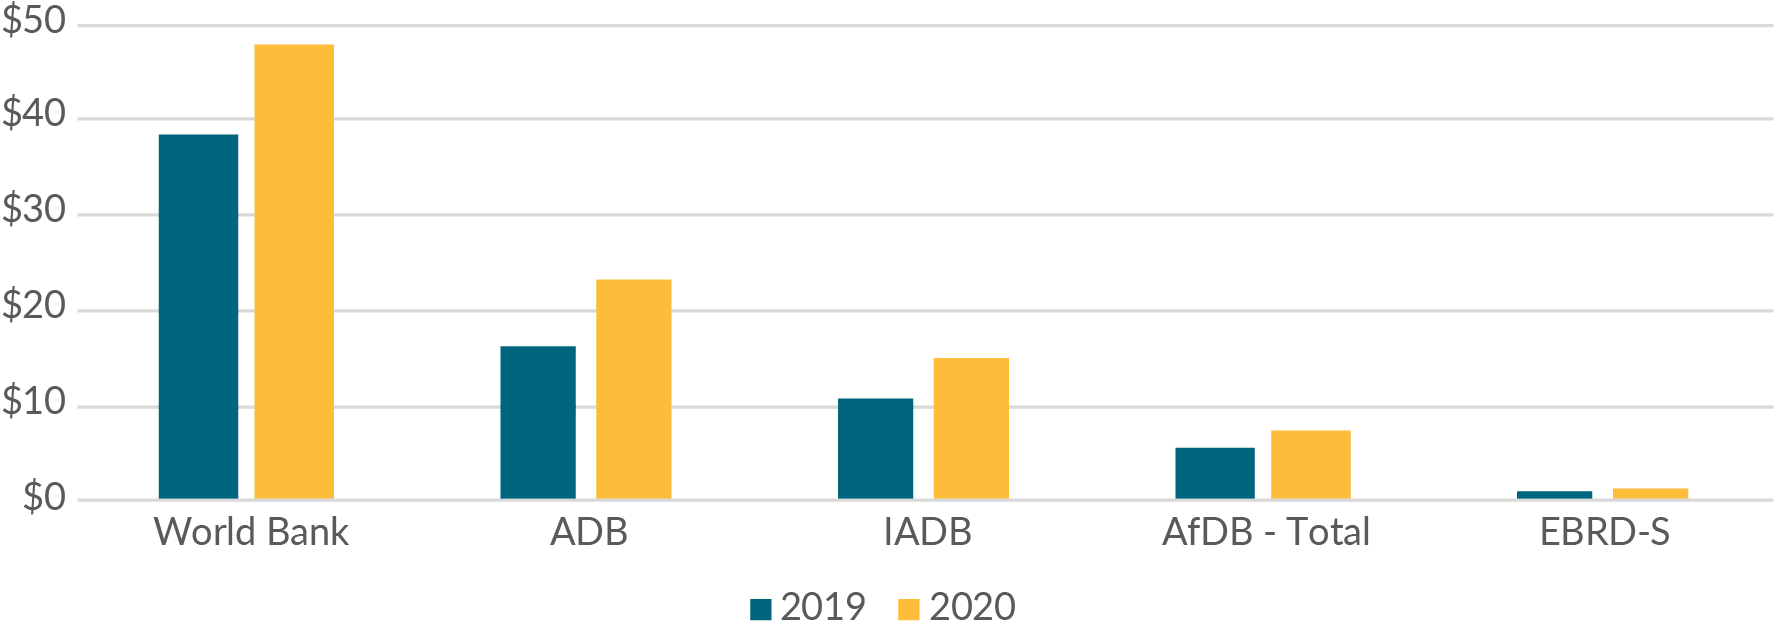
Figure 2. Sovereign commitments by MDB ($ billions)

Of the regional MDBs, ADB led, with a 44 percent increase year-on-year to reach $28 billion sovereign commitments in 2020 (ADB-S). The EBRD’s sovereign arm (EBRD-S) and the IADB also grew, but more modestly—17 percent and 8 percent, respectively. Only for the AfDB and ADF (the AfDB’s concessional, or IDA-equivalent, lending arm) did commitments decline, by 47 percent and 24 percent, respectively.
At the same time, total AfDB disbursements (across both AfDB and ADF) increased by 44 percent, demonstrating a concerted effort to prioritize delivering immediate crisis response finance (Figure 3). Despite the recent (2019) AfDB capital increase and ADF replenishment, lending capacity for the bank remains constrained because (1) the additional capital in the AfDB is being paid in by shareholders over an extended period of time, and (2) the ADF remains very small, with an annual concessional lending capacity of only $2.5 billion.[7] Similarly, IADB’s modest commitment growth contrasted with its strong disbursement growth (39 percent), which, in absolute terms, outpaced commitments by nearly $1 billion.
Figure 3. Sovereign disbursements by MDB ($ billions)
While disbursements are important, without a significant increase in new commitments in 2020, the size and duration of crisis response will be limited going forward, reducing these institutions’ capacity to meet the challenges of the ongoing pandemic and its prolonged economic impact.
Sovereign commitments by sector
To enable a comparison of sectoral commitments across institutions, we created a common sector list and mapped the different MDB sector definitions to the common list.[8] Doing so reveals that public sector management and social protection commitments were the primary drivers of the increase in lending on the sovereign side, rising 51 percent and 216 percent, respectively. Public sector management (PSM) encompasses loans for a broad range of purposes ranging from unrestricted budget funding to support for structural public sector reforms (e.g., tax administration, public investment management, digitalization, national insurance plans, etc.).
PSM reached the highest absolute total in 2020, $27 billion, driven in large part by ADB’s $13 billion allocation to its COVID-19 Pandemic Response Option (CPRO) (Figure 4).[9] CPROs basically functioned as relatively unrestricted budget support for recipient governments, with little to no conditionality for disbursement. By contrast, most of the World Bank’s budget support operations were conditioned on a set of prior actions, ranging from future disaster response planning to medium-term fiscal transparency measures, limiting the speed of disbursement in the current crisis.[10] Research from the World Bank’s own Internal Evaluation Group (IEG) has found that “many unsuccessful operations are overwhelmed by the effects of shocks even if they support reforms that had been deemed consistent with medium term government priorities prior to the respective crisis.”[11] In some cases, slow disbursements may contribute to low-income countries’ growing preference for faster disbursing (but more expensive) commercial debt.[12]
Figure 4. Sovereign commitments by sector ($ billions)
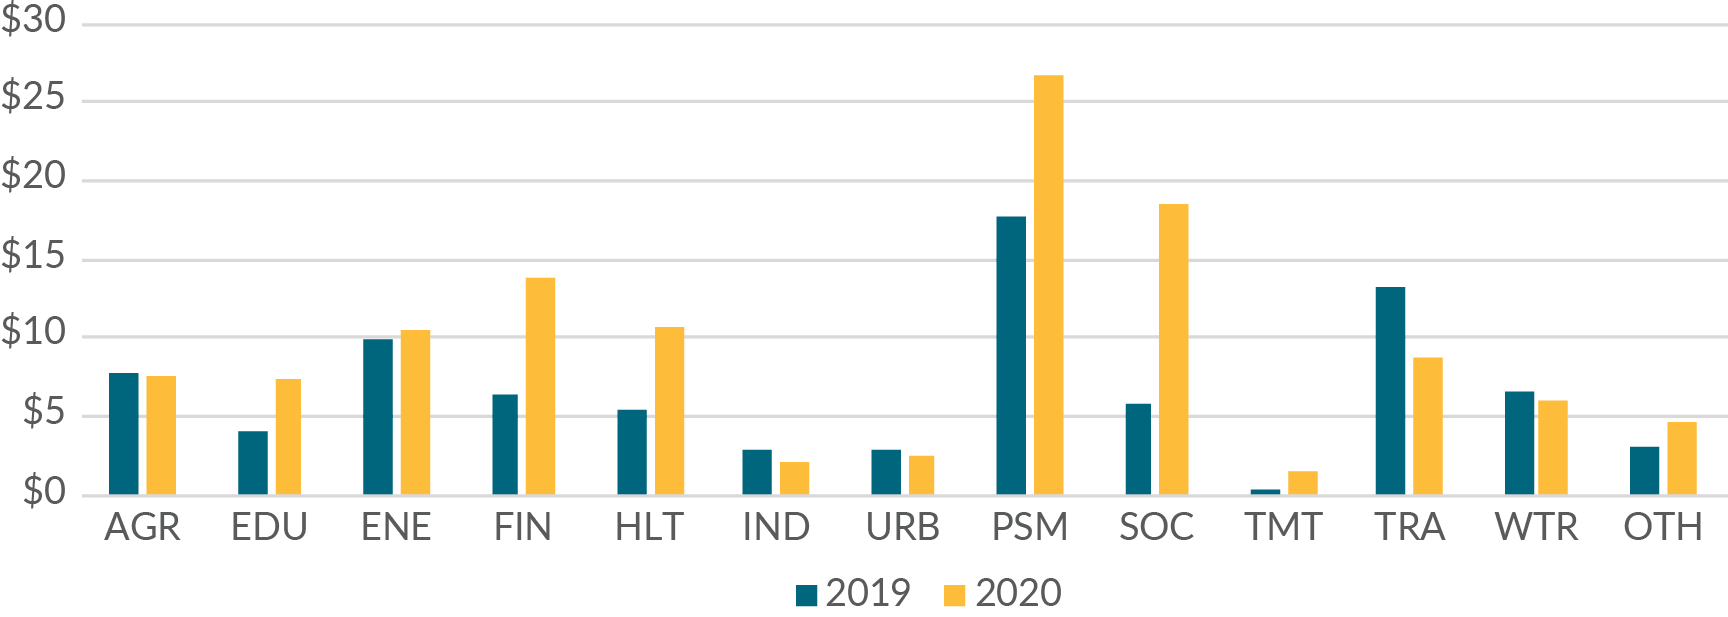
While PSM already had the highest level of commitments in 2019, social protection had relatively lower levels of commitments prior to COVID-19, outpaced by agriculture, energy, finance, transport, and water. However, with an increase of over $5 billion in commitments from IDA and IBRD each, social protection rose to the second highest of all sectors, at $18 billion in 2020 (Figures 5 and 6).[13]
Figure 5. IBRD commitments by sector ($ billions)

Note: Some IDA-eligible countries have limited access to IBRD lending as part of operations that blend concessional and non-concessional finance.
Figure 6. IDA commitments by sector ($ billions)

Health sector commitments also rose significantly in percentage terms, 93 percent year-on-year. However, given the sector’s low level of 2019 commitments ($5.5 billion), the 2020 volume only reached $10.7 billion—significantly less than both PSM and social protection. We observe a similar trend for education commitments—a strong percentage increase of 74 percent, but given its low base, a minimal impact on overall sovereign commitment growth.
Faced with competing priorities of providing much needed income support to their citizens and investing in health, education, and future pandemic preparedness, governments with limited fiscal space will need expanded support from MDBs to fund solutions. MDBs can bring together an array of tools—sovereign loans, grants, and guarantees—to help countries make progress on their medium- and long-term human capital goals while also managing the current crisis.[14]
Sovereign commitments by country income groups
Given the large differences in countries’ fiscal response capacity[15]—ranging from an average of 1.8 percent of GDP for poor countries to 24 percent for advanced economies—understanding the flows of MDB commitments across different country income groupings is an important test of whether they target sovereign finance to the countries most in need of more fiscal space. Encouragingly, the poorest countries—those eligible for IDA funding[16]—saw the greatest growth in commitments in both absolute and percentage terms, rising by $20 billion, or 61 percent year-on-year, to reach $53 billion (Figure 7).
Figure 7. Sovereign commitments by country income group

IDA accounted for the vast majority of this increase ($19.7 of the $20.3 billion, or 97 percent), with IADB contributing the remaining 3 percent. Commitments to IDA-eligible countries declined for ADB and EBRD. Fifty-six percent of ADB borrower countries and 11 percent of EBRD borrower countries are IDA-eligible, but non-IDA eligible countries in both cases include most of the largest economies. Notably, the share of AfDB commitments going to IDA eligible countries fell slightly in 2020 (Figure 8).[17]
Figure 8. Share of sovereign commitments to IDA-eligible countries, by MDB

In addition to the supply-side constraints, the AfDB decrease could be related to African countries’ recent tendency to turn toward alternative sources of finance. According to the AfDB’s 2021 African Economic Outlook,[18] the COVID-19-related surge in public financing needs and the growing share of debt from commercial and non-Paris Club lenders are reflected in the increase in the average debt-to-GDP ratio on the continent from 60 percent in 2019 to 70 percent in 2020. In addition, exchange rate depreciation, a looming rise in interest rates, and revenue constraints pose serious challenges to African countries’ debt sustainability. Similar dynamics are at play in Latin America, where the pandemic has seen the region’s debt-to-GDP ratios rise by a similar margin, from 69 percent in 2019 to 79 percent in 2020.[19] Despite these debt dynamics and the economic effects of the pandemic itself, many countries continued to have access to global capital markets in 2020.
Non-sovereign commitments
Non-sovereign MDB commitments also increased from 2019 to 2020, but only by 11 percent in total—much less than the 39 percent increase on the sovereign side (Figure 9). Prior to the pandemic, non-sovereign lending accounted for approximately one-quarter of total MDB commitments. This figure has since fallen to one-fifth.
Figure 9. Non-sovereign commitments by MDB ($ billions)

Note: IFC 2020 total has risen since last CGD analysis due to updates in base IFC dataset.
Looking across institutions, IFC and IDB Invest jump out as the top performers, with increases of 13 percent and 45 percent, respectively. The pickup from EBRD was 6 percent, and ADB’s non-sovereign operations (ADB-NS) actually declined year-on-year, by 13 percent. In both cases, the balance sheets for these two institutions combine their sovereign lending and private finance operations, suggesting that strong growth on the sovereign side might constrain finance on the private side. Analysis by Clemence Landers and Rakan Aboneaaj suggests, however, that the MDB system could significantly improve its financial efficiency by adopting less conservative capital adequacy approaches.[20] Indeed, they find that, using indicative metrics like equity-to-loan ratios for each institution—which give a rough sense of how much lending could be leveraged by a dollar of shareholder equity— setting more ambitious targets could mobilize more than $400 billion in additional lending across all the MDBs.[21] (These targets are still more conservative than commercial bank ratios.)
Non-sovereign commitments by sector
Non-sovereign operations saw only modest upticks in most sectors, which follows given the limited expansion in non-sovereign lending in general (Figure 10). Some sectors important for sovereign commitments are not found among non-sovereign operations, including PSM and social inclusion in the form of public transfer payments. In agriculture, energy, and finance, we do see MDB private finance increases, especially in financial sector commitments, that can support on-lending to struggling enterprises, including micro, small, and medium enterprises.[22] But a significant portion of ADB-NS and IDB Invest’s non-sovereign commitments—69 percent and 43 percent, respectively—was short-term trade finance programs, which tend to support trade credits for larger banks and their larger firm clients.
Figure 10. Non-sovereign commitments by sector ($ billions)
Of all non-sovereign sectors, health experienced the largest percentage increase (106 percent). This trend is driven almost entirely by the IFC, which saw an 82 percent increase in the sector, and ADB-NS, which saw a whopping 15-fold increase. However, as with sovereign-side lending, a low 2019 base means that even with strong percentage increases year-on-year, absolute non-sovereign health commitments across all MDBs did not surpass $1 billion in 2020.
A recent ODI study on health investments by development finance institutions over 2013-2018 found that only 3 percent of investments went to the health sector.[23] The 2020 uptick highlights the potential (and the appetite) for MDB support of private sector investment in health systems going forward. There are a wide variety of opportunities in the health value chain, or the financing chain, where non-sovereign MDB investment could improve health outcomes for those most in need.[24] The private sector plays a central role in diagnostic, vaccine, and therapeutic supply chains. The pandemic has crystallized and intensified interest in greater participation by developing countries in these supply chains, an area where MDB private finance arms are well placed to ramp up efforts. For example, the IFC, which led non-sovereign MDBs with approximately $750 million in health commitments, earlier this year announced a partnership investment that is designed to establish risk-sharing facilities providing up to $300 million in financing for small and medium health-sector enterprises to purchase medical equipment.
Non-sovereign commitments by country income group
2020 saw 10 percent growth for private finance commitments to higher income, non-IDA eligible countries, but a 2 percent decline for IDA-eligible countries (Figure 11). This retreat was a missed opportunity to play a countercyclical role in the private sectors of poorer countries.[25] Importantly, the IFC was an exception to this overall performance. It raised commitments, including trade finance, to IDA-eligible countries by 43 percent, thus continuing, even during the pandemic, its push to focus more of its operations in poorer countries, as promised in its 2018 capital increase agreement (Figure 12). The IFC’s investment in upstream project development appears to have begun yielding returns. But at the same time, IDA-eligible countries still accounted for only one-fifth of IFC commitments in 2020.
Figure 11. Non-sovereign commitments by country income group ($ billions)

Figure 12. Share of non-sovereign commitments to IDA-eligible countries, by MDB

Four policy implications
While the pandemic is ongoing and the MDB response continues, our findings suggest four preliminary implications for MDB policy and strategy (though it is important to recognize significant differences across institutions).
First, collectively and individually (with IDA as an exception), MDBs seem better able to respond rapidly and at scale to a global financial crisis than to a global health crisis. The smaller response on the sovereign lending side seems to be driven by the smaller increase in lending to non-IDA-eligible countries. Much has changed in global capital market conditions for emerging markets (EMs) since the GFC. In weighing whether to borrow from MDBs or markets, governments apparently chose markets in a number of cases. Policy conditionality may have been a deterrent during a crisis of this magnitude.[26] The robust uptake of ADB’s streamlined CPRO, which offered unrestricted budget support, is noteworthy in this regard.
But more broadly, we may be witnessing a structural shift downward in the interest of EMs in untargeted budget borrowing from MDBs. Even before the pandemic, developing countries were mobilizing much larger volumes of external private finance than ever before.[27] During 2020, highly rated emerging markets issued record levels of hard currency sovereign bonds as they sought to expand space for fiscal support and crisis response.[28] It is not clear whether this shift toward market borrowing will persist during the period ahead when global capital market turmoil may increase as monetary conditions in advanced economies tighten. But if it does, MDBs would do well to direct more of their general budget support toward poorer countries that still face barriers to accessing commercial credit (building on the strong IDA performance in 2020). They should also consider allocating more of their non-concessional lending to poorer countries, especially as the terms of even non-concessional MDB lending remain highly attractive for debt-burdened countries. Higher income developing countries may be more interested in borrowing from MDBs for particular kinds of spending—bundled with support for institutional strengthening—which have large positive externalities (e.g., climate finance or pandemic preparedness).
Second, MDBs need to find ways to mount a more vigorous countercyclical surge in financing the private sector during crises, including in poorer countries. The international financial system does not need publicly funded development institutions that do not have the capacity to step up forcefully during periods of high risk in ways that offset the pullback in private finance. MDBs, with their on-the-ground knowledge, public and private client relationships, broad suite of financial instruments and support for policy reform, and patient investors (governments) should be able to manage increased risk and exposure during crises. If not, we need to contemplate fundamental changes in their business models to justify investments of public capital for private finance operations.[29]
Third, despite the 2020 increases, the pandemic is sounding a wake-up call on the urgent need to bolster MDB efforts on health. Given current and future challenges around vaccine distribution[30] and the looming potential for future pandemics,[31] the case for a larger MDB finance effort in the health sector is clear.[32] The World Bank itself has identified primary health care systems as an area of longstanding neglect,[33] with an estimated $200 billion needed per year from 2020 to 2030 in order to ensure basic coverage across 67 of the poorest developing countries.[34] CGD’s Amanda Glassman has made a strong case for investing in future pandemic preparedness with a prominent role for MDBs.[35]
Fourth, as in previous crises, we saw little evidence that the MDBs are any more capable of functioning as a system or acting together in a coordinated fashion and at sufficient scale to confront challenges that by definition require collective action across countries and multilateral institutions. When crises erupt, while G20 and G7 statements typically urge maximum MDB efforts, results are uneven and uncertain as the data reported here show.
It has become increasingly clear that we are missing a critical piece of global architecture for multilateral governance—a body responsible for holding MDBs accountable as a group for efforts that require coordination around, and pursuit of, global goals, ongoing resources and attention (such as pandemic preparedness and combatting climate change), and periodic rapid surge capacity. Such a body must be formed and led by MDB shareholders, with meaningful representation by the most vulnerable countries.[36] Reaching agreement on such a body, its composition, and its functions will no doubt be difficult. But those difficulties must be weighed against the human and planetary costs of failure to do so.
[2] For low and middle-income countries; https://data.worldbank.org/indicator/NY.GDP.PCAP.KD.ZG?locations=XO
[3]For EBRD, due to data limitations, results aggregate (sovereign and non-sovereign) operations. Sovereign MDB arms: International Bank for Reconstruction and Development (IBRD), International Development Association (IDA), Inter-American Development Bank (IADB), African Development Bank (AfDB), African Development Fund (ADF), European Bank for Reconstruction and Development (EBRD) sovereign operations, Asian Development Bank (ADB) sovereign operations. Non-sovereign MDB arms: International Finance Corporation (IFC), IDB Invest, EBRD non-sovereign operations, ADB non-sovereign operations.
[5] All annual figures for all institutions refer to calendar years.
[7] $7.6 billion over 2020-2022.
[8] Common sector list: Agriculture (AGR), Education (EDU), Energy & Extractives (ENE), Financial Sector (FIN), Health (HLT), Industry & Trade/Services (IND), Info & Communication (TMT), Public sector (PSM), Social (SOC), Transportation (TRA), Water/Sanitation/Waste (WTR), Urban development (URB), and Other (OTH).
[13]IDA and IBRD projects often span multiple sectors and subsectors, as seen on its project pages. For this reason, projects across 2019 and 2020 were each manually tagged with a single sector tag from the common sector list, reflective of subsectors with the greatest share of resources. Where this was unclear, CGD staff consulted project documents and made a qualitative assessment of the dominant goal of the project, tagging it accordingly. Accordingly, sector distributions for IDA and IBRD are not precise, but instead reflect relative prioritization across the institutions.
[16] While other income groupings are available, we opted for a consolidated, binary division between: (a) those countries that are eligible to receive concessional IDA financing (including low- and lower-middle-income countries as designated by the World Bank), which we denote “IDA-eligible” and (b) those countries that are not eligible for concessional IDA financing (generally lower- and upper-middle-income countries), which we denote “non-IDA-eligible.”
[17] AfDB and ADF commitments in aggregate (ADF commitment data at the country level was not available).
[21] Ibid.
[22] https://www.centerforfinancialinclusion.org/the-precarious-state-of-msmes-understanding-the-impact-of-covid-19-and-opportunities-to-support-their-recovery
[24] Ibid.
[27] https://www.imf.org/en/Publications/Policy-Papers/Issues/2020/02/05/The-Evolution-of-Public-Debt-Vulnerabilities-In-Lower-Income-Economies-49018
https://ieg.worldbankgroup.org/sites/default/files/Data/Evaluation/files/WBGSupport_PublicFinancialandDebtManagement_IDA.pdf
Topics
CITATION
Lee, Nancy, and Rakan Aboneaaj. 2021. MDB COVID-19 Crisis Response: Where Did the Money Go?. Center for Global Development.DISCLAIMER & PERMISSIONS
CGD's publications reflect the views of the authors, drawing on prior research and experience in their areas of expertise. CGD is a nonpartisan, independent organization and does not take institutional positions. You may use and disseminate CGD's publications under these conditions.
