Recommended
Background
PM-JAY, India’s national health insurance program, is the largest publicly funded health insurance program in the world. It has reformed the way in which the poor and vulnerable access hospital care in India. The size of this program and the inclusion of private providers in delivering care has led to the implementation of a provider case-based payments scheme. Case-based payments are widely used throughout the world as a means of paying both individual and institutional health care providers in a manner that incentivizes efficiency relative to fee-for-service payment or traditional indemnity insurance payment.[1] The original introduction of case-based payments was intended to help control rapidly growing health care costs, resulting from the fee-for-service reimbursement payments that incentivized hospitals to bill for more services. Case-based payment schemes have been found to reduce lengths of stay and lower costs (see, for example, Farrar et al., 2009).
Using the case-based system as a management tool and to set prices requires accurate and complete hospital cost data as well as hospital claims data. While clinical data on patient diagnosis and case definition can be extracted from the established claims system for PM-JAY, the method of collection of hospital cost data has yet to be finalized. The National Health Authority has an opportunity to design and implement a hospital cost accounting methodology and data collection and reporting system that provides important benchmarking data to calibrate hospital case-based payments.
In this note, we examine approaches used to collect cost data for informing case-based payments to document the strengths and weaknesses and identify lessons for PM-JAY. We will use the example of data collection for the base rate and severity weights for Diagnosis-Related Group (DRG) provider payment schemes, in five selected case study countries, because these are tested approaches that have similar data needs to the system in India. We first define the term case-based payment and identify the basic cost data needs for such a system. We then develop a framework to assess both the cost data collection process and how cost data is integrated into the price setting process. The cost data collection is assessed by identifying the types of data, the costing methodology followed, and the normative framework for the data collection (the legal framework, presence of guidance instruments like guidelines and quality assurance systems). To assess how cost data is integrated into price setting, the framework explores both the methodological approach of generating the prices, the institutional mechanisms established for finalizing reimbursement rates and, finally, explores the capacity building and sustaining mechanisms (human resource and technical) available to support the generation of evidence.
What are case-based payments?
Under case-based payments, providers are reimbursed at a predetermined rate for treatment and the provider is paid based on diagnosis and prognosis rather what is actually spent on caring for the patient. In such a setting, the hospital “product” for which hospitals are reimbursed is the “average” cost of care of a patient from admission to completion of treatment, rather than the detailed line-item services (drugs, tests, consultations, overnight charges, etc.) provided. Case-based payment schemes require a system for grouping and organizing cases linked to cost and severity of disease. In India, PM-JAY has created its own grouping system with a list of cases known as Health Benefit Packages (HBPs). The grouping scheme and associated reimbursement rates were developed through a process of expert review, consultation, and review of pre-existing insurance schemes. However, PM-JAY is now looking towards classifying these in line with the World Health Organization (WHO) International Classification of Disease (ICD) terminology, with a view to possibly introducing a Diagnosis-Related Group (DRG)-based scheme.
The DRG is the most well-used system for defining cases, and there are numerous variations, including MS-DRG (Medicare Severity DRG), APR-DRG (All patient refined DRGs), AR-DRG (Australian), Thai-DRG, and others. In a DRG system, cases are grouped according to both clinical and economic criteria to allow for meaningful management of hospital performance and patient load. A patient’s hospital admission is assigned to a single Diagnosis-Related Group and reimbursement is determined by the cost weights linked to average treatment costs. The case-based payment methodology for DRGs uses a specific algorithm or formula for assigning the diagnoses into a given group. Thus, the tens and thousands of diseases and conditions as defined by the WHO ICD are distributed across the Diagnosis-Related Groups.
There are a variety of case-based payment methodologies. They originated in the United States in the 1980s and were typically designed and developed at a university in partnership with a hospital or clinical setting. After the methodology or “grouper” was designed and developed, payers adopted it. The creation of the groups—the number of which varies from system to system and can range from around 400 (US) to 700 (Australia)—is thus a grouping of individual disease codes as a mechanism to reduce the complexity in payment for tens and thousands of different diseases. Furthermore, countries vary in their national adaptations or implementations of the WHO ICD terminology and the potential incorporation of procedural code terminologies as part of the payment methodology, which are all dependent on national health informatics terminology and vocabulary standards (such as CPT4, HCPCS, ICD10-PCS, ICD10-CM, etc.). The ways in which the groups, as well as the algorithm for placing a visit into a group, have been created uses expert clinical experiences on patient resource use.
What are the cost data needs for price setting under case-based payment?
Under a case-based payment methodology, each case is assigned a price at which the provider is reimbursed or paid. In principle the price-setting process is based on evidence on the resource use for that group. However, consultation with key stakeholders also plays an important role in setting the reimbursement rates for each group. Other factors can also be taken into consideration, such as the location of the facility, the type of facility (e.g., a teaching versus non-teaching hospital), and quality of care.
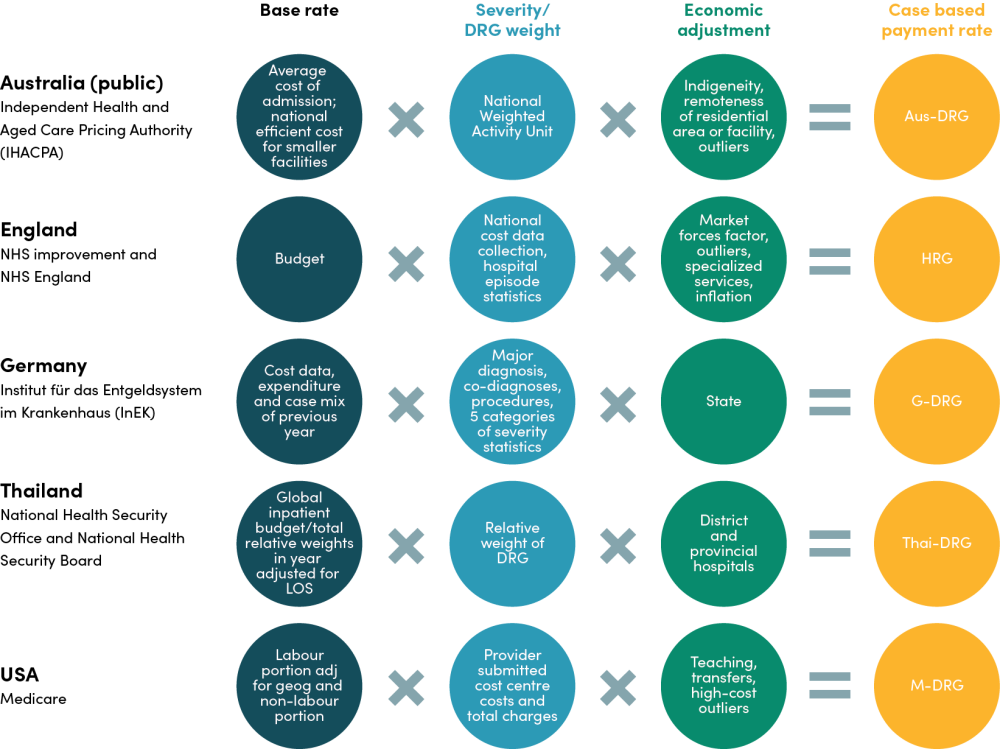
The reimbursement for each case is founded on a base rate which generally reflects the strategy of the system e.g., a monetary value that reflects the average cost per discharge or the average budget per discharge. This requires representative data on the average cost per case treated, across all cases. The base rate can further be adjusted to reflect budgetary constraints or geographical differences in health service delivery. These weights require information on the budget constraint when set against predicted case load as well as local evidence on the cost of care. To calculate the reimbursement rate for different case-based payments/DRGs, severity weights are applied to the base rate that reflect the relative value of the resources used for the respective grouping. Severity weights are usually based on resource use e.g. length of stay or consumables/medicines consumed. Further, geographical, facility or quality adjustments and in some case weights for outlier cases are also applied (see Figure 1). These latter weights can be based on data and evidence relating to the factor driving the cost heterogeneity.
Figure 1. Factors considered in a case-based payment rate calculation

The case studies
The case studies selected are from countries with different health system characteristics and goals. They include four high-income country schemes (from Australia, England, Germany, and the US) and one middle-income country scheme (the Universal Health Coverage Scheme (UCS) in Thailand). Each has its own DRG payment scheme and established system for collecting cost information. Australia, Thailand, and England are all systems with universal health care coverage derived from citizenship and residency status, although Thailand manages UHC through three funds, membership in which depends on employment status. In Germany coverage of health care is universal while type of coverage is linked to employment status. In the US, Medicare is a federally financed body that finances and administers coverage for the elderly (older than 65 years), some younger people with disabilities, and people with End-Stage Renal Disease. Health care expenditure per capita (in 2019) ranged from less than 300 US$ in Thailand to over 10,000 US$ in the US as compared with less than 70 US$ in India (see figure 2). As case studies, England provides an example of universal systems with centralized costing and payment schemes. The US, Germany and Australia operate different forms of decentralized systems each with different methods of involving the sub-national level (states) in the payment schemes and providing potential lessons for India’s state led health system. Similarly, the importance of the private sector in both the US and Australia has lessons for how to involve the significant Indian private sector in a national cost system. In Thailand, a small DRG development team (Thai CaseMix Centre (TCMC)) provides data for three funds to manage within the budget of each fund and as a middle-income country, Thailand can provide lessons on the development of a cost system where resources and the data infrastructure available to high-income countries are more limited than in a high-income country setting.
Figure 2.Current health expenditure per capita (current US$) - United States, Germany, United Kingdom, Thailand, India, Australia
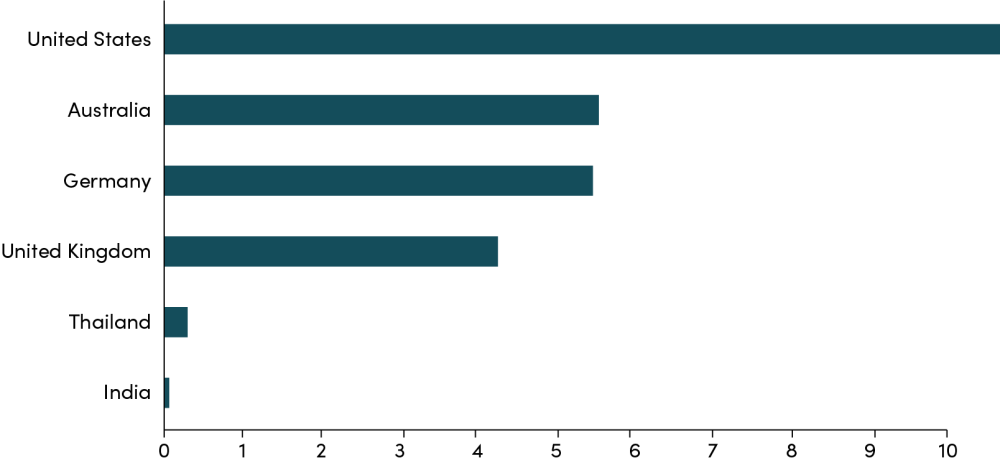
World Health Organization Global Health Expenditure database (apps.who.int/nha/database ). The data was retrieved on January 30, 2022.
Cost data collection
In the countries explored, cost data collection can be split into two areas: first, data that describes the resource use of each DRG (e.g., case load, length of stay, utilization) and second, cost accounting data that informs the overall base rate. The regulatory requirements and methods of data collection vary between these two data groups. In addition, the variations in data requirements for each country are shaped by two factors: the respective methods for calculating the base and severity weights, and the ability of the information systems in country to generate data.
Case mix and resource use data
Whether full hospital costs are submitted or not, all payers in all countries require participating providers to submit data on case mix and resource use associated with each patient (see table 1). In Australia, this submission of claims data is a requirement for both private and public facilities and includes DRG case type, length of stay, and demographic data as well as any charges and benefits paid to the patient for all patients. A similar set of data is required in the UK but also included are attendances, bed days, and tests carried out. In Germany, providers submit data on diagnosis, clinical interventions, characteristics, and cause of admission. In all three countries, the case mix and resource use data are used in combination with the cost accounting data (see below) to generate national reference costs that are used to inform the reimbursement rate.
In the US, all hospitals participating in Original Medicare are required to submit claims data as well as annual cost reports. Similarly, in Thailand, hospitals are required to submit claims data including clinical diagnoses based on ICD10, co-morbidities/complications, procedure coding, length of stay, and discharge status. The ICD10 classification is linked to the Thai DRG grouping system. Reported data are used to update the base rate, as well as the other adjustments for severity and geographic or other hospital characteristics, for the case-based payment rate.
Table 1. Resource use and cost data collection in the national cost system in the case study countries
|
Australia public |
Australia private |
England |
Germany |
Thailand |
USA |
|
|---|---|---|---|---|---|---|
|
Types of data collected |
DRG case type, benefits paid, charges, LOS and demographic data |
All providers: DRG case type, benefits paid, charges, LOS and demographic data |
Number of attendances, bed days, episodes, tests, etc; hospital episode statistics (HES) |
All providers: Patient-level data on diagnosis, clinical interventions, characteristics, cause of admission |
Clinical diagnosis based on ICD10, co-morbidities/ complications, procedure coding, length of stay, and discharge type and hospital resource use (as charges) |
Facility characteristics, utilization/ claims data |
|
Cost data collected |
Hospital cost data |
Voluntary submission: hospital cost data |
Hospital cost data e.g. equip-ment expenditure, staff etc |
Voluntary: Cost data, such as workforce, resources and pharmaceuticals |
Charge/claims data |
Cost and charges by cost center (in total and for Medicare), Medicare settlement data, and financial statement data |
|
Sample size (cost data) |
All |
91/630 |
232 |
300 |
Charge data (all hospitals). Annual cost report (all public hospitals) |
All Medicare providers |
|
Percentage of all hospitals |
100% |
14% |
100% |
20% |
- |
100% |
|
Annual cost data collection |
✓ |
✓ |
✓ |
✓ |
✓ |
✓ |
|
Costing method |
Micro/ Patient level cost data collection |
|
Micro/Patient level (PLICS) costing using NHS approved costing guidance |
Bottom up; micro costing (actual resource use) |
Annual cost report—gross costing; Newly e-Cost project— patient level e-HMIS |
Aggregated; 63% RCC labor costs; 68% patient-spe-cific acquisi-tion costs for supplies, drugs and implants |
|
Patient level costing |
✓ |
✓ |
✓ |
✓ |
✓ |
Partial (some patient level, some not) |
|
Capital/ overhead costs |
Allocation methodology described by costing guidance |
|
Direct allocation method; indirect via weighting stats |
Stepdown allocation |
In e-Cost project–simultaneous equation allocation |
|
|
Quality assurance |
Submitted data subject to algorithmic trouble shooting; verification of financial viability through comparisons with aggregate data. |
Formal audit required by all providers (internal & external) including evidence on costing processes; Data quality checks |
Complex methods with algorithmic troubleshooting, external controls and 3 steps of verification of the medical and financial reliability of the data. |
Charge data for recalibration–trimming for low- and high-outliers |
Submitted data subject to external compliance of accounts audits |
|
Key sources: Barber et al. (2019); OECD (2019); SS Tan et al. (2014); https://www.england.nhs.uk/pay-syst/national-tariff/; https://www.ihpa.gov.au; cms.gov
Cost accounting data collection
Cost accounting is the process of estimating and classifying costs incurred by an organization. In health care organizations, cost accounting is used to determine the cost of each service or product used in patient care, providing detailed information that can be used for analytics and decision-making. Depending on the processes in place, these data can be collected using different methodologies, in various levels of detail, with different sampling approaches and encompassing different sets of costs.
Costing methods
Full absorption costing includes the cost of all activities and processes of the facility, therefore accounting for overheads, administrative and financing costs that might be incurred. This contrasts with costing approaches that may only include the direct medical costs such as human resources, medical equipment and consumables, and pharmaceuticals, which necessarily are an underestimate of the cost of service delivery. In addition, methods of costing fall into two major categories: gross/top-down methodologies and micro/bottom-up approaches. Micro costing involves the tracking and recording of individual patient resource use and costs while bottom-up costing ensures that all ingredients required to deliver a service are counted and included in the costs. Alternatively, gross costing involves the allocation of the hospital/department-level costs to sub-levels/departments or even to individual patients. Standard allocation methodologies such as human resource time or floor space are used to carry out the allocations to derive the allocated costs, although proxies for these can also be used where data systems are weak. In practice, it is common for hospitals to use a mix of gross and micro costing when costing different inputs. As micro costing is resource intensive but tends to be more accurate than gross costing, hospitals are only likely to invest in micro costing for those inputs that make up a greater portion of their budgets, e.g., drugs and human resources.
National costing methods in the case study countries all require full absorption costing that include full hospital costs. Even in the US, where Medicare is only one of a number of payers, providers are required to submit cost data (the “Medicare cost report”) in total and for Medicare. In Australia and the UK, public hospitals submit full absorption cost accounts. In these two countries, with advanced cost systems, national-level cost accounting systems generate patient-level data and use micro costing in the costing for reimbursement decisions. This is possible because granular data on direct costs including human resources are more readily available and a required part of the costing exercise (e.g., Australia, UK). However, all countries use top-down allocation for some or all of their costs albeit using different allocation methodologies (see Table 1).
In the US, the method of cost estimation within the provider depends on the provider’s own system for generating cost information. The most common method for generating cost information in the US is to use traditional allocation methods to distribute costs among clinical departments and then apply a cost-to-charge ratio to estimate the individual service cost. However, this method is known to be problematic[2] as it leaves the system vulnerable to strategic price setting by the providers. As a result, there is now a push from some players to move to cost accounting to generate individual service costs as a means to move to a value-based care model but this has not been universally taken up.
Sampling and frequency
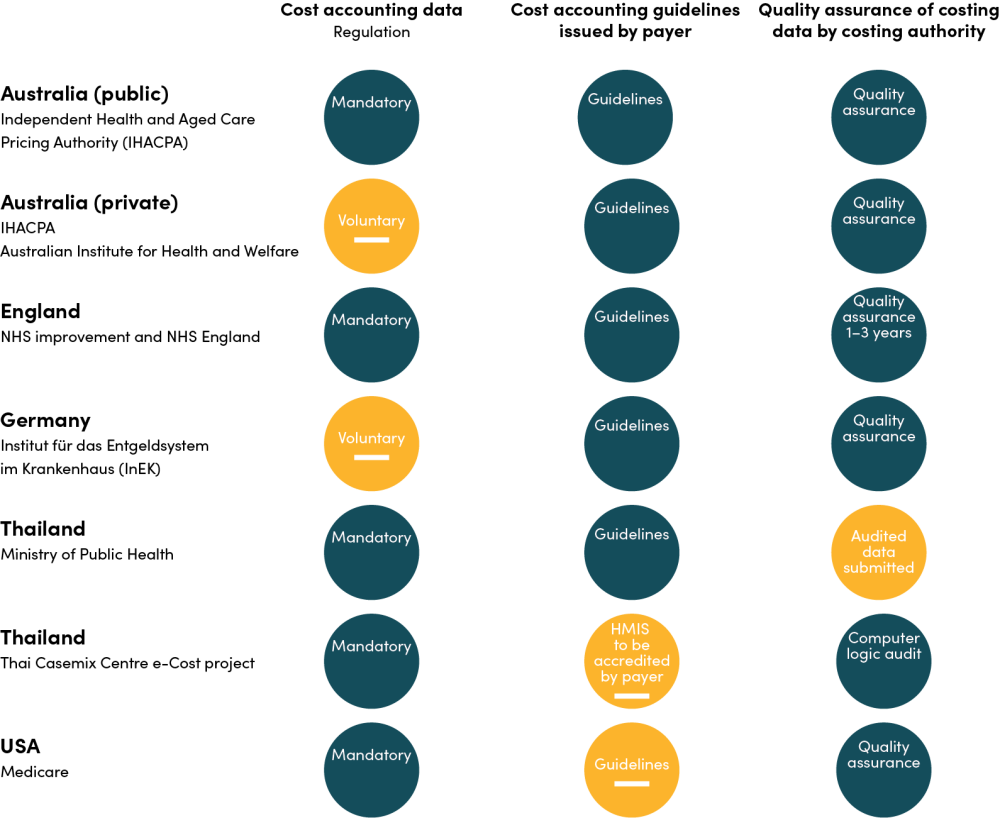
The hospital sample for national costing exercises should be as representative as possible to generate an acceptable cost figure. Many high-income countries—including England, US (Medicare), and Australia (public providers)—therefore require submission of cost data by all participating providers of care— a census-based approach—on an annual basis (Figure 3). The exception in our case studies is Germany, where participation in the annual costing exercise is voluntary. The voluntary scheme means that only a limited number of hospitals are represented. In Australia, only public providers are required to submit cost data to inform the national reference price. Average costs and the resulting payment rates can therefore be skewed towards the costs of these submitting providers. However, the cost data may well be available at the non-participating providers that might choose to use fully absorption costing internally in order to help manage their pricing structures and costs. Thailand is the only case study country where full costing is not carried out on an annual basis. In Thailand, the three insurance funds do not acquire mandatory cost data from participating hospitals but rely on the system of annual cost surveys limited to public hospitals of Ministry of Public Health to inform the base rates of the National Health Security Office. Thailand is also the only case study country where charge data have been extensively used for recalibration and rebasing. This most likely reflects the expense of carrying out such an exercise and the need to sensitize and encourage providers to participate in a costly exercise that requires sharing data that might be sensitive. However, full electronic annual hospital costing has just been initiated by the TCMC.
Quality assurance
For those schemes in which cost data are submitted, costing guidelines facilitate the generation of good quality data as well as comparison and consolidation of these data (Australia, Germany, England) (see Figure 3). The costing guidance forms part of the mandatory costing submission in Australia and England. All three systems also have complex methods of quality assurance provided through a system of internal and external audits and data quality checks using algorithmic troubleshooting. In the US, Medicare does not use costing guidelines beyond requesting costs each year by specified cost centers, but data quality is underpinned by regulatory requirements for auditing and also reviewed by the relevant costing authority.
Figure 3. Costing methods used in the national cost data collection in the case studies
Integration of cost data into setting reimbursement rates
Each country integrates cost data into the price setting process in different ways (see figure 4). In Australia, Germany, and England, the national costing exercise underpins the rates under the activity-based funding models for hospital reimbursement. Hospital costing is viewed as essential for understanding the total costs involved in treating a patient including the services or products used. Australia, England, and Thailand also use the overall budget of the scheme as a key element in setting the base rate as the budget constraint. In these settings, the budget becomes a key driver of costs as providers are conscious of staying within the budget constraint. At the same time, if these constraints are too limited, and without adequate regulation, there is potential for providers to compromise on quality. To produce the cost base, estimated costs produced by the costing system are scaled to the budget so that, for example, Thailand’s base rate takes account of both the budget and the expected case load in the coming year. In the US and Germany these budgetary control mechanisms are not incorporated in the same way. In Germany the base rate is set based on a combination of the cost data, expenditures, and case mix from the previous year so that the budget is essentially driven by historical expenditure data. In some US states (e.g., Maryland and Massachusetts) a limit on total state-level health care expenditure has been incorporated into the reimbursement rate setting process in an attempt to control costs.
In the decentralized systems of the US, Australia, and Germany, state-level factors are also incorporated into a state-level base rate to ensure that the rate is both appropriate and acceptable to each setting. In Germany, state-level base rates are set by adjusting the national rate within nationally set boundaries. In Australia, each state works with a different base rate based on the annually set National Efficient Price and National Weighted Activity Units adjusted for state-level volume and distribution of services.[3] In the US, the base rate for Medicare is also adjusted according to the setting, using geographical weights. These geographical weights are applied to the labor portion of the base rate which is then combined with the unadjusted non-labor portion of costs. The calculation methods for the geographical weights in the US are likely to vary by state (e.g. the incorporation of the total health care expenditure cap in Maryland and Massachusetts).
In all case studies, a DRG case and severity weight is applied to the base rate. These relative weights remain the same regardless of the base rate and are based on routine clinical data such as age, sex, length of stay, and admission weights for neonates.[4] In Australia, England, Germany, and Thailand, these weights are derived using the case mix and resource use data combined with cost data. In Australia the weight is known as the National Weighted Activity Unit, calculated as part of the IHACPA costing exercise. In the UK this is known as the National Tariff. In the US, DRG weights are reviewed on an annual basis and revised weights are calculated, where needed, based on diagnosis data, cost center costs, and total charges for each cost center.
Additional weighting of the DRG payment rates incorporate indigeneity of the population (Australia), remoteness (Australia), outliers (Australia, Thailand, Germany, England, US), market forces factor/geography (England), socio-economic status of the patient (US), best practice (England), inflation (England, Germany), type of facility (Thailand, US) and transfers (Australia, US). See figure 4.
Figure 4. How cost information informs the reimbursement rate in the case study countries
Institutional set up
Barber et al. (2019) have identified five key characteristics of successful systems for health care price setting: political independence, formal systems of communication with stakeholders, credibility in the eyes of the public, freedom from conflicts of interest, and political standing to resist both industry capture and political pressures. However, securing political independence has to be balanced with ensuring links are made between the different parts of the system and facilitating the alignment between the payment scheme and strategic objectives of the government scheme. Table 2 summarizes the institutional frameworks for costing in each country.
Table 2. Institutional features of the costing systems in the case study countries
| Country | Status of costing body | Responsibilities | Resources and funding | Stakeholder consultation | Transparency |
|---|---|---|---|---|---|
|
Australia: Independent Health & Aged Care Pricing Authority (IHACPA) |
Independent |
Activity based costing, classification system, data collection, calculating costs |
IHPA’s total expenses were AUS $32.5 million (US$ 21.7 million) in 2021/22 plus 58 seconded staff from Ministry of Health between 2008 and 2011, AUS$133 million provided to set up the clinical costing system |
Pricing framework released for public consultation each year in addition to stakeholder involvement as part of working groups/ committees to guide the work of IHACPA |
Costing and price information is in the public domain |
|
England: NHS improvement & NHS England |
Under responsibility of government ministry |
Production of NHS cost schedule and calculating prices from cost data collected including the National Tariffs and Best Practice Tariffs |
75 staff (in the pricing teams) |
Public consultation on pricing methodology with internal stakeholders and clinical community contributing to review of the methodology and relative (severity) weights |
All costing and price information is in the public domain |
|
Germany: Institut für das Entgeldsystem im Krankenhaus (lnEK) |
Independent— supported by the Federal association of Sickness Funds, Association of Private Health Insurance and German Hospital Federation |
Develop Case Fee Catalogue, collate and analyse hospital cost data |
In 2017, the INEK’s estimated budget was EUR 8.2 million (US$7.3 million). I50 staff Participating hospitals receive a fixed fee |
State level adjustments to base rate within predefined range; Federal association of Sickness Funds, Association of Private Health Insurance and German Hospital Federation approve the rates and methodologies |
n/k |
|
Thailand: Thai CaseMix Centre |
Autonomous policy body of the Health Systems Research Institute |
Updating newer versions of DRG, researching e-Cost project |
Self-financing project with 8 full- time personnel |
Public consultation with public and private hospitals, 3 payer schemes, ministry of public health |
Public access system to information is developing |
|
USA: Centers for Medicare and Medicaid (CMS) and MedPAC |
CMS is under responsibility of the federal government Department of Health and Human Services. MedPAC is an independent Congressional Agency |
Develop and update cost- based pricing model |
n/k |
Payment policy is reviewed by MedPAC and recommendations are made to Congress annually. Congress updates the prices on an annual basis |
From Jan 2021 all hospitals required to provide clear accessible pricing information to CMS and make this available to consumers Summary statistics on use and payments also available online |
Key sources: Barber et al. (2019); OECD (2019); SS Tan et al. (2014); https://www.england.nhs.uk/pay-syst/national-tariff/ ; https://www.ihpa.gov.au/ https://www.ihacpa.gov.au/sites/default/files/2022-11/IHPA%20Annual%20Report%202021-22.PDF; IHPA “2022-23 Portfolio Budget Statements”; cms.gov
In our case studies, England, Thailand, and the US have retained the process of calculating proposed rates under the responsibility of government bodies, maintaining close integration with the broader health system. In England, NHS Improvement and NHS England are responsible for the production of the NHS cost schedule through the collection of cost data according to centrally developed guidelines combined with hospital episode statistics. Thailand’s NHSO has a subcommittee on financing that is responsible for proposing the capitation budget based on their analysis of unit costs, case mix, and utilization, while the other two funds manage payment policies on their own contexts. The Centers for Medicare and Medicaid (CMS)—who collect and review the cost data in the US—sit under the federal Department for Health and Human Services. Part of their remit is to develop and update the cost-based reimbursement model, which Congress then reviews. An important part of the US process, however, involves the independent body, Medicare Payment Advisory Commission (MedPAC), which makes the recommendations to Congress.
Two of the case studies, Australia and Germany, employ independent bodies to perform a similar function to England’s NHS Improvement in relation to the cost data collection and calculation of the proposed rates and price weights, while retaining some autonomy from the governing institution.
Stakeholder engagement can be seen in all the case studies. In England and Australia, the methodologies for pricing are subject to public consultation as well as to the involvement of stakeholders as part of working groups and committees who guide the work. In England, the clinical community is involved in reviewing the relative weights. Similarly, in Thailand, the TCMC is a small unit responsible for updating the DRG and relative weights, and its consults with Thailand’s Ministry of Finance, Bureau of Budget as well as with technical experts and provider representatives to determine the final rates and methods used. In Germany, the Federal Association of Sickness Funds, the Association of Private Health Insurance, and German Hospital Federation are responsible for approving the rates and the methodologies followed. At the state level, negotiations take place between the hospital association and the insurers’ associations. At both levels, disputes go to an arbitration board. Finally in the US, an independent organization (MedPAC) has a statutory responsibility to review the payment policy, including the annual rate revisions, and makes recommendations to Congress on an annual basis.
Stakeholder engagement and the autonomy of the IHAPCA and LnEK add to the credibility of the system, as does transparency in costing and price information. Transparency plays an important role in three of our case studies—England, Australia, and the US. In England and Australia, all costing and price information is in the public domain. In the US, summary statistics are also available online, and from January 2021, all participating providers are required to provide clear and accessible pricing information to consumers and, in machine readable format, to CMS. This facilitates credibility in the price-setting process.
Lessons learned for India
Cost data requirements for setting reimbursement rates
Historically, PM-JAY’s reimbursement rates are set for each individual health service package. The rates have been based on a combination of the rates from pre-existing schemes, consultation with experts, and unit costs taken from a one-off national costing study. The prices have undergone three rounds of review since the launch of PM-JAY. Reform to the grouper is now being explored, for example a move to a DRG system, aiming to address concerns around the rate-setting process and to help align incentives with health system goals. The DRG grouper follows international best practice, but additional work will be needed to explicitly identify and describe the advantages over India’s specific packages approach, which is more granular in its classifications.
Whether India follows a DRG approach or continues with the specific health services packages, the reimbursement rates will need to take into account the average cost of delivering the different packages or groupings of services to ensure that the providers are adequately reimbursed. This means data collection systems are required to collate data on case load, case mix, and average costs for both PM-JAY-related care as well as all care delivered by the respective provider (including patients paying out of pocket and through private insurance).
Historic case load and case mix data are readily available from the PM-JAY transaction management system and could be used to help predict budgetary impacts and provide a potential source of resource use data. Average costs of the HBPs have been collated in a one-off costing study known as the CHSI (Costing of Health Services in India) study, funded by the Department of Health Research and carried out by an independent academic institution. However, such studies are costly and can be limited in their sample size and therefore their representativeness across different states and provider types. A routine cost data collection system will better meet the demands of an evidence-based system of setting reimbursement rates.
Mechanisms for sustainable cost data collection
Moving forward, PM-JAY will need a sustainable system for the ongoing collection of cost information from providers including both PM-JAY and non-PM-JAY costs of care. There is a need to identify a strategy to collect these data from a sufficiently representative sample in a systematic and standardized way that engages and is considered credible by stakeholders. Furthermore, the system will need to address fundamental challenges of acceptability within the provider community and the problem of heterogeneity in providers and costs of hospital care in India. There are several areas through which this can be achieved:
Mandatory cost data collection: To ensure cost data capture the full heterogeneity of service provision, the cost data collection will require a large sample of PM-JAY providers. Germany’s approach to using a voluntary mechanism has led to a relatively small sample of costs and data that is likely skewed to those willing and able to participate. For this reason, and the variety of providers involved, PM-JAY should look to introduce a mandatory mechanism for all PM-JAY providers that could, for example, be linked to the accreditation scheme of the National Accreditation Board for Hospitals and Healthcare (NABH) and potentially some form of financial incentive. The example of the US shows how mandating private providers to submit such information is feasible, if not at the most granular levels. The example of Australia suggests that requirements may need to vary between public and private providers.
Autonomous costing institute: Institutional arrangements in the majority of case study countries involve an autonomous or semi-autonomous body responsible for the collection and analysis of data, and in some cases, calculations of proposed rates. These organizations require the legitimacy conferred on by them by the government. The Health Financing and Technology Assessment (HeFTA) unit in India’s National Health Authority, established in 2022 with a remit to ensure best value for PM-JAY, including developing evidence for price-setting of HBPs, would be a natural home for such a body. Establishing a separate institution staffed by experts, and possibly hosted by an academic institution, that would be accountable to a wider range of stakeholders across government and other health care payers would be an alternative. As Barber et al. note, submitting cost data to an autonomous central authority for analysis is one way of addressing the problem of trust and willingness to share data between the public and private sectors given the sensitivity of cost information and its links to revenue generation.. Whether autonomous or within government, the centers responsible for costing are well resourced and staffed—reflecting the expertise and system investments needed to install a costing system. While any future developments in this area in India will need to be adequately resourced, there are potentials for economies of scale if this body is set up centrally, such as in Germany and Thailand, and provides cost information for other public health insurance schemes as well besides NHA, like the Central Government Health Scheme (CGHS), Employees State Insurance Scheme, and other State health insurance schemes.
Building capacity: Capacity for cost accounting even as an internal management tool is relatively weak in the Indian health sector and varies across different types of providers. While billing information, financial reports, and patient load data are all likely to be available, compiling these data to generate costs across the appropriate cost centers will require some capacity building. Standardized costing templates that integrate well with existing HMIS and billing structures and are flexible enough to meet the needs of different types of providers would be a helpful tool. In addition, training on cost accounting methods and how the information will and can be used will be needed. Training will support the collection of cost data as well as help build confidence in the system.
Establishing provider confidence: Provider confidence in the cost system will be needed to obtain full costing data that is robust and of good quality. Implementation through an autonomous institute and capacity building will facilitate this. A further key element will be involving all stakeholders in the process of developing the cost system and ensuring there is transparency in the way cost information is used and prices are set. Financial resources may also be required to support providers in setting up the systems to generate and submit the data.
Appropriate methodologies for cost data collection: Appropriate methods of routine data collection for the Indian context that can accommodate a range of provider types from large well-resourced networked hospitals to small, family run facilities will also need to be identified.
- Gross or micro costing: While micro costing generates more accurate information and necessary information for calibration, gross costing is cheaper, less complex, and less intrusive. Providers are unlikely to want to share information at a level of detail that reveals negotiated prices for the inputs to patient care such as pharmaceuticals and implants. Further services such as diagnostics and the inpatient stay that include overheads and the salaries of employed staff will require data collection on the total cost of service provision, not only the PM-JAY related services, as well as key data on patient load and case mix to inform those allocations. To address these sensitivities, as well as possible capacity limitations, NHA could set minimum standards for cost data submission that allow for gross costs by cost center (as per the US) as well as patient load data that will allow step down allocation of costs. This would avoid the need to divulge sensitive information. However, as better cost accounting (and its use as a management tool) can lead to improved decision-making and efficiency, providers could be encouraged to use and submit cost accounts at a more granular level through incentivization.
- Resource use and case mix data: Data for condition-specific weights could be derived from existing methods of billing for individuals or insurance agencies which document the different treatments provided to patients. These data are increasingly digitized at all levels of the hospital sector, including the smaller, less well-resourced facilities, and can be used to document resource use related to variable costs such as pharmaceuticals, medical consumables, and specific technologies such as implants. The NHA is already working on a pilot scheme to collect these data from empaneled providers.
- Data submission systems: For all cost data, resource use, case mix, and patient load data, the NHA should develop standardized templates that are simple to use and do not add significantly to data management costs for the facilities. PM-JAY has the opportunity for a technological leapfrog to implement digital systems for simplifying the collating of cost data and integrating this information into the rate-setting process. Integrating cost information requirements into platforms being built by the National Digital Health Mission such as the ABMJAY HMIS could simplify the process of data collection and build sustainable digital costing information systems that bridge the capacity gap and future proof the system. Cost data collection could then become a routinized process built into the PM-JAY digital infrastructure.
Adaptation to the states: To ensure comparability and avoid duplication of efforts, and for ease of regulation and quality assurance, systems of data collection should be developed that are consistent across the states. However, due to the varied nature of health care provision and costs of care across the states, analysis of costs should be carried out at the state as well as the national level. Similar to the case study countries, India could use a national base rate generated from the cost data collection and weight this to reflect state settings, e.g., volume of services such as in Australia, or a state budget constraint, such as in Massachusetts.
Ensuring quality and validity of the data: Quality assurance for costing can be complex and needs to be designed and put in place. Data checks need to be done at the central level with a systematic process of review; internal and external auditing at the provider level is also important and supports the credibility of costing work. Developing artificial intelligence (AI) systems to help with quality assurance will be an important component of this activity.
Conclusions
Attention should be paid to establishing sustainable national health care costing systems as an intrinsic part of the evidence base for health care decision-making. Building a reliable costing system that generates valid data requires identifying data needs, designing sustainable cost data collection mechanisms that take into account current capacity and existing provider-payer relations, and creating institutional mechanisms that allow for a strong transparent partnership between payers and providers.
Key references
Reports/journals
Barber SL, Lorenzoni L, Ong P. Price Setting and Price Regulation in Health Care. OECD 2019. doi:10.1787/ed3c16ff-en (Case study reports)
Barber SL, Lorenzoni L, Ong P. Institutions for health care price setting and regulation: A comparative review of eight settings. International Journal of Health Planning and Management. (2019)
Busse R, Geissler A, Quentin W, Wiley M “Diagnosis-Related Groups in Europe Moving towards transparency, efficiency and quality in hospitals”. World Health Organisation 2011. https://www.euro.who.int/__data/assets/pdf_file/0004/162265/e96538.pdf
Carroll N, Lord JC. The Growing Importance of Cost Accounting for Hospitals. J Health Care Finance. 2016 Fall;43(2):172-185. PMID: 31839701; PMCID: PMC6910125.
Farrar S, Yi D, Sutton M, Chalkley M, Sussex J, Scott A et al. Has payment by results affected the way that English hospitals provide care? Difference-in-differences analysis. BMJ 2009; 339 :b3047 doi:10.1136/bmj.b3047
Health Financing and Management Association. Costing healthcare in Germany Report of a meeting between INEK, the HFMA and Monitor. (2015)
Raulinajtys-Grzybek M. Cost accounting models used for price-setting of health services: an international review. Health Policy. 2014 Dec;118(3):341-53.
Marc J. Roberts, William Hsiao, Peter Berman, Michael R. Reich Getting health reform right: a guide to improving performance and equity. Oxford University Press. 2004. p. 332 ISBN: 0 19 516232 3.
Siok Swan Tan, Alexander Geissler, Lisbeth Serdén, Mona Heurgren, B. Martin van Ineveld, W. Ken Redekop, Leona Hakkaart-van Roijen, on behalf of the EuroDRG group, DRG systems in Europe: variations in cost accounting systems among 12 countries, European Journal of Public Health, Volume 24, Issue 6, December 2014, Pages 1023–1028
Web-based resources:
UK: https://www.england.nhs.uk/pay-syst/national-tariff/
Australia: https://www.ihpa.gov.au/
US:
- cms.gov
- https://data.cms.gov/provider-compliance/cost-report/hospital-provider-cost-report
- https://www.cms.gov/Medicare/Medicare-Fee-for-Service-Payment/AcuteInpatientPPS/MS-DRG-Classifications-and-Software
Acknowledgements
We would like to thank Victoria Fan, Center for Global Development; Lama El-Chaar, University of New South Wales; Supasit Pannarunothai, Centre for Health Equity Monitoring Foundation; Jonathan Cylus, London School of Economics; and Shankar Prinja, Postgraduate Institute of Medical Education and Research, Chandigarh, for their invaluable reviews and suggestions.
[1] In the continuum of hospital payment methodologies, case-based payments and fee-for-service payments are just two forms of hospital payment. There are other forms of payment beyond the scope of this note, such as per diem payment (i.e. payment for each hospital day), global budget (i.e. bulk hospital budget set for a given time period), capitated payments (i.e., payments made to hospitals based on the total number of assigned patients in a given region), and pay-for-performance (i.e., payments linked to performance or quality metrics separate from service quantity). Each payment methodology has different pros and cons in terms of who bears the financial risk for a patient’s condition, as well as the incentives for quality and quantity of care as well as cost inflation (see Roberts et al. 2004, Getting Health Reform Right for further details).
[2] The cost-to-charge ratio is the ratio of total hospital costs to total billed charges. To obtain the total cost of a cost center or procedure, the billed amount is multiplied by the cost-to-charge ratio. However, as total billed charges are the total amount that a provider has claimed from all payers, they are based on strategic decisions around revenue maximization. This means the cost-to-charge ratio is unlikely to generate estimates that reflect the true cost of service delivery.
Topics
CITATION
Guinness, Lorna, Srobana Ghosh, Grace Achungura, Javier Guzman, and Abha Mehndiratta. 2023. Generating and Using Cost Evidence to Inform Provider Payment Rates: Lessons from High-Income Countries for India’s National Health Insurance Program . Center for Global Development.DISCLAIMER & PERMISSIONS
CGD's publications reflect the views of the authors, drawing on prior research and experience in their areas of expertise. CGD is a nonpartisan, independent organization and does not take institutional positions. You may use and disseminate CGD's publications under these conditions.