Recommended
Blog Post
The Great Indian Poverty Debate, 2.0
India has had a long and (mostly) distinguished record in monitoring poverty, based on the National Sample Surveys (NSS), done by the government of India’s National Sample Survey Organization (NSSO). (The surveys have had many applications, but here the focus is on measuring poverty.) Prior to the early 1990s, researchers had to rely on NSSO’s published tabulations from the surveys. This changed when the micro data became publically available. There have been debates about how poverty should be measured using the NSS, and how the results should be interpreted. But these debates were at least well-informed, given public access to the data and an active research community within and outside India’s borders.
That changed with the 75th NSS round for 2017-18, which the government chose not to release to the public in any form. (A press release from the Ministry of Statistics pointed to concerns about the quality of the data, though with few details.) The prior round of the large sample (five-yearly) surveys that have been most relied upon in measuring poverty was 2011-12. That means that it is now over ten years since we have been able to update the estimates of poverty in the country that has historically held more of the absolute poor than any other (judged by a global poverty line that aims to have constant purchasing power across countries). In the World Bank’s much-used interactive PovcalNet website, this became a gaping hole in the global picture of poverty. (You can see the hole here; notice how the South Asia rows for recent years are labelled “Survey coverage is too low”; that is entirely due to the missing NSS data for India.)
There were some efforts to figure out what the missing survey data would have told us about how India’s poor were doing. Some observers argued that the poverty rate had risen after 2011, others claimed that it had fallen, though by different amounts depending on who you listened too. (See Sandefur, 2022, for further discussion.) Some observers have tried to provide an answer largely avoiding the need for household survey data (as in, for example, Bhalla et al. 2022). However, it has long been agreed that household surveys are necessary for credibly measuring poverty. Here my focus is on the problem of getting an internally consistent survey-based series of poverty measures for India in the context of measuring global poverty.
Until early April 2022 it seems that we were still pretty much in the dark about how India’s poor have been doing over the last ten years. That changed with the release of a World Bank working paper by Sutirtha Sinha Roy and Roy van der Weide (2022). I will briefly review what this paper has done, and then discuss what their results tell us.
What do Roy and van der Weide do, and what do they find?
There has been a major private sector effort since 2014 to provide new survey data that could fill the gap left by the government’s decision to not release the results of the 2017-18 NSS. I refer to the Consumer Pyramid Household Survey (CPHS). While there was much hope that this new survey would do the job, it soon became clear that there were serious questions about its reliability for the purpose of measuring poverty, and (most importantly) its comparability with the NSS (see, for example, Drèze and Somanchi, 2021). There are differences in how consumption was being measured and questions about the representativeness of the CPHS, notably in how the sampling was done. The CPHS on its own was not going to be good enough to fill the gap.
What Roy and van der Weide (2022) did was figure out a reasonable way to re-shape the CPHS to clone the NSS. Their paper provides a lot of technical detail in how they did this and various robustness checks (the working paper is over 90 pages most of which is devoted to technical/ methodological issues). Here I will only provide a non-technical summary.
In addressing the concerns that have been raised that the sampling methods used in the CPHS are likely to have under-counted poor households, Roy and van der Weide undertake a systematic re-weighting of the CPHS, such that its socio-economic composition (as measured by a set of observed household attributes) matches well other nationally representative surveys. They then apply the new sampling weights in their estimations from the CPHS. They show that the likely biases in the CPHS are reduced.
They consider two approaches to dealing with the differences in the consumption measures obtained by the CPHS and NSS. The first uses a host of predictors of consumption, found in both the CPHS and the NSS, to impute NSS consumption into the CPHS. The second method models the relationship between CPHS and NSS consumption, which they then use to re-calculate CPHS consumption to make it look more like NSS-type consumption (as indicated by the first three moments of the NSS consumption distribution, exploiting the fact that the third moment of NSS consumption turns out to be highly stable over time). The two approaches differ in the assumptions they make but (reassuringly) they give similar results. The authors prefer the second approach, and I have no reason to disagree, so I will also focus on that here. Of course, it would be better to have the data from the 2017-18 NSS round, but that is still not an option. However, one advantage of using the CPHS in this way is that we get more high-frequency estimates of the poverty measures—for years in which there was no NSS.
The “headline” finding from the Roy and van der Weide paper is that India’s poverty rate has continued to decline since 2011. Using their re-shaped CPHS consumption distributions they find that the $1.90 a day poverty rate fell from 19 percent in 2015 to 10 percent in 2019, as compared to the PovcalNet estimate using the NSS of 22 percent in 2011. (Going back to the earliest year in PovcalNet, the corresponding poverty rate was 56 percent in 1983; it was 48 percent in 1993—the first “post-reform” survey round used in PovcalNet.) Rural poverty incidence also followed a downward trend, but Roy and van der Weide find a brief reversal in the trend in urban poverty, which rose by two percentage points in 2016 (at the time of the demonetarization). Among other findings, Roy and van der Weide confirm the finding of Datt et al (2020) that urban and rural poverty measures have been converging over time, such that there is probably very little difference today. Table 1 puts together the PovcalNet numbers (both nationally and split between urban and rural areas) with those from Roy and van der Weide.
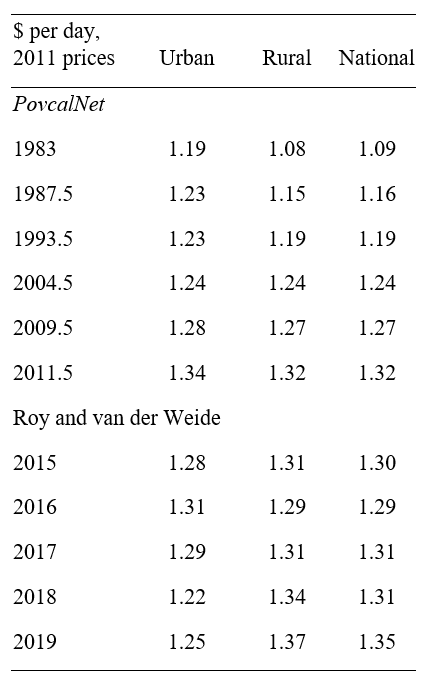
Table 1. Poverty measures for India

Note: The measures use the $1.90 a day poverty line, in 2011 prices.
Source: World Bank’s PovcalNet, Roy and van der Weide (2022) and author’s correspondence with Roy and van der Weide.
Some further thoughts
This is, of course, good news. To put the Roy and van der Weide results in historical context, India’s progress against poverty was undeniably slow prior to the 1990s, but has picked up its pace since then. (For a longer-term perspective on India’s progress against poverty and how it differed between the “pre-reform” and “post-reform” periods see Datt et al. 2020.) Eyeballing the Roy and van der Weide results in the context of the series for India in PovcalNet, and past work in the literature, I would not interpret their findings as either a marked “acceleration” or “deceleration” in India’s progress against poverty since the early 1990s, but it is indicative of continuing progress. If one does simple end-point comparisons, the annual rate of decline in the poverty rate was slightly higher post 2011 than post 1993 (1.5 pp per year 1993-2019 versus 1.6 in the period 2011-19), but I would not make too much of this difference.
Roy and van der Weide (2022) only provide the headcount index, but they kindly provided their estimates of the poverty gap (PG) and squared poverty gap (SPG) measures (Foster et al. 1984), which are also provided in Table 1. Unlike the headcount index, these measures are responsive to changes in consumption below the poverty line. (The headcount index only changes when households cross the line.) So this is also worth checking. The results generally follow a similar pattern over time to the headcount index, also echoing past findings in the literature related to earlier periods. Over the period as a whole, the correlation coefficients between the headcount index and PG and SPG are 0.99 and 0.98 respectively; taking the first differences, the correlation coefficients are 0.85 and 0.69. (One difference is that the SPG in urban areas exceeded that in rural areas in 2018—the only year that was observed.)
Another perspective on progress against poverty is provided by estimating the consumption floor, as defined Ravallion (2016). This can be thought of as a Rawlsian measure of poverty, focusing on the level of living of the poorest. Of course, there is likely to be considerable measurement error if one were to use the (literally) lowest observed level of consumption in any sample survey as the measure of the “floor”, so some averaging is clearly called for. Ravallion (2016) proposes that the consumption floor should be measured by taking a weighted mean of all consumptions below the poverty line, with highest weight on the lowest observed consumption, and with weights declining linearly as consumption rises, reaching zero at the poverty line. Then Ravallion (2016) shows that the consumption floor is simply  where Z is the poverty line.
Table 2 provides this measure of the consumption floor, again for both PovcalNet and the Roy and van der Weide series. Figure 1 plots the series. The floor has generally risen over time, though rather slowly, from $1.09 a day in 1983 to $1.35 in 2019. Progress in lifting the floor has clearly been slow since 2011, when it was $1.32 a day. There has been convergence between the urban and rural consumption floors up to 2011. The Roy and van der Weide series suggest a fall in the urban consumption floor since then, and a reversal in the prior pattern of a higher floor in urban than rural areas. The signs of a drop in the urban floor could well reflect changes in the type of migrants moving from rural to urban areas over the last ten years.
Table 2. Consumption floor in India
Source: Author’s calculations from Table 1.
Figure 1. Consumption floor in India
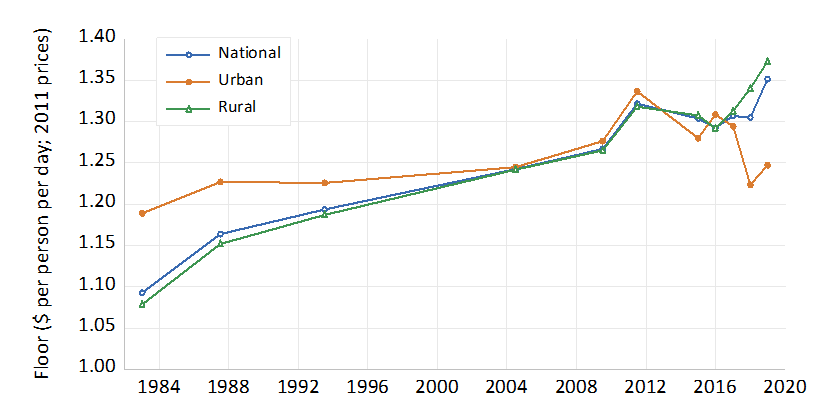
Note: Based on NSS up to 2011 and Roy and van der Weide (2022) from 2015 onwards.
These findings on the consumption floor provide a qualification to the evidence pointing to India’s progress in reducing the proportion of the population living in poverty in the last decade (and prior to that), namely that this progress appears to have come with only limited gains for the poorest, who are probably living at a similar standard of living today to that found in the last 2011-12 NSS round. Fewer people live at or near the floor, but the floor has changed rather little.
Next steps
We still need to see what India’s poverty measures over the last ten years look like when using India’s national poverty lines, applied to the careful re-shaping of the CPHS consumption data by Roy and van der Weide. The World Bank’s international $1.90 a day line in 2011 prices is anchored to the poverty lines found in low-income countries (updating the $1.25 line for 2005 proposed by Ravallion et al. 2009, based on a survey of national poverty lines). Other lines can also be defended, as PovcalNet readily allows.
Relative poverty measures are also of interest, to better reflect changing perceptions of what “poverty” means in growing developing countries such as India. The “strongly relative” measures that have been popular in Western Europe are hard to defend on theoretical grounds, especially in developing countries, but “weakly relative” measures offer a better compromise (Ravallion and Chen 2011).
Of course, the best “next step” would be for the government of India to return to its policy of providing public access to the NSS data. Until then, we at least have something credible to work with, to fill that gaping hole in our knowledge about global poverty.
References
Bhalla, Surjit, Karan Bhasin and Arvind Virmani, 2022, “Pandemic, Poverty, and Inequality: Evidence from India” IMF Working Paper 2022/069.
Datt, Gaurav, Martin Ravallion, and Rinku Murgai, 2020, “Poverty and Growth in India over Six Decades,” American Journal of Agricultural Economics 102 (1): 4-27.
Drèze, Jean, and A. Somanchi, 2021, “View: New Barometer of India’s Economy Fails to Reflect Deprivations of Poor Households,” The Economic Times June 21.
Foster, James, J. Greer, and Erik Thorbecke, 1984, “A Class of Decomposable Poverty Measures,” Econometrica 52: 761-765.
Ravallion, Martin, 2016, “Are the World’s Poorest Being Left Behind?” Journal of Economic Growth 21(2): 139–164.
Ravallion, Martin, and Shaohua Chen, 2011, “Weakly Relative Poverty,” Review of Economics and Statistics 93(4): 1251-1261.
Ravallion, Martin, Shaohua Chen and Prem Sangraula, 2009. “Dollar a Day Revisited,” World Bank Economic Review 23(2):163-184.
Roy, Sutirtha Sinha, and Roy van der Weide, 2022, “Poverty in India Has Declined over the Last Decade But Note As Much as Previously Thought,” Policy Research Working Paper 9994, World Bank, Washington DC.
Sandefur, Justin, 2022, “The Great Indian Poverty Debate 2.0,” Blog Post, Center for Global Development.
Topics
CITATION
Ravallion, Martin. 2022. Filling a Gaping Hole in the World Bank’s Global Poverty Measures: New Estimates of Poverty in India since 2011 . Center for Global Development.DISCLAIMER & PERMISSIONS
CGD's publications reflect the views of the authors, drawing on prior research and experience in their areas of expertise. CGD is a nonpartisan, independent organization and does not take institutional positions. You may use and disseminate CGD's publications under these conditions.