Recommended
Project
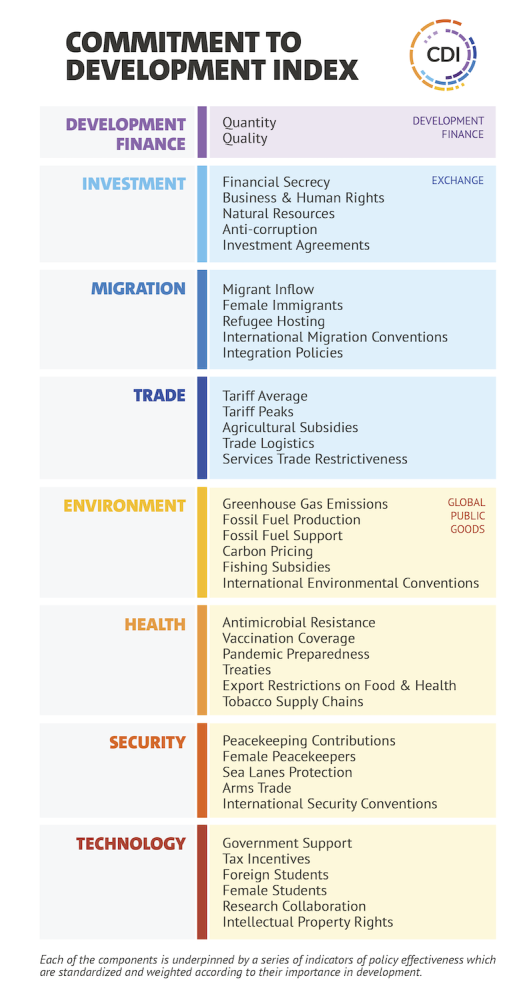
The Commitment to Development Index (CDI) ranks 40 of the world’s most powerful countries on policies that affect more than five billion people living in poorer nations. Because development is about more than foreign aid, the CDI covers eight distinct policy areas:
- Development Finance
- Investment
- Migration
- Trade
- Health
- Environment
- Security
- Technology
Why Does Commitment to Development Matter?
In our integrated world, decisions made by the richest countries about their own policies and behaviour have repercussions for people in lower-income nations. At the same time, greater prosperity and security in poorer countries benefit the whole world. They create new economic opportunities, increase innovation, and help reduce risks posed by public health, security, and economic crises. The CDI looks at 40 countries with some of the largest economies and celebrates those with policies that benefit not only themselves, but also the development of others and our common good.
How Do We Calculate the Commitment to Development Index?
We use thousands of data points across more than 50 indicators to come up with overall rankings and for each of the eight policy components. Countries score well for things like generous and high-quality finance for development, transparent investment, low barriers to trade for developing countries, and migration policies which are open and promote integration. They also do well for policies that enhance global public goods, such as supporting technological research and development, protecting the environment, contributing to global security, and, in a component that is new this year, fostering global health with disease prevention.
Like the Sustainable Development Goals, the CDI recognizes development progress is holistic. But while the SDGs focus on outcomes and all nations, the CDI emphasizes how the policies of countries with the most powerful economies can make a huge difference.
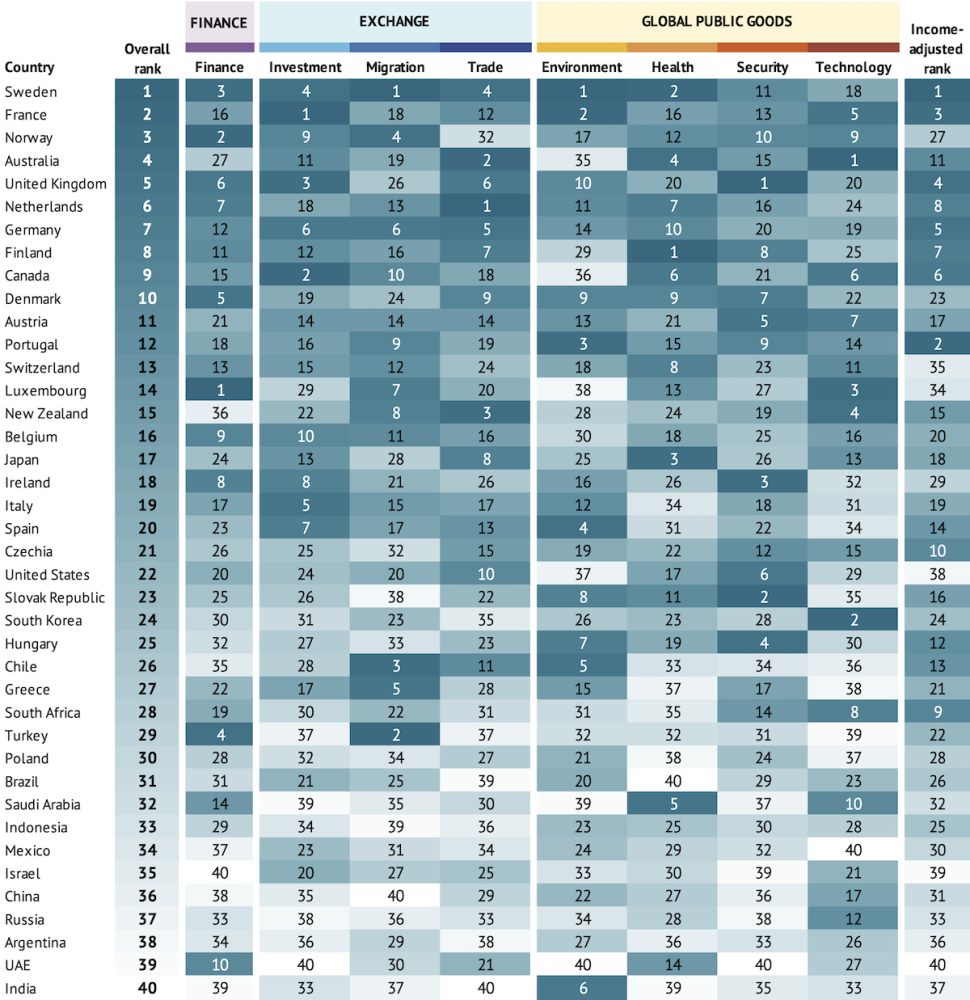
CDI 2021 Results: How Well Are Countries Doing?
Sweden tops this year’s CDI, followed by France in second and Norway in third. Sweden scores well across seven of the eight components, ranking first on environment and migration, and second on the new health component. It has room for improvement on technology, with relatively little research collaboration and few foreign students from lower-income countries.
France comes second overall, ranking top on investment and second on environment but with mid-table scores on development finance and migration. Norway takes third place with strong scores on development finance and migration but middling environmental performance and relatively restrictive trade policies. Australia moves into the top five thanks to its performance on health, with strong pandemic preparedness and no export restrictions on medical goods or food. The UK completes the top five, ranking first on security and scoring strongly in development finance and trade, albeit before its recent cut in aid.
Environmental performance at a key moment for climate
The CDI’s environmental component assesses countries’ contributions on key environmental issues, including climate change. Measures are adjusted to account for differences in the size of countries’ populations and economies, to ensure comparisons are fair. We examine direct emissions as well as those embedded in international trade. We also look at fossil fuel subsidies and production and carbon pricing.
Sweden tops the environment component: its direct annual emissions of 5 tonnes of CO2 equivalent per head are half the CDI average and it tops the carbon pricing indicator at $56 per tonne. France, Portugal, Spain, and Chile complete the top five. India has the lowest emissions per capita, at just over 2 tonnes per head.
The lowest ranking countries on environment—Canada, the US, Australia, UAE, and Luxembourg—each emitted 20 tonnes of CO2 per head or more.
Carbon pricing expanded among CDI countries in 2020. Australia set a price of $6.3 per tonne emitted, stepping up from no additional cost in the prior year. South Korea’s emissions trading scheme expanded, with the price rising almost 50 percent and reaching $24.6 per tonne in 2020. Despite raised ambitions, neither country reaches Sweden’s level, where each tonne is priced an additional $55.8. Almost a quarter of countries have yet to implement carbon pricing.
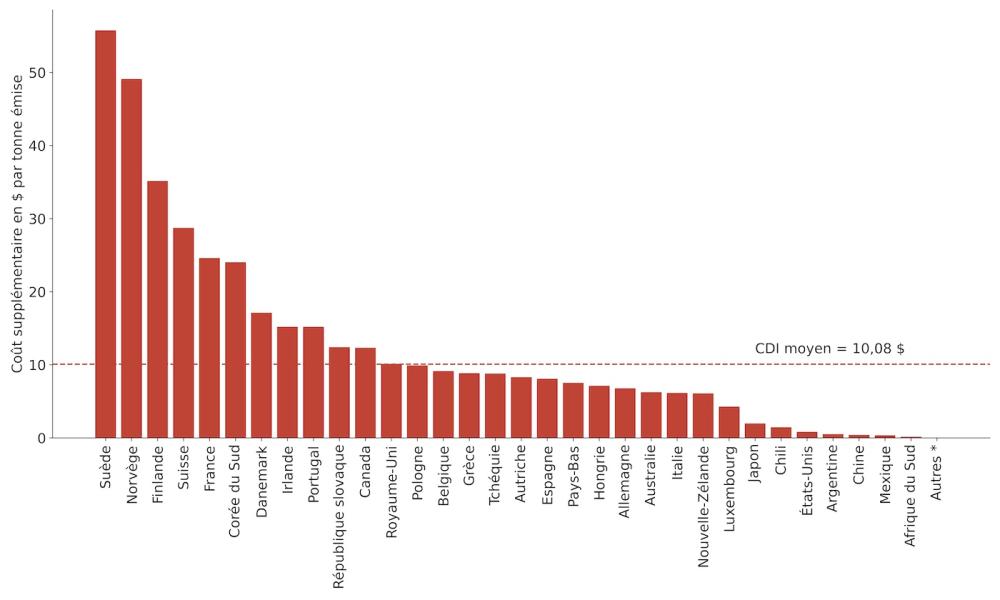
Figure 1. Carbon Prices in CDI Countries
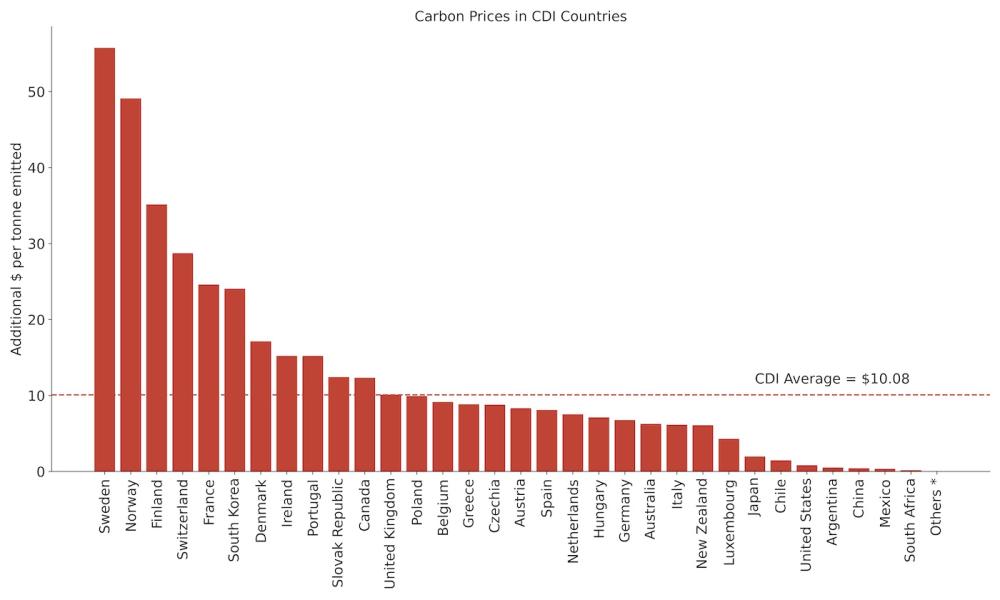
Note: Countries classed as “others” (no carbon price) are Brazil, India, Indonesia, Israel, Russia, Saudi Arabia, Turkey, and UAE
Leadership on global health
The CDI’s new health component recognises the importance of countries’ contributions to global health, not only in pandemic preparedness, but also broader global health issues, like preventing antimicrobial resistance (AMR), engaging in international cooperation on tobacco, curbing pollutants and waste, and avoiding trade restrictions on health and medical goods.
Finland, Sweden, and Japan top the health component. Each scores strongly on preventing AMR and imposed virtually no restrictions on medical or food supplies in the last year. Finland and Japan also score strongly on pandemic preparedness. Australia and Saudi Arabia complete the top five, with the former leading on pandemic preparedness and the latter doing relatively well on AMR and joining all health treaties and bodies we assess.
The CDI highlights that most countries have long ignored epidemic preparedness: only 13 CDI countries ever completed a Joint External Evaluation with the World Health Organization (WHO) and over half have not updated their national influenza plans for over a decade. Similarly, nearly a quarter of countries have not approved a national action plan that reflects the objectives of WHO’s Global Action Plan on AMR. A further 28 countries do not meet the WHO target and herd immunity threshold of 95 percent for measles vaccination coverage.
EU well ahead of China and US on development
The US score is based almost entirely on Trump-era policies. It ranks 22nd overall, with its best score on security. It ranks in the bottom five on environment and earns only middling scores on most components.
China lags behind the US in its commitment to development, ranking 36th. China’s is in the top half on technology (17th) but it has low quality development finance and ranks in the bottom five on both migration and security.
EU countries take six of the top ten places. The EU’s trade-for-development regime is among the best, and its countries tend to provide more development finance relative to the size of their economy. Still, this is not always focussed on the neediest, and EU countries do less well on technology, with trade agreements that go beyond World Trade Organization standards in restricting the flow of technology.
Middle-income economies take leading roles
Policies in major middle-income economies are important to other countries’ development, and the CDI covers all G20 countries, including Argentina, Brazil, China, India, Indonesia, Mexico, Russia, South Africa, and Turkey. South Africa ranks highest among this group with relative strengths in migration, trade, security, and technology. Turkey scores strongly on development finance and migration, largely reflecting the war in Syria. India ranks 6th on environment.
To account for how a country’s wealth affects its development contribution, we also calculate income-adjusted scores. These look at development contributions compared to what we might expect of countries based on their income level. In these results, Sweden also ranks top—doing much more than we’d expect for its income-level—but other countries shoot up the ranking. Portugal ranks 2nd on our income-adjusted measure and South Africa ranks 9th. Czechia, Hungary, and Chile also significantly rise in the income-adjusted rankings, ranking 10th, 12th, and 13th.
Development Finance
Development Finance Quantity and Quality
Concessional financing remains an important part of development policy. To measure the quantity of finance consistently across countries, we developed the “Finance for International Development” (FID) measure. We also assess the quality of development finance, with credit for contributions through the multilateral system and bilateral indicators assessing focus on poor or fragile countries, and effective practices.
Luxembourg tops the development finance component, scoring well on both quantity (providing just under 1 percent of GNI as FID) and quality. Turkey provides the most relative to its GNI, and as Syria receives most of its development finance, its scores well on the poverty and fragility focus. Belgium and Ireland top the quality subcomponent based on their strong focus on poor countries, and South Africa substantially improves its quality score for the same reason with its recent support to South Sudan.
The US comes in mid-table on development finance, at 18th. It provides the most development finance in absolute terms, but it is less generous relative to the size of its economy, providing 0.16 percent of GNI. The median EU country we assess provides almost double this, 0.35 percent.
China scores poorly on both quantity and quality. Financial flows from China are large but their concessionality is either low or in doubt. China is the least transparent provider of finance, though it recently committed to developing a modern statistical information system.
Exchange
Investment
Foreign direct investment is the largest source of financing for many developing countries. The CDI rewards countries for policies that support investment and for signing onto international commitments (including preventing bribery and safeguarding human rights) but do not undermine partner countries’ ability to develop sustainable public policy. Countries are penalised for policies that allow financial secrecy, which enables tax evasion, money laundering, and corruption, and degrades governance and international security.
France, Canada, and the UK score highest on investment. France has an all-round strong performance, particularly on policies to limit financial secrecy. Canada scores best on the development friendliness of bilateral investment agreements while the UK scores highly on business and human rights and anticorruption. Brazil is the highest ranked middle-income country. Belgium is the most transparent financial jurisdiction, followed by Spain and Italy, while the UAE and the US are the most secretive.
Migration
Labour mobility can be a powerful tool for poverty reduction. By migrating to richer countries, workers can increase their productivity and earn higher incomes. Migrants send billions of dollars home each year, a flow that surpasses foreign aid. The CDI rewards countries for welcoming migrants from poorer countries, receiving a high share of female migrants, accepting refugees, embracing sound migrant integration policies, and joining international conventions protecting the rights of migrants.
Sweden scores highest overall on migration. Relative to its population, it welcomes the second largest number of refugees and scores highest on its integration policies. Turkey comes 2nd by hosting the largest number of refugees relative to its population, almost 10 times the CDI average.
Greece is 5th in migration, rising 23 places from the previous CDI as new data shows the large number of migrants it welcomes. Chile rises 18 places to 3rd, driven by large migrant inflows from Venezuela and Haiti.
Trade
Trade provides poorer countries with opportunities to attract investment, create jobs, and reduce poverty. Large economies dominate global trade, with some goods and services from poorer countries still facing trade barriers. Tariffs and subsidies create an uneven playing field for agricultural goods, and red tape and legal restrictions make trade harder for developing countries.
The Netherlands scores highest on trade with low tariffs and agricultural subsidies, strong logistics, and openness to trade in services. Australia and New Zealand rank 2nd and 3rd, with low tariffs and subsidies. India, Brazil, and Argentina are at the bottom of the trade component with high tariffs after weighting against poorer countries, despite Brazil and Argentina’s low agriculture subsidies.
Global Public Goods
Environment
Higher-income countries contribute most to climate change, but poorer countries will suffer most. They are more susceptible geographically, have fewer resources and less state capacity to deal with the effects, and many more of their people depend directly on the environment to meet their daily needs. The CDI scores countries on how low their greenhouse gas emissions are, their production and subsidy levels of fossil fuels, the extent to which carbon emissions are priced, whether they avoid subsidies to fishing, and for signing up to environmental treaties.
On the whole, net emissions per head in CDI countries continued to increase in the latest data, from 7.86 to 7.93 tonnes. India’s direct emissions increased slightly, but both direct and net (adjusted for land use and trade) were lowest of all countries at 2.3 and 2.1 tonnes of CO2 equivalent per head, respectively. Despite rising CO2 emissions overall, 29 CDI countries decreased their direct emissions per head in the latest data. Policy incentives around fossil fuel also deteriorated. Direct subsidies for the production and consumption of fossil fuels rose from an average of 0.72 to 0.78 percent of GNI. Chile was the lowest subsidiser, with almost zero subsidies across coal, oil, gas, and electricity. The average carbon price among CDI countries fell from $10.75 to $10.08 additional cost per tonne of CO2 emitted.
Health
The COVID-19 pandemic has brought into sharp focus the transboundary nature of disease outbreaks, the spillovers of domestic policy decisions, and the need for international collaboration. But “peacetime” policies also matter. The risks posed by growing antimicrobial resistance threaten numerous lives beyond domestic borders. The CDI awards countries on their efforts to prevent diseases, including through vaccination, pandemic preparedness, and antimicrobial stewardship. Countries are penalised for restricting exports in medical goods and food, and for neglecting to implement high standards in tobacco trade.
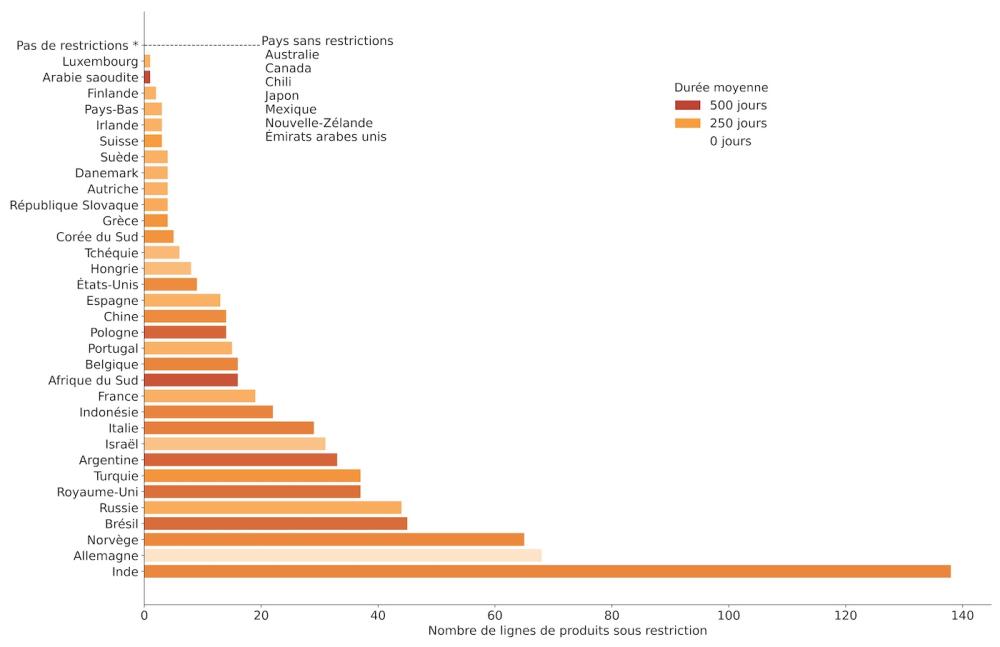
Finland, Sweden, and Japan top the health component. Along with Australia, New Zealand, Canada, Chile, Mexico, and UAE, they tended to avoid export restrictions on key food and health products.
Figure 2. Restrictions of Food and Health Products
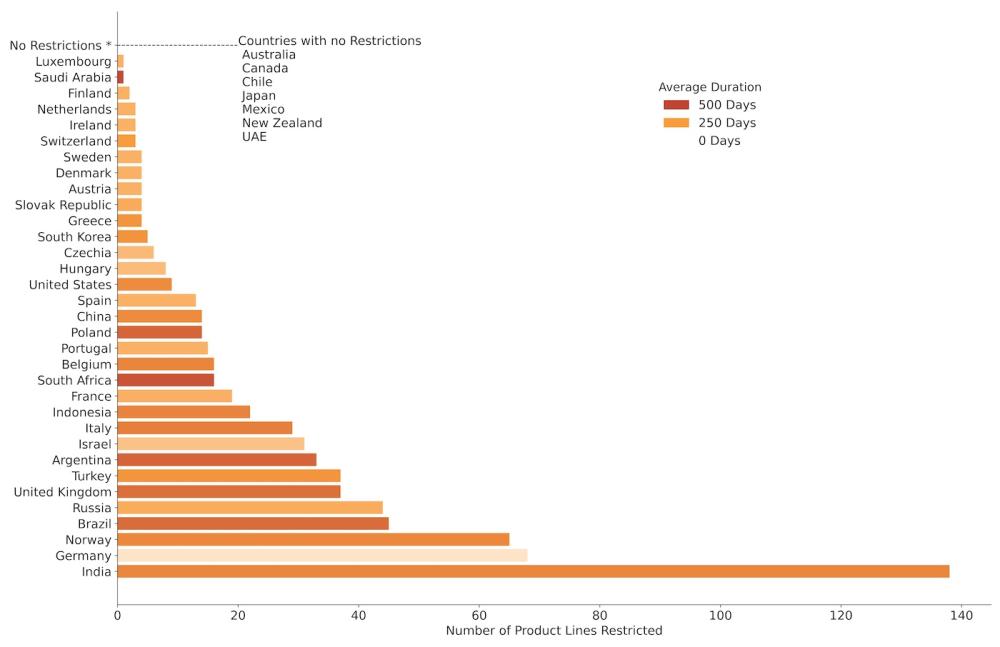
Meanwhile, France and the UK have the most stringent regulations on international tobacco trade.
Security
Security and development are closely linked. War and political violence can destroy livelihoods and public institutions, while poverty and institutional weakness make it easier for violence to erupt. The CDI rewards countries for contributing to peacekeeping and humanitarian interventions, basing naval fleets where they can secure sea lanes, and participating in international security regimes that promote non-proliferation, disarmament, and international rule of law. The CDI penalizes countries for arms exports, especially to nations with undemocratic regimes, and for not publishing data on their arms trade.
The UK leads on security as a significant contributor to sea lanes protection and international peacekeeping operations. Slovakia ranks 2nd with the highest support to peacekeeping relative to the size of its economy. The US comes 6th and provides the largest proportion of GNI to international sea lanes protection.
UAE, Israel, and Russia place at the bottom on security. Israel and UAE each export arms worth over 1 percent of their GNIs. UAE, closely followed by China, come bottom on arms sales that minimise conflict potential, sending the highest shares of their arms to poor, undemocratic, and militaristic countries.
Technology
Technology is critical to economic and human development. Advances in medicines, information and communication technology, sustainable energy, and agricultural technology help raise the quality of life worldwide. The CDI rewards policies stimulating technology creation and facilitating the international flow of knowledge.
Australia, South Korea, and Luxembourg are the top performers in technology. On technology creation, South Korea and Luxembourg score highly by giving large government budget allocations to R&D while France scores top on providing tax incentives for private R&D.
On technology transfers, Luxembourg and Australia accept the most significant numbers of foreign students when weighted by the poverty of the country of origin. In the indicator measuring efforts by a country’s researchers to co-author outputs with partners in developing countries, Saudi Arabia, South Africa, and UAE come top.
On intellectual property rights, countries outside the OECD, including China, Indonesia, and Saudi Arabia, lead by not imposing more stringent intellectual property rights than already embodied in World Trade Organization rules.
For Country Reports and Full Results
Visit cgdev.org/cdi to explore the Commitment to Development Index, including full country reports, interactive web portal, full calculations, and method paper.
About the CDI
The Center for Global Development has compiled the Commitment to Development Index annually since 2003. CGD works to reduce global poverty and improve lives through innovative economic research that drives better policy and practice by the world’s top decision makers. Ian Mitchell directs the CDI with significant contributions from Lee Robinson, Beata Cichocka, Sam Hughes, and Euan Ritchie. The 2021 CDI builds on the work in earlier editions by Anita Käppeli, Owen Barder, and David Roodman. The CDI is supported by funding for CGD Europe’s development effectiveness programme, including contributions from the governments of Australia, Canada, Germany, Luxembourg, and Sweden. The CDI does not reflect the official opinion of funders. The authors are responsible for all methodological decisions and for the information and views expressed here.
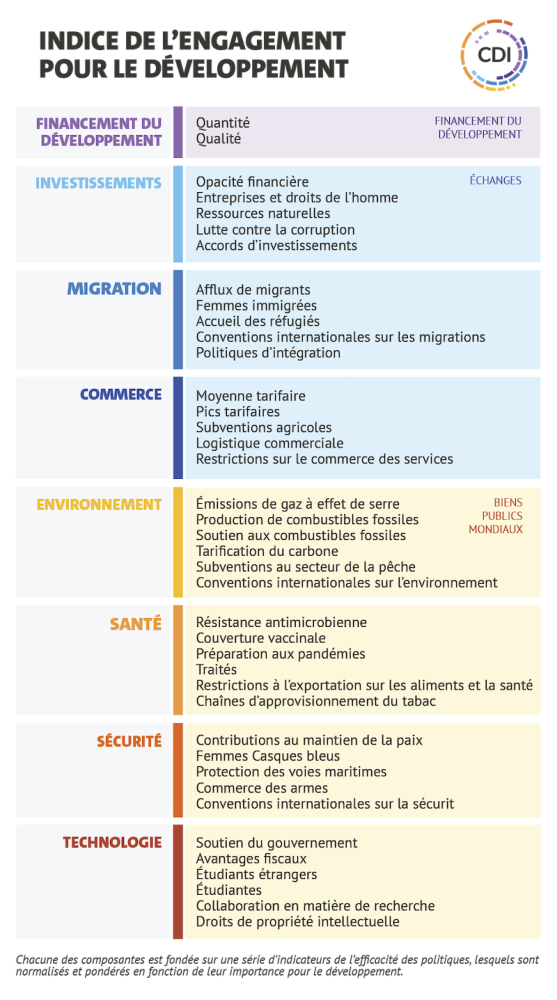
L’Indice de l’engagement pour le développement (Commitment to Development Index, CDI) classe 40 des pays les plus puissants sur la base des politiques qu’elles instaurent et qui ont une incidence sur plus de cinq milliards de personnes vivant dans les pays plus pauvres. Du fait que le développement est à peu près supérieur à l’aide internationale, le CDI couvre huit domaines de politique distincts :
- Financement du développement
- Investissements
- Migration
- Commerce
- Santé
- Environnement
- Sécurité
- Technologie
Pourquoi l’engagement pour le développement est-il important ?
Compte tenu de l’intégration mondiale actuelle, les décisions des pays riches en matière de politique et leur comportement ont des répercussions sur les populations des pays à faibles revenus. De la même façon, une prospérité et une sécurité accrues dans les pays les plus pauvres profitent au monde entier. Ces conditions créent de nouvelles opportunités économiques, stimulent l’innovation, contribuent à la réduction des risques sanitaires et sécuritaires ainsi que les crises économiques. Le CDI se focalise sur 40 nations, dont certaines des plus grandes économies mondiales. Il met à l’honneur les pays dont les politiques ne visent pas seulement leurs propres intérêts, mais aussi le développement des autres et l’intérêt général.
Comment l’Indice de l’engagement pour le développement est-il calculé ?
Nous utilisons des milliers de points de données pour plus de cinquante indicateurs pour établir les classements globaux et pour chacune des huit composantes de la politique. Les pays obtiennent de bonnes notes dans les domaines suivants : financement du développement de bonne qualité, transparence des investissements, faibles barrières commerciales favorisant les échanges avec les pays en développement et politiques migratoires ouvertes et encourageant l’intégration. Ils s’en sortent également bien en matière de politiques qui améliorent les biens publics mondiaux, notamment à travers un soutien solide envers la recherche et le développement technologiques, la protection de l’environnement et les contributions à la sécurité mondiale, et, dans une composante qui est nouvelle cette année, la promotion de la santé mondiale par la prévention des maladies.
À l’instar des objectifs de développement durable (ODD), le CDI reconnait que les avancées en matière de développement sont globales. Cependant, alors que les ODD se concentrent sur les résultats et sur tous les pays, le CDI met l’accent sur la façon dont les politiques des pays aux économies les plus puissantes peuvent faire une énorme différence.
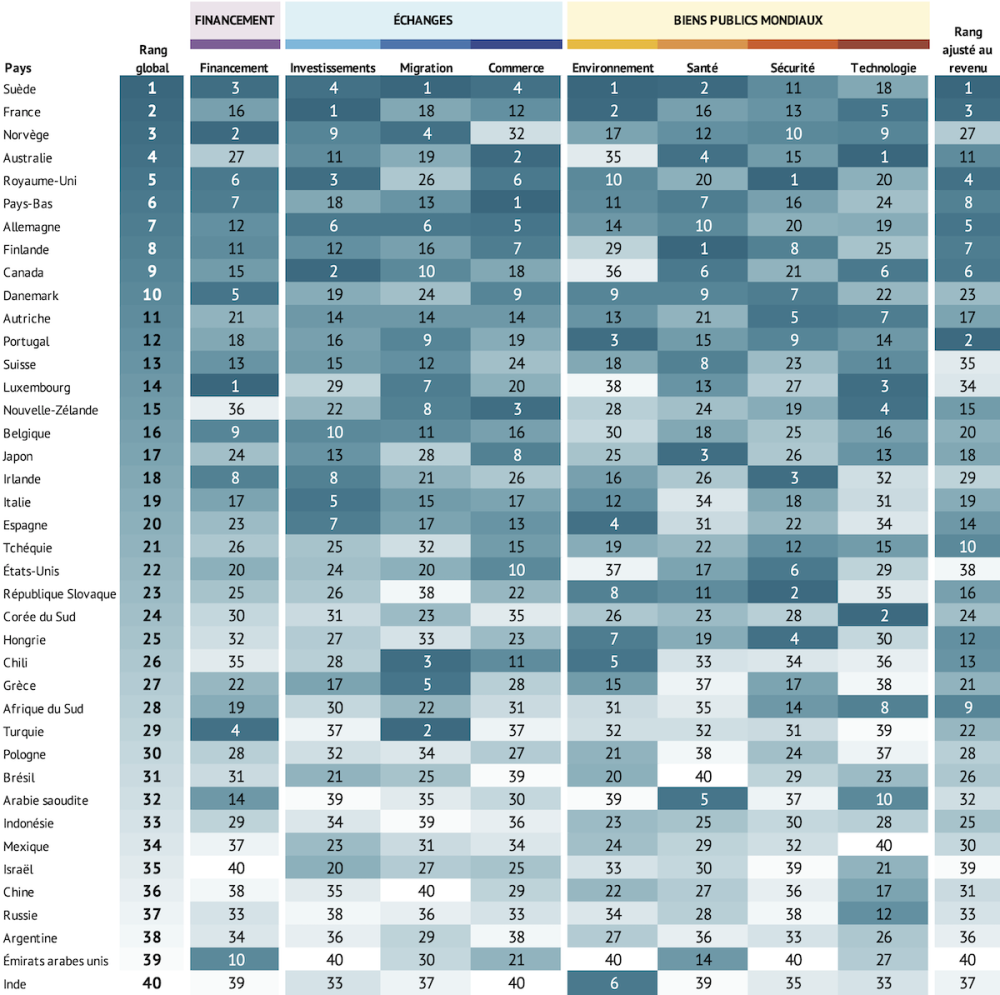
Quels sont les résultats des pays évalués par le CDI 2021 ?
La Suède est en tête du CDI cette année, suivie de la France en deuxième position puis de la Norvège qui complète le podium. La Suède réalise un bon score dans sept des huit composantes, en se classant première en matière d’environnement et de migration et seconde concernant la nouvelle composante « Santé ». Elle dispose d’une marge de progression en matière de technologie, avec une collaboration en matière de recherche relativement faible et peu d’étudiants étrangers provenant de pays à faible revenu.
La France se place en deuxième position. Elle se classe première en matière d’investissements et deuxième en matière d’environnement, mais obtient des scores moyens en matière de financement du développement et de migration. La Norvège occupe quant à elle la troisième place du podium avec des scores élevés en matière de financement du développement et de migration, mais des performances environnementales moyennes et des politiques commerciales relativement restrictives. L’Australie s’insère dans le top 5 grâce à ses performances en matière de santé, avec une très bonne préparation aux pandémies et l’absence de restrictions sur les articles médicaux et les aliments. Le Royaume-Uni complète le top 5, en se classant premier en matière de sécurité et en obtenant un score élevé en matière de financement du développement et de commerce, quoiqu’avant sa coupe récente dans les aides.
Les performances environnementales à un moment clé pour le climat
La composante « Environnement » du CDI évalue les contributions des pays concernant les principaux enjeux environnementaux, y compris les changements climatiques. Les mesures sont ajustées pour tenir compte des différences de tailles entre les populations et les économies des pays pour garantir l’équité des comparaisons. Nous examinons les émissions directes ainsi que celles associées au commerce international. Nous considérons également les subventions aux combustibles fossiles et leur production et la tarification du carbone.
La Suède est en tête pour la composante « Environnement » : ses émissions annuelles directes de 5 tonnes d’équivalent CO2 par habitant représentent la moitié du CDI moyen et elle est en tête pour l’indicateur de tarification du carbone à 56 $ par tonne. La France, le Portugal, l’Espagne et le Chili complètent le top 5. L’Inde présente les émissions les plus faibles par individu, juste au-dessous de 2 tonnes par habitant.
Les pays obtenant les scores les plus faibles en matière d’environnement, à savoir le Canada, les États-Unis, l’Australie, les Émirats arabes unis et le Luxembourg, ont chacun émis au moins 20 tonnes de CO2 par habitant.
La tarification du carbone a connu un accroissement parmi les pays évalués par le CDI en 2020. L’Australie a fixé un prix de 6,3 $ par tonne émise, abandonnant ainsi l’absence de coût supplémentaire lors de l’année précédente. Le système d'échange de quotas d'émission de la Corée du Sud a connu un accroissement, le prix grimpant de presque 50 pour cent pour atteindre 24,6 $ par tonne en 2020. Malgré des ambitions accrues, aucun pays n’atteint le niveau de la Suède, pays dans lequel chaque tonne est tarifée à 55,8 $ de plus. Presque un quart des pays doivent encore mettre en œuvre la tarification du carbone.
Figure 1. Prix du carbone dans les pays évalués par le CDI
Note : Les pays classés dans la rubrique « autres » (aucun prix pour le carbone) sont le Brésil, l’Inde, l’Indonésie, l’Israël, la Russie, l’Arabie Saoudite, la Turquie et les Émirats arabes unis
Leadership en matière de santé mondiale
La nouvelle composante « Santé » du CDI reconnaît l’ampleur des contributions des pays à la santé mondiale, non seulement en matière de préparation aux pandémies mais aussi concernant les enjeux de santé mondiale plus larges, comme la prévention de la résistance aux antimicrobiens (RAM), l’engagement en matière de coopération internationale concernant le tabac, la réduction des polluants et des déchets, et les restrictions commerciales sur les articles médicaux et relatifs à la santé.
La Finlande, la Suède et le Japon se classent en tête dans la composante « Santé ». Chaque pays atteint un score très élevé en matière de prévention de la RAM et n’a virtuellement imposé aucune restriction sur les fournitures médicales et alimentaires au cours de l’année précédente. La Finlande et la Japon ont également atteint un score très élevé en matière de préparation aux pandémies. L’Australie et l’Arabie Saoudite complètent le top 5, la première étant devant en matière de préparation aux pandémies et la seconde s’en sortant relativement bien en matière de RAM et s’étant jointe à tous les traités et organismes de santé que nous avons évalués.
Le CDI met en évidence que la plupart des pays ont longtemps ignoré la préparation aux pandémies : seuls 13 pays évalués par le CDI ont rempli une évaluation conjointe externe avec l’Organisation mondiale de la santé (OMS) et plus de la moitié n’ont pas mis à jour leurs plans nationaux de lutte contre la grippe pendant plus d’une décennie. De la même manière, presque un quart des pays n’ont pas approuvé de plan d’action national qui reflète les objectifs du plan d’action mondial de l’OMS en matière de RAM. 28 pays supplémentaires n’ont pas atteint l’objectif de l’OMS et le seuil d’immunité collective de 95 pour cent pour la couverture vaccinale contre la rougeole.
L’UE loin devant la Chine et les États-Unis en matière de développement
Le score des États-Unis se base presque uniquement sur les politiques de l’ère Trump. Ils se classent au 22ème rang mondial, son meilleur score étant obtenu dans le domaine de la sécurité. Ils se classent parmi les cinq derniers en matière d’environnement et n’obtient que des scores moyens sur la plupart des composantes.
La Chine accuse un retard sur les États-Unis, en se classant au 36ème rang. La Chine se trouve dans la première moitié en matière de technologie (17ème) mais elle présente un financement du développement de faible qualité et se classe parmi les cinq derniers en matière de migration et de sécurité.
Les pays de l’UE remportent six des dix premières places. Le régime de l’UE en matière de commerce pour le développement est l’un des meilleurs et ses pays ont tendance à apporter plus de financements au développement par rapport à la taille de leur économie. Toutefois, celui-ci ne se concentre pas sur les plus nécessiteux et les pays de l’UE s’en sortent moins bien en matière de technologie, les accords commerciaux allant au-delà des normes de l’Organisation mondiale du commerce en limitant les flux de technologie.
Les économies à revenu moyen jouent des rôles de premier plan
Les politiques dans les principales économies à revenu moyen sont importantes pour le développement des autres pays. Le CDI couvre tous les pays du G20, y compris l’Argentine, le Brésil, la Chine, l’Inde, l’Indonésie, le Mexique, la Russie, l’Afrique du Sud et la Turquie. L’Afrique du Sud atteint le rang le plus élevé parmi ce groupe avec ses points en matière de migration, de commerce, de sécurité et de technologie. La Turquie atteint un score élevé en matière de financement du développement et de migration, ce qui reflète largement la guerre en Syrie. L’Inde se classe au 6ème rang en matière d’environnement.
Pour tenir compte de la manière avec laquelle la richesse du pays influe sur sa contribution au développement, nous avons également calculé des scores ajustés aux revenus. Ces derniers examinent les contributions au développement par rapport à ce que nous pouvions attendre des pays en fonction de leur niveau de revenu. Dans ces résultats, la Suède se classe également en tête, en faisant bien plus que ce que nous attendions par rapport à son niveau de revenu, mais les autres pays sont descendus dans le classement. Le Portugal se classe au 2ème rang de notre mesure ajustée au revenu et l’Afrique du Sud se classe au 9ème rang. La Tchéquie, la Hongrie et le Chili montent également considérablement dans les classements ajustés aux revenus, en se classant aux 10ème, 12ème et 13ème rangs.
Financement du développement
Quantité et qualité du financement du développement
Le financement concessionnel représente toujours une part importante de la politique de développement. Pour mesurer la quantité du financement de manière cohérente dans l’ensemble des pays, nous avons mis au point la mesure « Financement du développement international » (FDI). Nous évaluons également la qualité du financement du développement, en tenant compte des contributions apportées par le biais du système multilatéral et des indicateurs bilatéraux évalués selon deux catégories : l’accent mis sur les pays pauvres ou fragiles et les pratiques efficaces.
Le Luxembourg arrive en tête de la composante « Financement du développement », avec un bon score à la fois en termes de quantité (le pays fournit un peu moins de 1 % du RNB sous forme de FDI) et de qualité. La Turquie fournit quant à elle le montant le plus élevé par rapport à son RNB, et comme la Syrie reçoit la majeure partie de son financement du développement, elle obtient de bons scores en termes de pauvreté et de fragilité. La Belgique et l’Irlande arrivent en tête pour la sous-composante « Qualité » sur la base de leur forte focalisation sur les pays pauvres et l’Afrique du Sud améliore son score relatif à la qualité pour la même raison que son soutien récent apporté au Soudan du Sud.
Les États-Unis se trouvent en milieu de tableau en matière de financement du développement, au 18ème rang. Le pays fournit le plus important financement du développement en termes absolus, mais il est moins généreux par rapport à la taille de son économie, puisqu’il fournit 0,16 pour cent de son RNB. Le pays médian de l’UE que nous avons évalué en fournit presque le double, à savoir 0,35 pour cent.
La Chine obtient de mauvais résultats en termes de quantité et de qualité. Les flux financiers en provenance de Chine sont importants mais leur degré de faveur est soit faible soit douteux. La Chine est le bailleur de fonds le moins transparent bien qu’elle se soit récemment engagée à développer un système d’information statistique moderne.
Échanges
Investissements
Les investissements directs étrangers sont la principale source de financement pour de nombreux pays en développement. Le CDI récompense les pays dont les politiques soutiennent les investissements et ceux qui signent des engagements internationaux (notamment de prévention de la corruption et de protection des droits de l’homme), le tout sans nuire à la capacité des pays partenaires à développer des politiques publiques durables. Les pays sont pénalisés lorsqu’ils suivent des politiques permettant une opacité financière, ce qui favorise l’évasion fiscale, le blanchiment d’argent et la corruption, ce qui nuit à la gouvernance et à la sécurité internationale.
La France, le Canada et le Royaume-Uni obtiennent les scores les plus élevés en matière d’investissement. La France affiche de fortes performances globales, en particulier en matière de politiques pour limiter l’opacité financière. Le Canada atteint le meilleur score en matière de contribution au développement d’accords d’investissements bilatéraux alors que le Royaume-Uni atteint un score élevé en matière d’entreprises et droits de l’homme et d’anticorruption. Le Brésil est le pays à revenu moyen le mieux classé. La Belgique est la juridiction financière la plus transparente, suivie de l’Espagne et de l’Italie, alors que les Émirats arabes unis et les États-Unis sont les plus secrets.
Migration
La mobilité de la main-d’œuvre peut être un puissant outil pour réduire la pauvreté. En partant travailler dans des pays plus riches, les migrants peuvent augmenter leur productivité et percevoir des revenus plus élevés. Ils envoient des milliards de dollars chaque année vers leur pays d’origine, un flux qui dépasse celui de l’aide internationale. Le CDI récompense les pays qui accueillent les migrants des pays plus pauvres, reçoivent un pourcentage élevé de migrantes, acceptent les réfugiés, adoptent des politiques judicieuses d’intégration des migrants et adhèrent aux conventions internationales visant à protéger les droits des migrants.
La Suède obtient le score global le plus élevé en matière de migration. Par rapport à sa population, elle accueille le second nombre de réfugiés le plus grand et atteint le score le plus élevé pour ses politiques d’intégration. La Turquie vient au 2nd rang en hébergeant le nombre de réfugiés le plus grand par rapport à sa population, soit presque 10 fois la moyenne des CDI.
La Grèce se classe 5ème en matière de migration, gagnant 23 places par rapport au précédent CDI comme les nouvelles données montre le grand nombre de migrants qu’elle accueille. Le Chili grimpe de 18 places jusqu’à la 3ème, en raison de flux migratoires importants en provenance du Venezuela et d’Haïti.
Commerce
Le commerce procure aux pays pauvres des possibilités d’attirer des investissements, de créer des emplois et de réduire la pauvreté. Les grandes économies dominent le commerce mondial, et certains biens et services des pays pauvres sont encore confrontés à des barrières commerciales. Les tarifs douaniers et les subventions créent des conditions de concurrence inégales pour les produits agricoles, tandis que les lourdeurs administratives et les contraintes juridiques rendent les échanges commerciaux plus difficiles pour les pays en développement.
Les Pays-Bas obtiennent les meilleurs résultats en matière de commerce grâce à des droits de douane peu élevés et de faibles subventions agricoles, une solide logistique commerciale et une ouverture au commerce des services. L’Australie et la Nouvelle Zélande se classent 2ème et 3ème, avec de faibles tarifs douaniers et subventions. L’Inde, le Brésil et l’Argentine ferment la marche de la composante « Commerce » avec des tarifs douaniers élevés après pondération par rapport aux pays plus pauvres, malgré les faibles subventions agricoles du Brésil et de l’Argentine.
Biens publics mondiaux
Environnement
Les pays à revenus élevés sont les principaux responsables du changement climatique, mais ce sont les pays pauvres qui paieront le plus lourd tribut. Ils sont plus exposés géographiquement, ont moins de ressources et de capacités au niveau de l’État pour faire face aux effets et une proportion beaucoup plus importante de leur population dépend de l’environnement pour satisfaire ses besoins journaliers. Le CDI évalue les pays selon plusieurs critères : la faiblesse de leurs émissions de gaz à effet de serre, leur niveau de production et les subventions dont font l’objet les combustibles fossiles, le degré de tarification des émissions de carbone, s’ils évitent les subventions en faveur du secteur de la pêche, mais également pour ce qui est de la ratification, ou non, des traités environnementaux.
Dans l’ensemble, les émissions nettes par habitant dans les pays évalués par le CDI ont continué d’augmenter dans les données les plus récentes, passant de 7,86 à 7,93 tonnes. Les émissions directes de l’Inde ont légèrement augmenté, mais aussi bien les directes que les nettes (ajustées pour l’utilisation des terres et le commerce) étaient les plus faibles de tous les pays à 2,3 et 2,1 tonnes d’équivalent CO2 par habitant, respectivement. Malgré la hausse des émissions globales de CO2, 29 pays évalués par le CDI ont abaissé leurs émissions directes par habitant dans les données les plus récentes. Les mesures d’incitation autour des combustibles fossiles se sont également dégradées. Les subventions directes dont font l’objet la production et la consommation de combustibles fossiles sont passés d’une moyenne de 0,72 à 0,78 pour cent du RNB. Le Chili représentait le plus petit pourvoyeur de subventions, avec pratiquement aucune subvention pour le charbon, le pétrole, le gaz et l’électricité. Le prix moyen du carbone parmi les pays évalués par le CDI a chuté d’un coût supplémentaire de 10,75 $ à 10,08 $ par tonne de CO2 émis.
Santé
La pandémie de la COVID-19 a mis nettement en évidence la nature transfrontalière des flambées épidémiques, les répercussions des décisions de politique intérieure et la nécessité d’une collaboration internationale. Les politiques « en temps de paix » comptent toutefois également. Les risques posés par la croissance de la résistance antimicrobienne menacent de nombreuses vies au-delà des frontières nationales. Le CDI récompense les pays de leurs efforts à prévenir les maladies, y compris par la vaccination, la préparation aux pandémies et la gestion des antimicrobiens. Les pays sont pénalisés en cas de restriction des exportations d’articles médicaux et d’aliments et en cas non mise en œuvre de normes élevées dans le commerce du tabac.
La Finlande, la Suède et le Japon se classent en tête dans la composante « Santé ». Conjointement avec l’Australie, la Nouvelle Zélande, le Canada, le Chili, le Mexique et les Émirats arabes unis, ils ont tendance à éviter les restrictions à l’exportation sur les principaux aliments et produits de santé.
Figure 2. Restrictions des aliments et des produits de santé
Parallèlement, la France et le Royaume-Uni ont les règlementations les plus strictes en matière de commerce international du tabac.
Sécurité
La sécurité et le développement sont étroitement liés. La guerre et la violence politique peuvent détruire les moyens de subsistance et les institutions publiques, tandis que la pauvreté et la faiblesse des institutions favorisent l’éruption de la violence. Le CDI récompense les pays qui contribuent aux opérations de maintien de la paix et aux interventions humanitaires, positionnent des flottes militaires pour sécuriser les voies maritimes et participent aux systèmes de sécurité internationaux encourageant la non-prolifération de l’armement, le désarmement et l’État de droit international. Le CDI pénalise les pays qui exportent des armes, en particulier à destination des régimes non démocratiques, et qui omettent de publier des données sur le commerce d’armes.
Le Royaume-Uni est le chef de file en matière de sécurité en tant que contributeur important à la protection des voies maritimes et aux opérations internationales de maintien de la paix. La Slovaquie se classe au deuxième rang en matière de soutien au maintien de la paix par rapport à la taille de son économie. En sixième position, les États-Unis fournissent la plus grande part de leur RNB à la protection des voies maritimes internationales.
Les Émirats arabes unis, Israël et la Russie occupent les dernières places en matière de sécurité. Israël et les Émirats arabes unis exportent chacun des armes pour une valeur représentant plus de 1 pour cent de leurs RNB. Les Émirats arabes unis, suivis de près par la Chine, arrivent en queue de peloton, dans la mesure où ces deux nations envoient la plus grande part de leurs armes aux pays pauvres, antidémocratiques et militaires.
Technologie
La technologie est essentielle au développement économique et humain. Les progrès réalisés dans le domaine de la médecine, des technologies de l’information et de la communication, les énergies renouvelables et les technologies agricoles contribuent à améliorer la qualité de vie dans le monde entier. Le CDI récompense les politiques stimulant la création de technologies et favorisant les flux internationaux de connaissances.
L’Australie, la Corée du Sud et le Luxembourg sont les plus performants en matière de technologie. En matière de création de technologies, la Corée du Sud et le Luxembourg atteignent des scores élevés en donnant d’importantes allocations budgétaires publiques à la R&D alors que la France obtient le meilleur score en offrant des incitations fiscales à la R&D privée.
Concernant les transferts de technologie, le Luxembourg et l’Australie acceptent le nombre le plus important d’étudiants étrangers lorsqu’il est pondéré par le niveau de pauvreté du pays d’origine. Dans l’indicateur mesurant les efforts par les chercheurs d’un pays à co-écrire des publications avec des partenaires dans des pays en voie de développement, l’Arabie Saoudite, l’Afrique du Sud et les Émirats arabes unis arrivent en premier.
En ce qui concerne les droits de propriété intellectuelle, les pays en dehors de l’OCDE, notamment la Chine, l’Indonésie et l’Arabie Saoudite, mènent la danse en n’exigeant pas de leurs homologues qu’ils acceptent des droits de propriété intellectuelle plus stricts que ceux déjà intégrés dans les règles de l’Organisation mondiale du commerce.
Concernant les rapports des pays et les résultats complets
Rendez-vous sur le site cgdev.org/cdi pour en savoir plus sur l’Indice de l’engagement pour le développement, y compris les rapports par pays, le portail Web interactif, les calculs complets et le document de méthode.
À propos du CDI
L’Indice de l’engagement pour le développement est compilé chaque année depuis 2003 par le Center for Global Development (CGD). Le CGD œuvre à réduire la pauvreté mondiale et à améliorer les conditions de vie par le biais de recherches économiques novatrices qui promeuvent de meilleures politiques et pratiques de la part des décideurs mondiaux de premier plan. Ian Mitchell dirige les activités du CDI, avec une contribution majeure de Lee Robinson, Beata Cichocka, Sam Hughes et Euan Ritchie. Le CDI 2021 s’appuie sur les travaux des éditions précédentes d’Anita Käppeli, Owen Barder et David Roodman. Le CDI bénéficie du soutien financier du programme de développement efficace du CGD Europe, notamment les contributions des gouvernements de l’Australie, du Canada, de l’Allemagne, du Luxembourg et de la Suède. Le CDI ne reflète pas la position officielle des bailleurs de fonds. Les auteurs sont responsables de toutes les décisions méthodologiques et des informations et opinions exprimées dans le présent document.
Topics
CITATION
Mitchell, Ian, Lee Robinson, Beata Cichocka, and Euan Ritchie. 2021. The Commitment to Development Index 2021. Center for Global Development.DISCLAIMER & PERMISSIONS
CGD's publications reflect the views of the authors, drawing on prior research and experience in their areas of expertise. CGD is a nonpartisan, independent organization and does not take institutional positions. You may use and disseminate CGD's publications under these conditions.