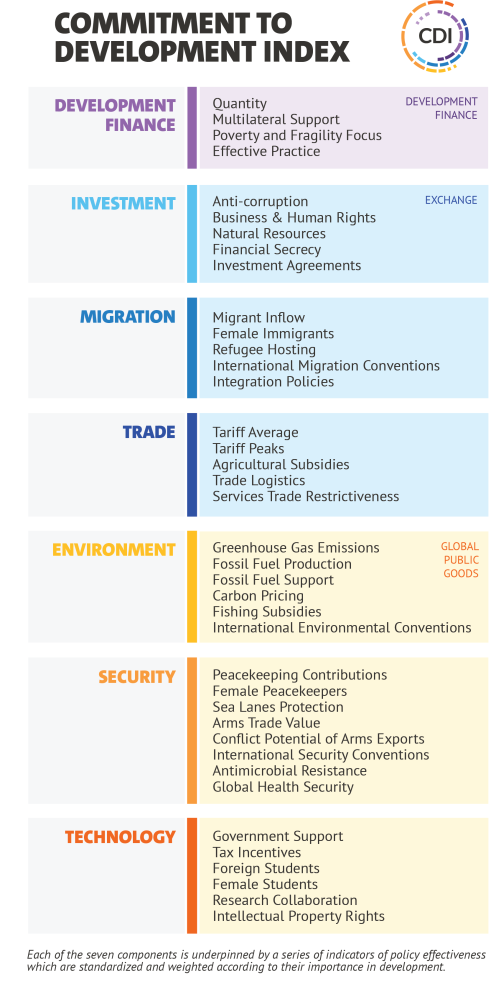
The Commitment to Development Index (CDI) ranks 40 of the world’s most powerful countries on policies that affect more than five billion people living in poorer nations. Because development is about more than foreign aid, the Index covers seven distinct policy areas:
- Development Finance
- Investment
- Migration
- Trade
- Environment
- Security
- Technology
Why Does Commitment to Development Matter?
In our integrated world, decisions made by the richest countries about their own policies and behaviour have repercussions for people in lower-income nations. At the same time, greater prosperity and security in poorer countries benefit the whole world. They create new economic opportunities, increase innovation, and help reduce risks posed by public health, security, and economic crises. The CDI looks at 40 countries with some of the largest economies and celebrates those with policies that benefit not only themselves, but also the development of others and our common good.
How Do We Calculate the Commitment to Development Index?
We use thousands of data points across more than 50 indicators to come up with overall rankings and for each of the seven policy components. Countries score well for things like generous and high-quality finance for development, transparent investment, low barriers to trade for developing countries, and migration policies which are open and promote integration. They also do well for policies that enhance global public goods, such as robustly supporting technological research and development, protecting the environment, and contributing to global security.
Like the Sustainable Development Goals, the CDI recognizes development progress is holistic. But while the SDGs focus on outcomes and all nations, the CDI emphasizes how the policies of the richest countries can make a huge difference.
CDI 2020 Results: How Well Are Countries Doing?
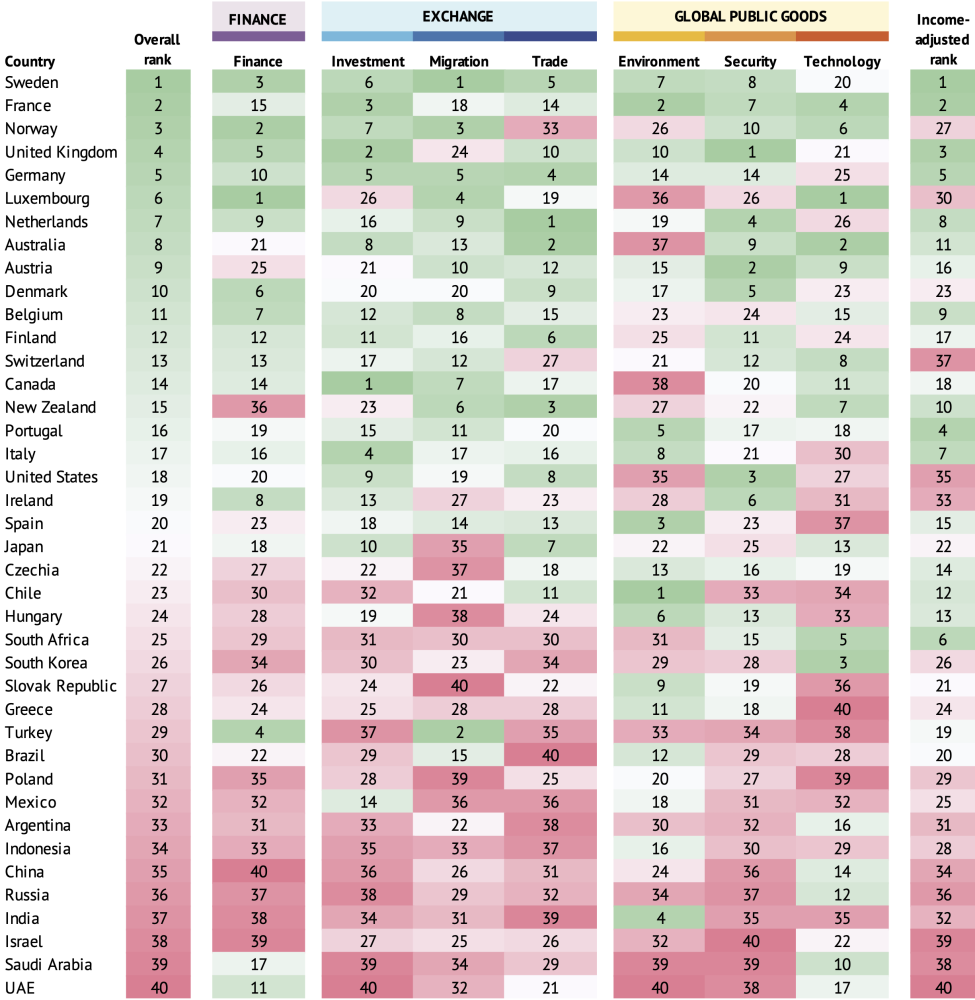
Sweden tops this year’s CDI, followed by France in second, and Norway in third place. Sweden scores well across six out of seven components of the CDI, ranking first on migration, third on development finance, and in the top 10 on trade, investment environment, and security. Still, it has room for improvement on technology, where it ranks 20th.
France comes second, ranking second on environment and third on investment but with mid-table scores on development finance and migration. Norway takes third place with strong scores on development finance and migration but room for improvement on trade and environment. The UK and Germany complete the top five, the former topping the security component but with room for improvement on migration and technology, and the latter strong on investment, migration, and trade but scoring less well on environment, security, and technology.
Development leadership within and beyond the G20
This year we expanded the CDI to reflect the importance of large countries within and beyond the G20 in the global economy and their influence on development in poorer countries. Nine countries we assess—Argentina, Brazil, China, India, Indonesia, Mexico, Russia, South Africa, and Turkey—are classified as middle-income. We maintain our traditional approach of measuring policy contributions relative to economic (or population) size to enable comparisons but we also produce income-adjusted results to recognise that responsibility rises with income.
Amongst the middle-income countries, South Africa ranks highest in 25th position, with a top-five score on technology and a top-half ranking on security. Turkey is next highest in 29th—its major contribution to supporting refugees within its borders puts it second on migration; and it ranks fourth on development finance. It earns weaker scores in technology, trade and investment.
Chile is also included in the CDI for the first time, ranking 23rd. It tops the environment component with virtually no subsidies for fossil fuels and low greenhouse gas emissions; it also scores well on trade.
Portugal, South Africa, Chile, and Hungary rise in income-adjusted scores
Given the widely varying incomes of the countries we assess, we also calculate an income-adjusted score which considers how countries perform relative to an “expected score” based on their income level. Sweden also tops this ranking—its score is the furthest above the expected score for a county at its income level. Under this method, four countries—Portugal, South Africa, Chile, and Hungary—improve their rank by more than 10 places to 4th, 6th, 12th, and 13th, respectively. Moving the other way, Norway, Luxembourg, and Switzerland fall significantly in the income-adjusted rankings (to 27th, 30th, and 37th respectively), suggesting they could do more based on their very high income levels.
China’s development contribution
China, the world’s second-largest economy, ranks 35th overall in how its policies contribute to development relative to its size. Surprisingly, while China is a major lender to developing countries, it ranks last on development finance, largely because our measure looks at the degree of subsidy in China’s annual lending rather than the significant face value of China’s loans. China is among the 10 largest providers in absolute terms, but this is low relative to its economy size. China’s development finance also scores poorly on our quality measure.
China ranks in the top half on technology, with large tax incentives for research and low restrictions on intellectual property in its trade deals. On environment, China ranks 24th—its greenhouse gas emissions per head are lower than most (see figure 2) though it continues to produce coal and has not signed on to several environment treaties.
COVID-19 and global health security
The CDI measures several areas related to preventing and mitigating global disease spread, highly relevant as the world grapples with the COVID-19 pandemic. Within development finance, it rewards support to the multilateral system, including the World Health Organization and GAVI, the Vaccine Alliance. In technology, it rewards public research and development (R&D) support, on which South Korea spends the most. On trade, we mark down countries for trade restrictions. We added two measures in security on health—on antimicrobial resistance and on capability to prevent, detect, and respond to threats; the Netherlands scores well across both measures.
New indicators on gender and conflict potential
This year’s CDI includes several new measures, including four assessing the promotion of gender equality with a focus beyond aid. The United States has the highest share of female migrants, at 54 percent. Argentina accepts the highest proportion of female international students, at 60 percent. At 18 percent, Australia scores best on female peacekeepers, who evidence suggests make distinct and positive contributions. We also reward the 28 countries that ratified the UN Resolution on Women, Peace, and Security.
Another new measure is on the “conflict potential” of arms sales alongside a measure of the value. Conflict potential measures sales to countries which are militarised, undemocratic, and poor. Luxembourg top this measure, with the smallest share of arms reaching such destinations, while Russia finishes last. China, Canada, and Israel could all reconsider whom they sell arms to.
Development Finance and International Exchange
Development Finance Quantity and Quality
Providing grants or finance to developing countries on concessional terms remains an important part of development policy. To measure the quantity of development finance consistently across OECD and other countries, we developed the “Finance for International Development” (FID) measure. We also assess the quality of development finance, with credit for contributions through the multilateral system and bilateral indicators assessed under two categories: focus on poor or fragile countries, and effective practices.
Development finance plays a critical role in saving lives and helping life millions out of extreme poverty. Let’s protect and expand this vital investment. #CDI2020 @CGDev
Tweet ThisFigure 1. Finance for International Development (FID) as a share of national income (2017)
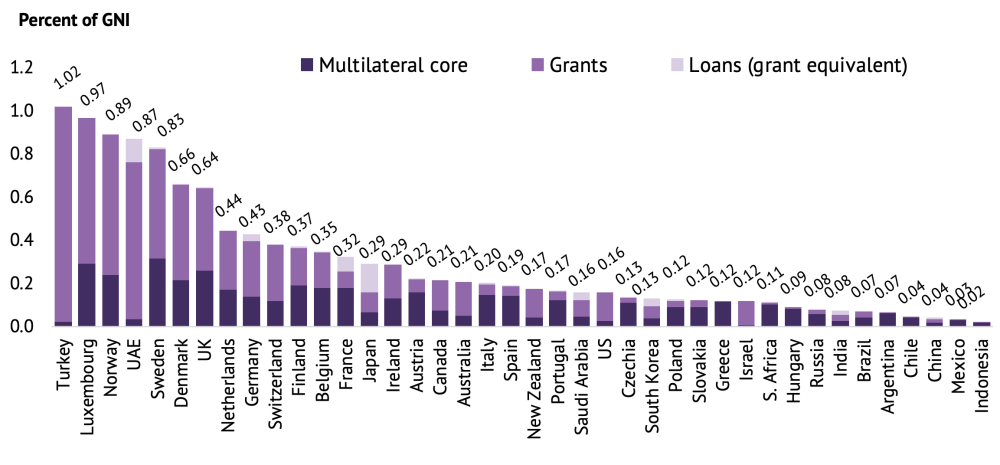
Source: Finance for International Development, Mitchell, Ritchie and Rogerson, Center for Global Development (2020)
Luxembourg tops the development finance component, scoring well on both quantity (providing just under 1 percent of GNI as FID) and quality. Turkey provides the most relative to its GNI, and as Syria receives most of its development finance, its scores well on the poverty and fragility focus. The United Arab Emirates is also generous (providing 0.9 percent of GNI) but gives more to middle-income countries and so performs less well on quality. Belgium and Ireland top the quality subcomponent based on their strong focus on poor countries.
China scores poorly on both quantity and quality. Although financial flows from China are large, the concessionality of these flows is either low or in doubt. China is the least transparent provider of finance, and its finance is explicitly tied to Chinese supplies.
The United States comes in mid-table on development finance, at 20th. It provides the most development finance in absolute terms; it is less generous relative to the size of its economy, providing 0.16 percent of GNI.
Investment
Foreign direct investment is the largest source of financing for many developing countries. The CDI rewards countries for policies that support investment and for signing on to international commitments (including preventing bribery and safeguarding human rights) but do not undermine partner countries’ ability to develop sustainable public policy. Countries are penalised for policies that allow financial secrecy, which enables tax evasion, money laundering, and corruption, and degrades governance and international security.
Foreign investment may be the largest source of financing in most developing countries, but its impact can be small without sustainable and transparent policies. #CDI2020 @CGDev
Tweet ThisCanada ranks first on investment thanks to its development-friendly bilateral investment agreements. Mexico also scores strongly on its agreements and is the highest placed middle-income country on investment. Spain is the most transparent financial jurisdiction, followed by Belgium and France, while the United Arab Emirates and Turkey are the most secretive.
Migration
Labour mobility can be a powerful tool for poverty reduction. By migrating to richer countries, workers can increase their productivity and earn higher incomes. Migrants send billions of dollars home each year, a flow that surpasses foreign aid. The CDI rewards countries for welcoming migrants from poorer countries, receiving a high share of female migrants, accepting refugees, embracing sound migrant integration policies, and joining international conventions protecting the rights of migrants.
Migrant remittances are the largest single source of international development finance, sending billions back home, a flow surpassing foreign aid. Let’s prosper together. #CDI2020 @CGDev
Tweet ThisSweden scores highest overall on the migration component. It welcomed the largest number of migrants relative to its population (with a higher weight for migrants from poorer countries) and the second largest number of refugees relative to population; it also scores highest on its integration policies. Turkey comes second by hosting a significant number of refugees relative to its population (45 per 1,000 population, or over 10 times the CDI average of 4.4).
Eastern European countries occupy the bottom three spots, with Slovak Republic last below Poland and Hungary. Each has low migrant numbers and low shares of female migrants.
Trade
Trade provides poorer countries with opportunities to attract investment, create jobs, and reduce poverty. Large economies dominate global trade, with some goods and services from poorer countries still facing trade barriers. Tariffs and subsidies create an uneven playing field for agricultural goods, and red tape and legal restrictions make trade harder for developing countries.
Good trade practices attract investments, create jobs, and reduce poverty – something we can all benefit from. #CDI2020 @CGDev
Tweet ThisThe Netherlands scores highest on trade with low tariffs and agricultural subsidies, strong logistics, and openness to trade in services. Australia and New Zealand rank second and third respectively.
Brazil, India, and Argentina are at the bottom of the trade component. They have high tariffs after weighting tariffs against poorer countries more heavily. On agricultural subsidies, countries outside of Europe are leading the way. South Africa, Argentina, Brazil, Chile, and Indonesia join New Zealand and Australia in providing subsidies which are under 3 percent of agricultural output and well below the all-country average of 13 percent.
Global Public Goods
Environment
Higher-income countries contribute most to climate change, but poorer countries will suffer most. They are more susceptible geographically, have fewer resources and less state capacity to deal with the effects, and many more of their people depend directly on the environment to meet their daily needs. The CDI scores countries on how low their greenhouse gas (GHG) emissions are; their production and subsidy levels of fossil fuels; the extent to which carbon emissions are priced; whether they avoid subsidies to fishing and also on signing up to environmental treaties.
Those who contribute the least will be impacted the most by climate change. Better environmental policies benefit us all. #CDI2020 @CGDev
Tweet ThisChile is the best performer on environmental policies. It gives negligible subsidies to fossil fuel industries, and with India, it has the lowest emissions per capita. Sweden and Finland have the highest prices on carbon but their emissions per capita were higher than those in the top 10. France prices carbon highly and signed all the major environment treaties but is held back by its subsidies to fishing and fossil fuels industries.
The bottom places are all major fuel-producing countries. The United Arab Emirates is last due to having the highest GHG emissions, and fossil fuel production and subsidies, and no price on carbon. Saudi Arabia and Canada are 39th and 38th respectively.
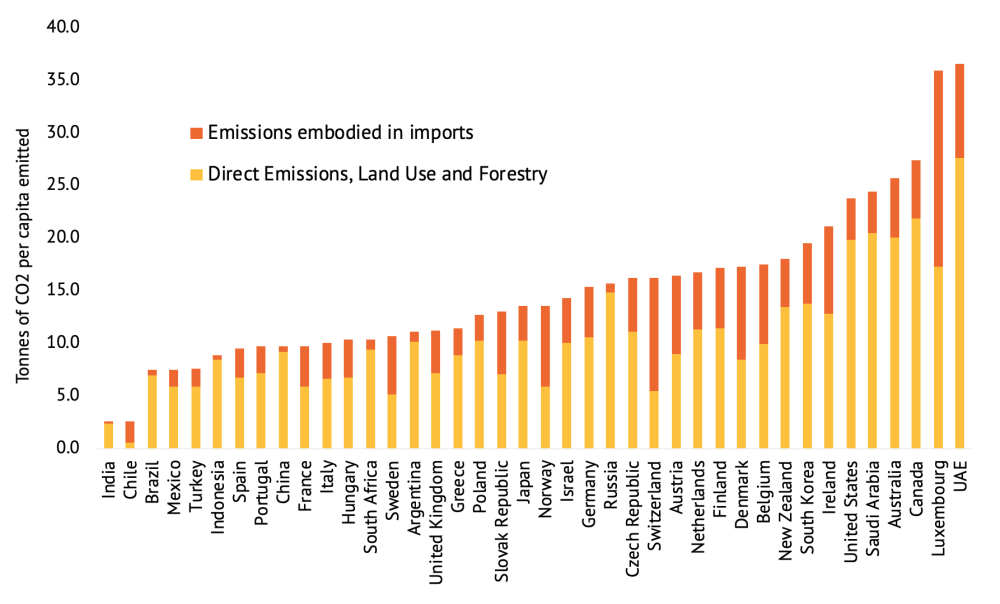
Source: CGD analysis of Potsdam Institute for Climate Research, UN Food and Agriculture, and OECD data.
Security
Security and development are closely linked. War and political violence can destroy livelihoods and public institutions, while poverty and institutional weakness make it easier for violence to erupt. The CDI rewards countries for contributing to peacekeeping and humanitarian interventions, basing naval fleets where they can secure sea lanes, and participating in international security regimes that promote non-proliferation, disarmament, and international rule of law. The CDI penalizes countries for arms exports, especially to nations with undemocratic regimes, and for not publishing data on arms exports.
In 2020, we add a global health subcomponent, which measures efforts to prevent antimicrobial resistance and policy capability to prevent, detect, and respond to threats. The Netherlands does best on efforts to curb antimicrobial resistance, with low antibiotic consumption and good governance on antibiotic use.
Wealthy countries have the power to strengthen or degrade the security of people in developing countries. Peacekeeping and humanitarian interventions mean we ALL benefit. #CDI2020 @CGDev
Tweet ThisThe United Kingdom leads on security as a significant contributor to sea lanes protection and as a leader on global health. Austria ranks second with the highest support to peacekeeping relative to the size of its economy. The United States comes third and provides the largest proportion of GNI to international sea lanes protection. Japan exports the fewest arms relative to its economy.
Israel, Saudi Arabia, and the United Arab Emirates place at the bottom on security. Israel has the highest value of arms exports relative to the size of its economy at 1.9 percent of its GNI. In a new measure, we consider the conflict potential of arms exports. Russia and China come bottom, sending the highest shares of their arms to poor, undemocratic, and militaristic countries.
Technology
Technology is critical to economic and human development. New technologies reduce the prices of goods and services, making them more accessible. Advances in medicines, information and communication technology, sustainable energy, and agricultural technology help raise the quality of life worldwide. Developed economies with strong research networks and technological bases can play an important role in creating and diffusing knowledge worldwide. The CDI penalises countries for policies that can inhibit the international flow of innovations and rewards government support for R&D.
Luxembourg, Australia, and South Korea are top performers on the technology component. Each commits above-average levels of government funding for R&D. South Korea’s direct government support to R&D reaches 0.98 percent of GNI. Meanwhile, France scores top on tax incentives—its policy environment provides supports to business expenditures on R&D worth 0.54 percent of GNI.
On technology transfers, Luxembourg and Australia accept the most significant share of foreign students when weighted by the poverty of the country of origin. In a new measure, we consider efforts by a country’s researchers to co-author outputs with partners in developing countries. On this, South Africa comes top.
Technology not only drives development; it can save lives. #CDI2020 @CGDev
Tweet ThisGreece ranks last on technology with limited government support to R&D and few foreign students.
On intellectual property rights, countries outside the EU, including China, Indonesia and Switzerland are leading by not requiring their counterparts to agree to more stringent intellectual property rights than those already embodied in World Trade Organization rules.
Commitment to Development Index 2020
For Country Reports and Full Results
Visit cgdev.org/cdi to explore the Commitment to Development Index, including full country reports, interactive web portal, full calculations, and method paper.
About the CDI
The Center for Global Development has compiled the Commitment to Development Index annually since 2003. CGD works to reduce global poverty and improve lives through innovative economic research that drives better policy and practice by the world’s top decision makers. Ian Mitchell directs the CDI with significant contributions from Lee Robinson, Beata Cichocka, and Euan Ritchie. The 2020 CDI builds on the work in earlier editions by Anita Käppeli, Owen Barder, and David Roodman. The CDI is supported by funding for CGD Europe’s development effectiveness programme, including contributions from the governments of Australia, Germany, Luxembourg, Norway, and Sweden. The CDI does not reflect the official opinion of funders. The authors are responsible for all methodological decisions and for the information and views expressed here.
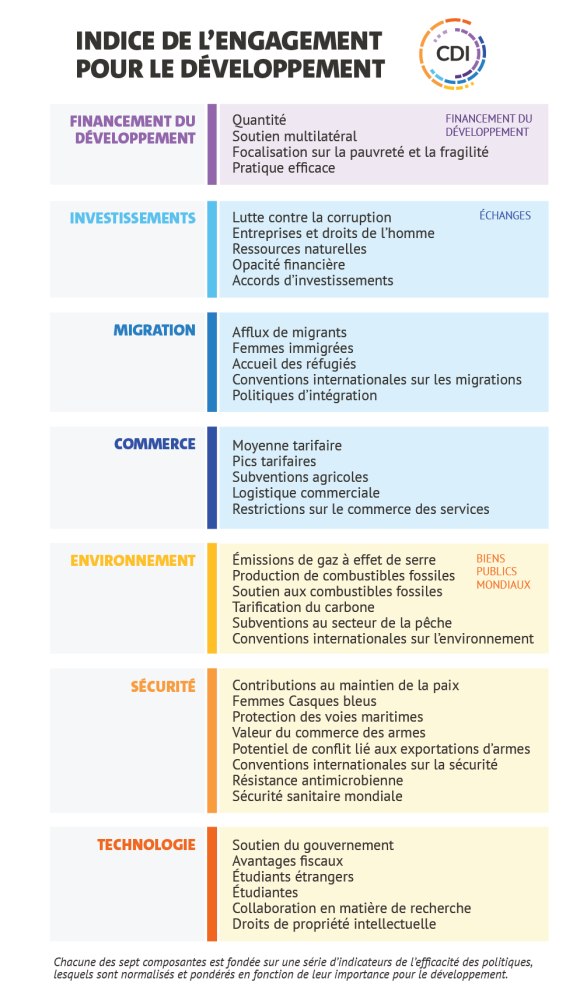
L’Indice de l’engagement pour le développement (Commitment to Development Index, CDI) classe 40 des pays les plus puissants sur la base des politiques qu’elles instaurent et qui ont une incidence sur plus de cinq milliards de personnes vivant dans les pays plus pauvres. L’aide au développement ne se limitant pas à l’aide internationale, l’Indice couvre sept domaines de politiques distincts :
- Financement du développement
- Investissements
- Migration
- Commerce
- Environnement
- Sécurité
- Technologie
Pourquoi l’engagement pour le développement est-il important ?
Compte tenu de l’intégration mondiale actuelle, les décisions des pays riches en matière de politique et leur comportement ont des répercussions sur les populations des pays à faibles revenus. De la même façon, une prospérité et une sécurité accrues dans les pays les plus pauvres profitent au monde entier. Ces conditions créent de nouvelles opportunités économiques, stimulent l’innovation, contribuent à la réduction des risques sanitaires et sécuritaires ainsi que les crises économiques. Le CDI se focalise sur 40 nations, dont certaines des plus grandes économies mondiales. Il met à l’honneur les pays dont les politiques ne visent pas seulement leurs propres intérêts, mais aussi le développement des autres et l’intérêt général.
Comment l’Indice de l’engagement pour le développement est-il calculé ?
Nous utilisons des milliers de données provenant d’une cinquantaine d’indicateurs pour établir les classements globaux et pour chacune des sept composantes de la politique. Les pays obtiennent de bonnes notes dans les domaines suivants : financement du développement de bonne qualité, transparence des investissements, faibles barrières commerciales favorisant les échanges avec les pays en développement et politiques migratoires ouvertes et encourageant l’intégration. Sont également mises à l’honneur les politiques qui améliorent les biens publics mondiaux, notamment à travers un soutien solide envers la recherche et le développement technologiques, la protection de l’environnement et les contributions à la sécurité mondiale.
À l’instar des objectifs de développement durable (ODD), le CDI reconnait que les avancées en matière de développement sont globales. Cependant, alors que les ODD se concentrent sur les résultats et sur tous les pays, le CDI met l’accent sur la façon dont les politiques des pays les plus riches peuvent faire une énorme différence.
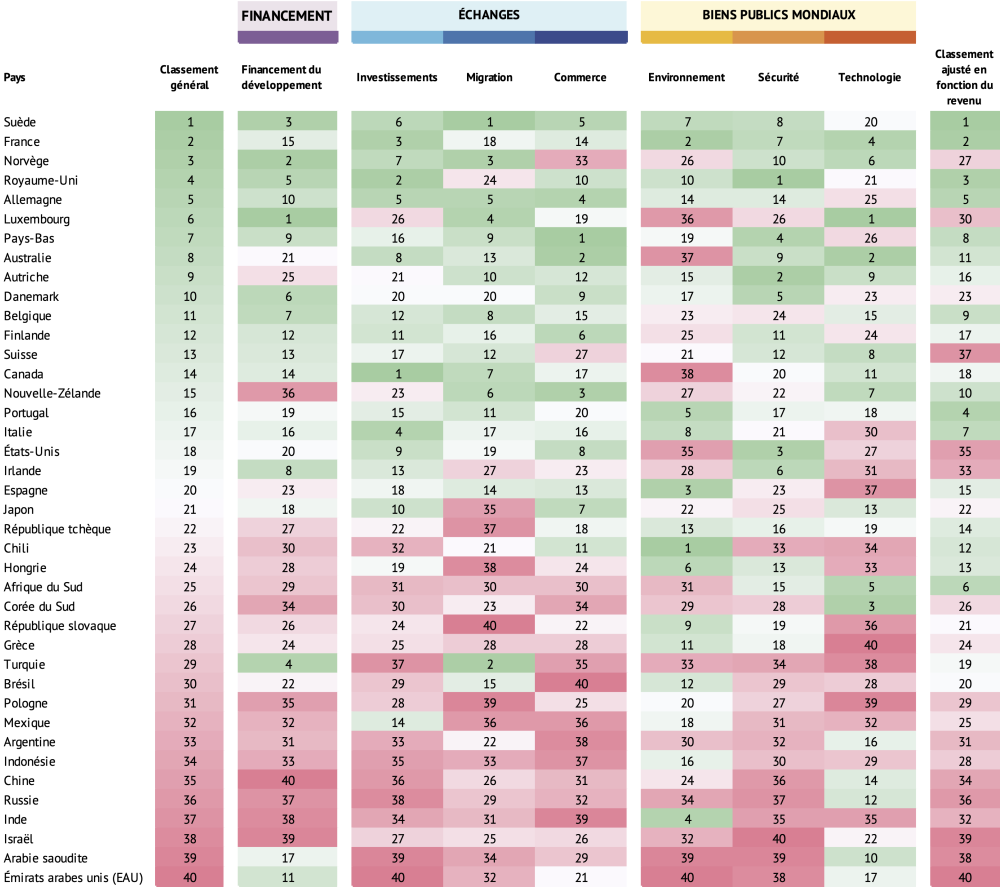
Quels sont les résultats des pays évalués par le CDI 2020 ?
La Suède est en tête du CDI cette année, suivie par la France en deuxième position et la Norvège qui complète le podium. La Suède obtient une bonne note dans six des sept composantes du CDI : elle se classe première dans le domaine de la migration, troisième en matière de financement du développement et figure dans le top 10 pour le commerce, les investissements, l’environnement et la sécurité. Le pays a tout de même une marge de progression en matière de technologie, domaine dans lequel il se classe seulement 20ème.
La France se place en deuxième position. Elle se classe deuxième en matière d’environnement et troisième en matière d’investissements, mais obtient des scores moyens en termes de financement du développement et de migration. La Norvège occupe quant à elle la troisième place du podium avec des scores élevés en matière de financement du développement et de migration, mais des améliorations sont possibles en termes de commerce et d’environnement. Le Royaume-Uni et l’Allemagne complètent ce top 5. Le Royaume-Uni est en tête dans le domaine de la sécurité mais a une marge d’amélioration en termes de migration et de technologie, tandis que l’Allemagne obtient de solides résultats en matière d’investissements, de migration et de commerce, mais de moins bonnes notes en termes d’environnement, de sécurité et de technologie.
Leadership en matière de développement au sein du G20 et au-delà
Cette année, nous avons élargi le CDI pour tenir compte de l’importance des grands pays au sein du G20 et au-delà envers l’économie mondiale, et l’influence qu’ils exercent sur le développement dans les pays plus pauvres. Neuf pays évalués (l’Argentine, le Brésil, la Chine, l’Inde, l’Indonésie, le Mexique, la Russie, l’Afrique du Sud et la Turquie) figurent parmi les pays à revenu intermédiaire. Nous conservons notre approche traditionnelle d’évaluation des contributions politiques par rapport à la taille de l’économie (ou de la population) pour permettre d’établir des comparaisons, mais nous produisons également des résultats ajustés en fonction du revenu pour tenir compte du fait que la responsabilité augmente avec le revenu.
Parmi les pays à revenu intermédiaire, l’Afrique du Sud se classe au 25ème rang. Elle se hisse dans le top 5 en matière de technologie et dans la moitié supérieure du classement en termes de sécurité. La Turquie se classe 29ème. Sa contribution majeure à l’aide aux réfugiés au sein de ses frontières la place au deuxième rang en matière de migration, tandis qu’elle occupe la quatrième place en matière de financement du développement. La Turquie obtient toutefois des scores plus faibles en matière de technologie, de commerce et d’investissements.
Le Chili figure également pour la première fois dans le CDI, en 23ème position. En n’accordant pratiquement aucune subvention pour les énergies fossiles, le pays arrive en tête de la composante « Environnement », et se démarque également pour ses faibles émissions de gaz à effet de serre. Il obtient également de bons résultats en matière de commerce.
Le Portugal, l’Afrique du Sud, le Chili et la Hongrie améliorent leur score ajusté en fonction du revenu
Compte tenu des revenus très variables des pays que nous évaluons, nous calculons également un score ajusté en fonction du revenu qui tient compte de la performance des pays par rapport à un « score attendu » basé sur leur niveau de revenu. La Suède est également en tête de ce classement : son score est largement supérieur au score attendu pour une nation ayant son niveau de revenu. Selon cette méthode, quatre pays (le Portugal, l’Afrique du Sud, le Chili et la Hongrie) améliorent leur classement de plus de 10 places et se positionnent respectivement 4ème, 6ème, 12ème et 13ème. À l’inverse, la Norvège, le Luxembourg et la Suisse chutent considérablement dans les classements ajustés en fonction du revenu (ces trois pays se classent respectivement 27ème, 30ème et 37ème), ce qui laisse entendre qu’ils pourraient faire davantage sur la base de leur niveau de revenu très élevé.
Contribution de la Chine au développement
Deuxième économie mondiale, la Chine se classe globalement 35ème dans la manière dont ses politiques contribuent au développement par rapport à sa taille. Bien que la Chine soit un important bailleur de fonds pour les pays en développement, elle occupe curieusement la dernière place en matière de financement du développement. Cela est en grande partie dû au fait que notre mesure examine le degré de subvention des prêts annuels de la Chine plutôt que la valeur nominale importante des prêts consentis par le pays. La Chine figure parmi les dix bailleurs de fonds les plus importants en termes absolus, mais ce chiffre est faible par rapport à la taille de son économie. En matière de financement du développement, la Chine enregistre également un score médiocre par rapport à notre mesure de qualité.
La Chine se positionne dans la moitié supérieure du classement en matière de technologie, avec d’importants avantages fiscaux pour la recherche et de faibles restrictions sur la propriété intellectuelle dans le cadre de ses accords commerciaux. En matière d’environnement, la Chine se classe 24ème. Ses émissions de gaz à effet de serre par habitant sont inférieures à la plupart des autres nations (cf. Figure 2), bien qu’elle continue à produire du charbon et qu’elle n’ait pas ratifié plusieurs traités environnementaux.
La COVID-19 et la sécurité sanitaire mondiale
Le CDI s’intéresse à plusieurs domaines liés à la prévention et à l’atténuation de la propagation des maladies à l’échelle mondiale, ce qui est particulièrement pertinent alors que le monde lutte toujours contre la pandémie de COVID-19. Dans le cadre du financement du développement, l’Indice récompense le soutien en faveur du système multilatéral, notamment l’Organisation mondiale de la Santé et GAVI, l’Alliance du Vaccin. En matière de technologie, il récompense le soutien public à la recherche et au développement, domaine dans lequel la Corée du Sud dépense le plus. En ce qui concerne le commerce, nous appliquons une décote aux pays qui instaurent des restrictions commerciales. Nous avons ajouté deux mesures de sécurité dans le domaine de la santé : la résistance antimicrobienne et la capacité à prévenir, détecter et répondre aux menaces. Les Pays-Bas obtiennent de très bons résultats pour ces deux mesures.
Nouveaux indicateurs en matière de sexe et de risque de conflit
Cette année, le CDI comprend de nouvelles mesures, dont quatre qui évaluent la promotion de l’égalité des sexes, au-delà de la simple assistance. Les États-Unis ont le pourcentage le plus élevé de femmes migrantes (54 %). L’Argentine accepte la plus forte proportion d’étudiantes étrangères (60 %). Avec 18 % de ses effectifs, l’Australie obtient la meilleure note pour la présence de la gent féminine chez les Casques bleus, qui semble apporter des contributions distinctes et positives. Nous mettons également à l’honneur les 28 pays qui ont ratifié la résolution des Nations Unies sur les femmes, la paix et la sécurité.
Une autre nouvelle mesure concerne le « risque de conflit » lié aux ventes d’armes, ainsi qu’une mesure de la valeur. Le risque de conflit mesure les ventes d’armes aux pays militarisés, antidémocratiques et pauvres. Le Luxembourg arrive en tête de cette mesure, avec le plus faible pourcentage d’armes atteignant ces nations, tandis que la Russie termine en dernière position. La Chine, le Canada et Israël pourraient tous revoir leur position en ce qui concerne les nations auxquelles ils vendent des armes.
Financement du développement et échanges internationaux
Quantité et qualité du financement du développement
L’octroi de subventions ou de financements à des pays en développement à des conditions préférentielles reste un élément majeur de la politique de développement. Pour mesurer la quantité de la composante « Financement du développement » de manière cohérente dans l’ensemble de l’OCDE et pour les autres pays, nous avons mis au point la mesure « Financement du développement international » (FDI). Nous évaluons également la qualité de la composante « Financement du développement », en tenant compte des contributions apportées par le biais du système multilatéral et des indicateurs bilatéraux évalués selon deux catégories : l’accent mis sur les pays pauvres ou fragiles et les pratiques efficaces.
Le financement du développement joue un rôle crucial pour sauver des vies et permet à des millions de personnes de sortir de l’extrême pauvreté. Protégeons et développons cet investissement vital. #CDI2020 @CGDev
Tweet ThisFigure 1. Financement du développement international (FDI) en tant que part du revenu national (2017)
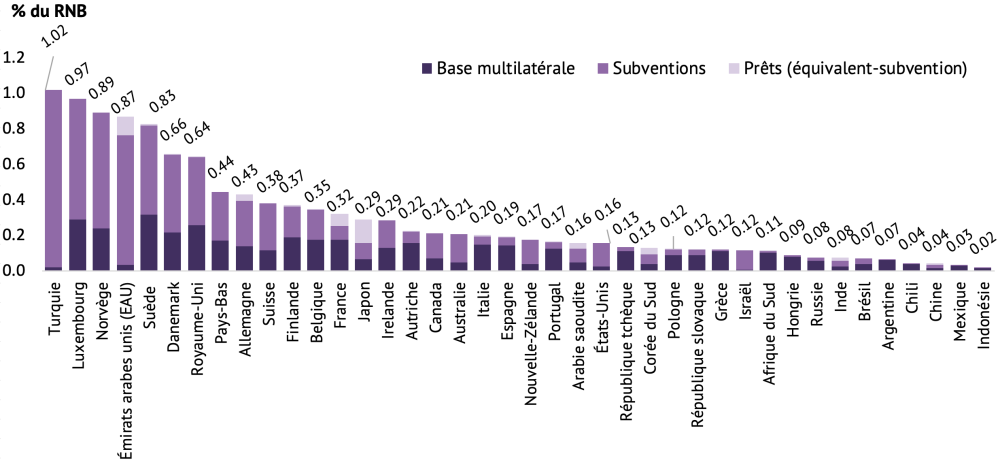
Source : Financement du développement international (en anglais), Mitchell, Ritchie et Rogerson, Center for Global Development (2020)
Le Luxembourg arrive en tête de la composante « Financement du développement », avec un bon score à la fois en termes de quantité (le pays fournit un peu moins de 1 % du RNB sous forme de FDI) et de qualité. La Turquie fournit quant à elle le montant le plus élevé par rapport à son RNB, et comme la Syrie reçoit la majeure partie de son financement du développement, elle obtient de bons scores en termes de pauvreté et de fragilité. Les Émirats arabes unis sont également généreux (fournissant 0,9 % du RNB) mais donnent davantage aux pays à revenu intermédiaire et obtiennent donc de moins bons résultats en termes de qualité. La Belgique et l’Irlande se classent en tête de la sous-composante « Qualité », dans la mesure où ces deux nations axent principalement leurs efforts sur les pays pauvres.
La Chine obtient de mauvais résultats en termes de quantité et de qualité. Bien que les flux financiers en provenance de Chine soient importants, le degré de faveur de ces flux est faible ou douteux. La Chine est le bailleur de fonds le moins transparent, et son financement est explicitement lié aux approvisionnements chinois.
Les États-Unis arrivent en milieu de tableau en termes de financement du développement, à la 20ème place. Le pays fournit le plus important financement du développement en termes absolus, mais il est moins généreux par rapport à la taille de son économie, puisqu’il fournit seulement 0,16 % de son RNB.
Investissements
Les investissements directs étrangers sont la principale source de financement pour de nombreux pays en développement. Le CDI récompense les pays dont les politiques soutiennent les investissements et ceux qui signent des engagements internationaux (notamment de prévention de la corruption et de protection des droits de l’homme), le tout sans nuire à la capacité des pays partenaires à développer des politiques publiques durables. Les pays sont pénalisés lorsqu’ils suivent des politiques permettant une opacité financière, ce qui favorise l’évasion fiscale, le blanchiment d’argent et la corruption, ce qui nuit à la gouvernance et à la sécurité internationale.
L’investissement étranger constitue peut-être la principale source de financement dans la plupart des pays en développement, mais, sans politiques durables et transparentes, son impact peut être limité. #CDI2020 @CGDev
Tweet ThisLe Canada se classe en première position en matière d’investissements grâce à ses accords bilatéraux d’investissements favorables au développement. Le Mexique obtient également de bons résultats grâce à ses accords. Il s’agit du pays à revenu intermédiaire le mieux placé en matière d’investissements. L’Espagne est la juridiction la plus transparente d’un point de vue financier, suivie par la Belgique et la France, tandis que les Émirats arabes unis et la Turquie sont les nations les moins transparentes.
Migration
La mobilité de la main-d’œuvre peut être un puissant outil pour réduire la pauvreté. En partant travailler dans des pays plus riches, les migrants peuvent augmenter leur productivité et percevoir des revenus plus élevés. Ils envoient des milliards de dollars chaque année vers leur pays d’origine, un flux qui dépasse celui de l’aide internationale. Le CDI récompense les pays qui accueillent les migrants des pays plus pauvres, reçoivent un pourcentage élevé de migrantes, acceptent les réfugiés, adoptent des politiques judicieuses d’intégration des migrants et adhèrent aux conventions internationales visant à protéger les droits des migrants.
Les envois de fonds des migrants constituent la principale source de financement du développement international, renvoyant des milliards chez eux, un flux dépassant l'aide extérieure. Prospérons ensemble. #CDI2020 @CGDev
Tweet ThisLa Suède obtient la meilleure note globale pour la composante « Migration ». Elle a accueilli le plus grand nombre de migrants par rapport à sa population (avec un poids plus élevé pour les migrants originaires des pays pauvres) et le deuxième plus grand nombre de réfugiés par rapport à sa population. Elle obtient également la note la plus élevée pour ses politiques d’intégration. La Turquie arrive en deuxième position, en accueillant un nombre important de réfugiés par rapport à sa population (45 pour 1 000 habitants, soit plus de 10 fois la moyenne du CDI qui s’élève à 4,4).
Les pays d’Europe de l’Est occupent les trois dernières places, la Slovaquie se classant en queue de peloton, derrière la Pologne et la Hongrie. Chacun de ces pays compte un faible nombre de migrants et une faible proportion de femmes.
Commerce
Le commerce procure aux pays pauvres des possibilités d’attirer des investissements, de créer des emplois et de réduire la pauvreté. Les grandes économies dominent le commerce mondial, et certains biens et services des pays pauvres sont encore confrontés à des barrières commerciales. Les tarifs douaniers et les subventions créent des conditions de concurrence inégales pour les produits agricoles, tandis que les lourdeurs administratives et les contraintes juridiques rendent les échanges commerciaux plus difficiles pour les pays en développement.
De bonnes pratiques commerciales attirent les investissements, créent des emplois et réduisent la pauvreté, ce dont nous pouvons tous bénéficier. #CDI2020 @CGDev
Tweet ThisLes Pays-Bas obtiennent les meilleurs résultats en matière de commerce grâce à des droits de douane peu élevés et de faibles subventions agricoles, une solide logistique commerciale et une ouverture au commerce des services. L’Australie et la Nouvelle-Zélande se classent respectivement deuxième et troisième.
Le Brésil, l’Inde et l’Argentine ferment la marche. Ces trois nations appliquent des droits de douane élevés après pondération à l’encontre des pays pauvres. En ce qui concerne les subventions agricoles, les pays en dehors de l’Europe montrent l’exemple. L’Afrique du Sud, l’Argentine, le Brésil, le Chili et l’Indonésie se joignent à la Nouvelle-Zélande et à l’Australie pour fournir des subventions inférieures à 3 % de la production agricole, largement en deçà de la moyenne de tous les pays (13 %).
Biens publics mondiaux
Environnement
Les pays à revenus élevés sont les principaux responsables du changement climatique, mais ce sont les pays pauvres qui paieront le plus lourd tribut. Ils sont plus exposés géographiquement, ont moins de ressources et de capacités au niveau de l’État pour faire face aux effets et une proportion beaucoup plus importante de leur population dépend de l’environnement pour satisfaire ses besoins journaliers. Le CDI évalue les pays selon plusieurs critères : la faiblesse de leurs émissions de gaz à effet de serre (GES), leur niveau de production et les subventions dont font l’objet les combustibles fossiles, le degré de tarification des émissions de carbone, s’ils évitent les subventions en faveur du secteur de la pêche, mais également la ratification, ou non, des traités environnementaux.
Ceux qui contribuent le moins seront les plus touchés par le changement climatique. Nous bénéficions tous de meilleures politiques environnementales. #CDI2020 @CGDev
Tweet ThisLe Chili est le pays le plus performant en matière de politiques environnementales. Il accorde des subventions négligeables aux industries des combustibles fossiles, et présente avec l’Inde les émissions par habitant les plus faibles. La Suède et la Finlande affichent les prix les plus élevés pour les émissions de carbone, mais leurs émissions par habitant étaient supérieures à celles du top 10. La France applique des tarifs élevés pour les émissions de carbone et a signé tous les grands traités environnementaux, mais elle est freinée par ses subventions en faveur des industries de la pêche et des énergies fossiles.
Les dernières places du classement sont toutes occupées par les grands pays producteurs de combustibles. Les Émirats arabes unis occupent la dernière place en raison de leurs émissions de GES les plus élevées, de la production et des subventions en faveur des combustibles fossiles, et de l’absence de prix pour le carbone. L’Arabie saoudite et le Canada sont respectivement 39ème et 38ème.
Figure 2. Émissions de gaz à effet de serre par source
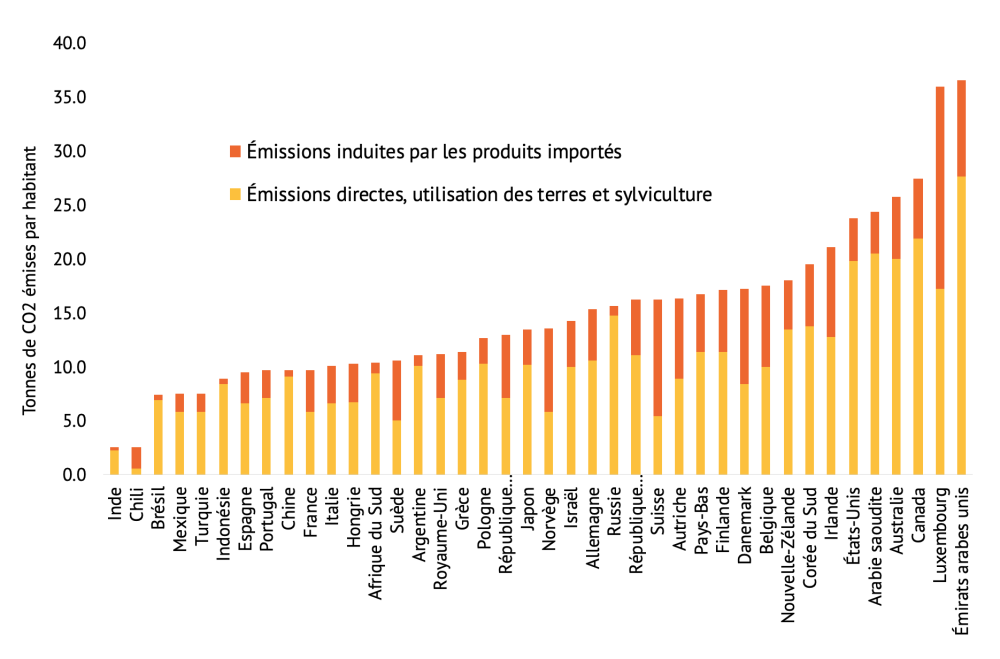
Source : Analyse par le CGD des données issues de l’Institut de recherche de Potsdam sur les effets du changement climatique, de l’Organisation des Nations Unies pour l’alimentation et l’agriculture et de l’OCDE.
Sécurité
La sécurité et le développement sont étroitement liés. La guerre et la violence politique peuvent détruire les moyens de subsistance et les institutions publiques, tandis que la pauvreté et la faiblesse des institutions favorisent l’éruption de la violence. Le CDI récompense les pays qui contribuent aux opérations de maintien de la paix et aux interventions humanitaires, positionnent des flottes militaires pour sécuriser les voies maritimes et participent aux systèmes de sécurité internationaux encourageant la non-prolifération de l’armement, le désarmement et l’État de droit international. Le CDI pénalise les pays qui exportent des armes, en particulier à destination des régimes non démocratiques, et qui omettent de publier des données sur les exportations d’armes.
Les pays riches ont le pouvoir de renforcer ou de détériorer la sécurité des populations des pays en développement. Le maintien de la paix et les interventions humanitaires signifient que nous sommes TOUS gagnants. #CDI2020 @CGDev
Tweet ThisPour cette édition 2020, nous ajoutons une sous-composante de santé mondiale, qui mesure les efforts de prévention de la résistance antimicrobienne et la capacité des politiques à prévenir, détecter et répondre aux menaces. Les Pays-Bas déploient le plus d’efforts pour réduire la résistance antimicrobienne, avec une faible consommation d’antibiotiques et une bonne gouvernance en matière d’utilisation des antibiotiques.
Le Royaume-Uni est le chef de file en matière de sécurité en tant que contributeur important à la protection des voies maritimes, et en matière de santé mondiale. L’Autriche se classe au deuxième rang en termes de soutien au maintien de la paix par rapport à la taille de son économie. En troisième position, les États-Unis fournissent la plus grande part de leur RNB à la protection des voies maritimes internationales. Le Japon exporte le moins d’armes par rapport à la taille de son économie.
Israël, l’Arabie saoudite et les Émirats arabes unis sont en queue de peloton en matière de sécurité. Israël a la valeur la plus élevée en termes d’exportations d’armes par rapport à la taille de son économie, à hauteur de 1,9 % de son RNB. Dans le cadre d’une nouvelle mesure, nous tenons compte du risque de conflit lié aux exportations d’armes. La Russie et la Chine arrivent en queue de peloton, dans la mesure où ces deux nations envoient la plus grande part de leurs armes aux pays pauvres, antidémocratiques et militaires.
Technologie
La technologie est essentielle au développement économique et humain. Les nouvelles technologies réduisent les prix des biens et des services, en les rendant plus accessibles. Les progrès réalisés dans le domaine de la médecine, des technologies de l’information et de la communication, les énergies renouvelables et les technologies agricoles contribuent à améliorer la qualité de vie dans le monde entier. Les économies développées disposant de solides réseaux de recherche et de bases technologiques peuvent jouer un rôle crucial dans la création et la diffusion des connaissances à travers le monde. Le CDI pénalise les pays qui suivent des politiques pouvant entraver le flux international des innovations, et récompense le soutien des gouvernements en faveur de la recherche et du développement (R&D).
La technologie non seulement stimule le développement, mais elle peut aussi sauver des vies. #CDI2020 @CGDev
Tweet ThisLe Luxembourg, l’Australie et la Corée du Sud affichent les meilleures performances pour la composante « Technologie ». Chacun de ces pays engage des niveaux de financement supérieurs à la moyenne pour la R&D. Le soutien gouvernemental direct de la Corée du Sud à la R&D atteint 0,98 % du RNB. Parallèlement, la France se classe en tête des avantages fiscaux : son environnement politique favorise les dépenses des entreprises en R&D, à hauteur de 0,54 % du RNB.
Concernant les transferts de technologie, le Luxembourg et l’Australie acceptent la part la plus importante d’étudiants étrangers lorsqu’elle est pondérée par le niveau de pauvreté du pays d’origine. Dans le cadre d’une nouvelle mesure, nous tenons compte des efforts déployés par les chercheurs d’un pays pour présenter conjointement les résultats avec des partenaires dans des pays en développement. Sur ce point, l’Afrique du Sud arrive en tête.
La Grèce se classe dernière en matière de technologie, avec un soutien gouvernemental limité à la R&D et un nombre limité d’étudiants étrangers.
En ce qui concerne les droits de propriété intellectuelle, les pays en dehors de l’UE, notamment la Chine, l’Indonésie et la Suisse, mènent la danse en n’exigeant pas de leurs homologues qu’ils acceptent des droits de propriété intellectuelle plus stricts que ceux déjà intégrés dans les règles de l’Organisation mondiale du commerce.
Rapports par pays et résultats complets
Rendez-vous sur le site cgdev.org/cdi pour en savoir plus sur l’Indice de l’engagement pour le développement, y compris les rapports par pays, le portail Web interactif, les calculs complets et le document de méthode.
À propos du CDI
L’Indice de l’engagement pour le développement est compilé chaque année depuis 2003 par le Center for Global Development (CGD). Le CGD œuvre à réduire la pauvreté mondiale et à améliorer les conditions de vie par le biais de recherches économiques novatrices qui promeuvent de meilleures politiques et pratiques de la part des décideurs mondiaux de premier plan. Ian Mitchell dirige les activités de l’Indice, avec une contribution majeure de Lee Robinson, Beata Cichocka et Euan Ritchie. Le CDI 2020 s’appuie sur les travaux des éditions précédentes d’Anita Käppeli, Owen Barder et David Roodman. Le CDI bénéficie du soutien financier du programme de développement efficace du CGD Europe, notamment les contributions des gouvernements de l’Australie, de l’Allemagne, du Luxembourg, de la Norvège et de la Suède. Le CDI ne reflète pas la position officielle des bailleurs de fonds. Les auteurs sont responsables de toutes les décisions méthodologiques et des informations et opinions exprimées dans le présent document.
Topics
CITATION
Mitchell, Ian, Lee Robinson, Beata Cichocka, and Euan Ritchie. 2020. Commitment to Development Index 2020. Center for Global Development.DISCLAIMER & PERMISSIONS
CGD's publications reflect the views of the authors, drawing on prior research and experience in their areas of expertise. CGD is a nonpartisan, independent organization and does not take institutional positions. You may use and disseminate CGD's publications under these conditions.