Update: A later version of this working paper has been published as an article in Review of Environmental Economics and Policy (Winter, 2017).
Forests provide a wealth of public services and private goods, yet forested land is being steadily converted to other uses, including cropland, pasture, mining, and urban areas, which can generate greater private economic returns. Public concern over the benefits of forests lost due to deforestation has led to a variety of deliberate policies intended to slow the rate of deforestation. These efforts benefit from research to understand what factors drive deforestation and what policies can effectively stop it.
This question is especially well suited to spatially explicit econometric analysis. The number of spatially explicit econometric studies of deforestation has grown rapidly since the publication of the first such study in a peer-reviewed journal in 1996. Here we have compiled a comprehensive database of all 117 spatially explicit econometric studies of deforestation published in peer-reviewed academic journals from 1996-2013. We present a meta-analysis based on the signs and significances of 5909 coefficients in 554 multivariate analyses.
We find that forests are more likely to be cleared where economic returns to agriculture and pasture are higher, either due to more favorable climatological and topographic conditions, or due to lower costs of clearing forest and transporting products to market. Timber activity, land tenure security, and community demographics do not show a consistent association with either higher or lower deforestation. Population is consistently associated with greater deforestation, and poverty is consistently associated with lower deforestation, but in both cases endogeneity makes a causal link difficult to infer.
Promising approaches for stopping deforestation include reducing the intrusion of road networks into remote forested areas; targeting protected areas to regions where forests face higher threat; tying rural income support to the maintenance of forest resources through payments for ecosystem services; and insulating the forest frontier from the price effects of demand for agricultural commodities.
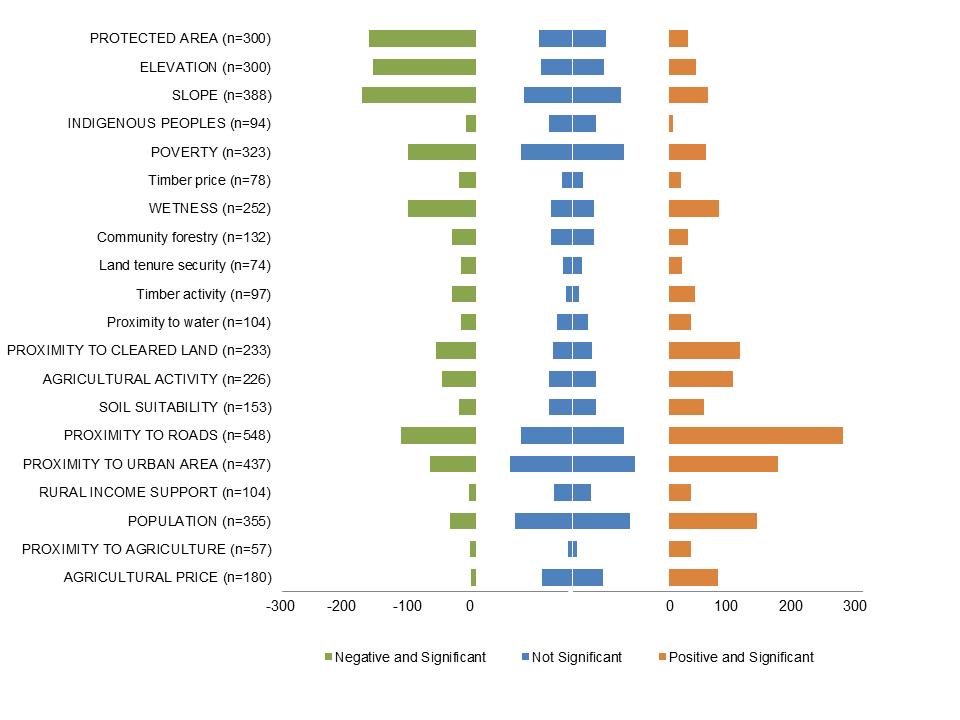
Twenty most commonly studied metavariables’ association with deforestation, organized by sign and significance of coefficients related to that meta-variable. Meta-variables ordered by ratio of negative to positive association with deforestation. Meta-variables with fewer than 55 coefficients not displayed. For meta-variables in upper case, the ratio of negative to positive observations is statistically significantly different from 1:1 in a two-tailed t-test at the 95% confidence level.
Download the full database here.
Rights & Permissions
You may use and disseminate CGD’s publications under these conditions.