Recommended
Blog Post
Is There Any Point Defining a ‘Climate Migrant’?
We know that climate change will lead to displacement. But despite hundreds, if not thousands, of studies, we still don’t know who will be displaced and precisely how, details that are crucial for policymaking. If people will be moving, new investments will be needed. Where should new schools, or housing, or hospitals be built, and when will they be needed? Where can irrigation programmes in rural areas help people, and where would they become wasted efforts and stranded assets?
Datasets that have integrated migration and climate data are hard to come by. The Terrapops project, for example, provides extracts that include both migration data (built using national censuses) and climate data. These are useful, but variables in a single extract are often cataloged across different time periods, at varying frequencies, and at different resolutions, reflecting the different census choices made by contributing countries. The lack of standardization makes a single international dataset, similar to those the World Bank compiles, elusive.
Yet policymaking demands better data, and we do not have time to wait. Hence under a new CGD initiative, we have been looking into how remote sensing climate and migration datasets, particularly derived estimates from satellite data, might help countries respond. Here, we explore what’s available and the outstanding methodological challenges. In a companion blog, we explore the definition of a climate migrant and why it matters.
Migration data for climate purposes
Ideally, we are after two sources of metadata. Firstly, we want data with a fairly high spatial resolution to analyze how climate affects migration patterns at the local level. Secondly, we want data that assesses international migration flows, to see how these local migration patterns relate with international mobility. No dataset ticks both of these boxes.
There are concerns surrounding the validity of internal migration data for low- and lower-middle income countries. When some governments haven’t collected such data for decades at a time due to cost, and privately sourced data is only shared at a steep price, innovative methods are needed.
Datasets of international movement have their own challenges. Data on migration ‘stocks’—the number of migrants in a country at a given time—have good coverage, but rely on sometimes patchy censuses, making them hard to compare. Data on migration ‘flows’—the number of migrants entering and leaving a country over a given period—can offer more detail, but coverage is largely limited to OECD countries, which often fail to report countries of origin, and differing definitions can create problems for comparison.
For example, the GHS-POP dataset, a project from the European Commission’s Joint Research Center, offers residential population estimates between 1975 and 2020 in five-year intervals, as well as projections to 2025 and 2030 (Figure 1). These data are disaggregated from census or administrative units to grid cells, informed by the distribution, density, and classification of populations. While this dataset does not include demographic data that are needed to estimate net migration, such as birth and death rates, it serves as the base layer of resident population estimates for other datasets that do attempt to estimate migration.
But there are some limitations even when estimating the resident population. The GHS-POP product is produced in the World Mollweide map projection at the 100-meter level, and then aggregated at the 1-kilometer level. The algorithm estimates population at the 100-meter-level by downscaling census data, using more specific classifications of land use based on images of daytime light. So, if there’s not much daytime light (during winter in high and low latitudes, for example), there may be an error in classification of land use and thus the number of people living there.
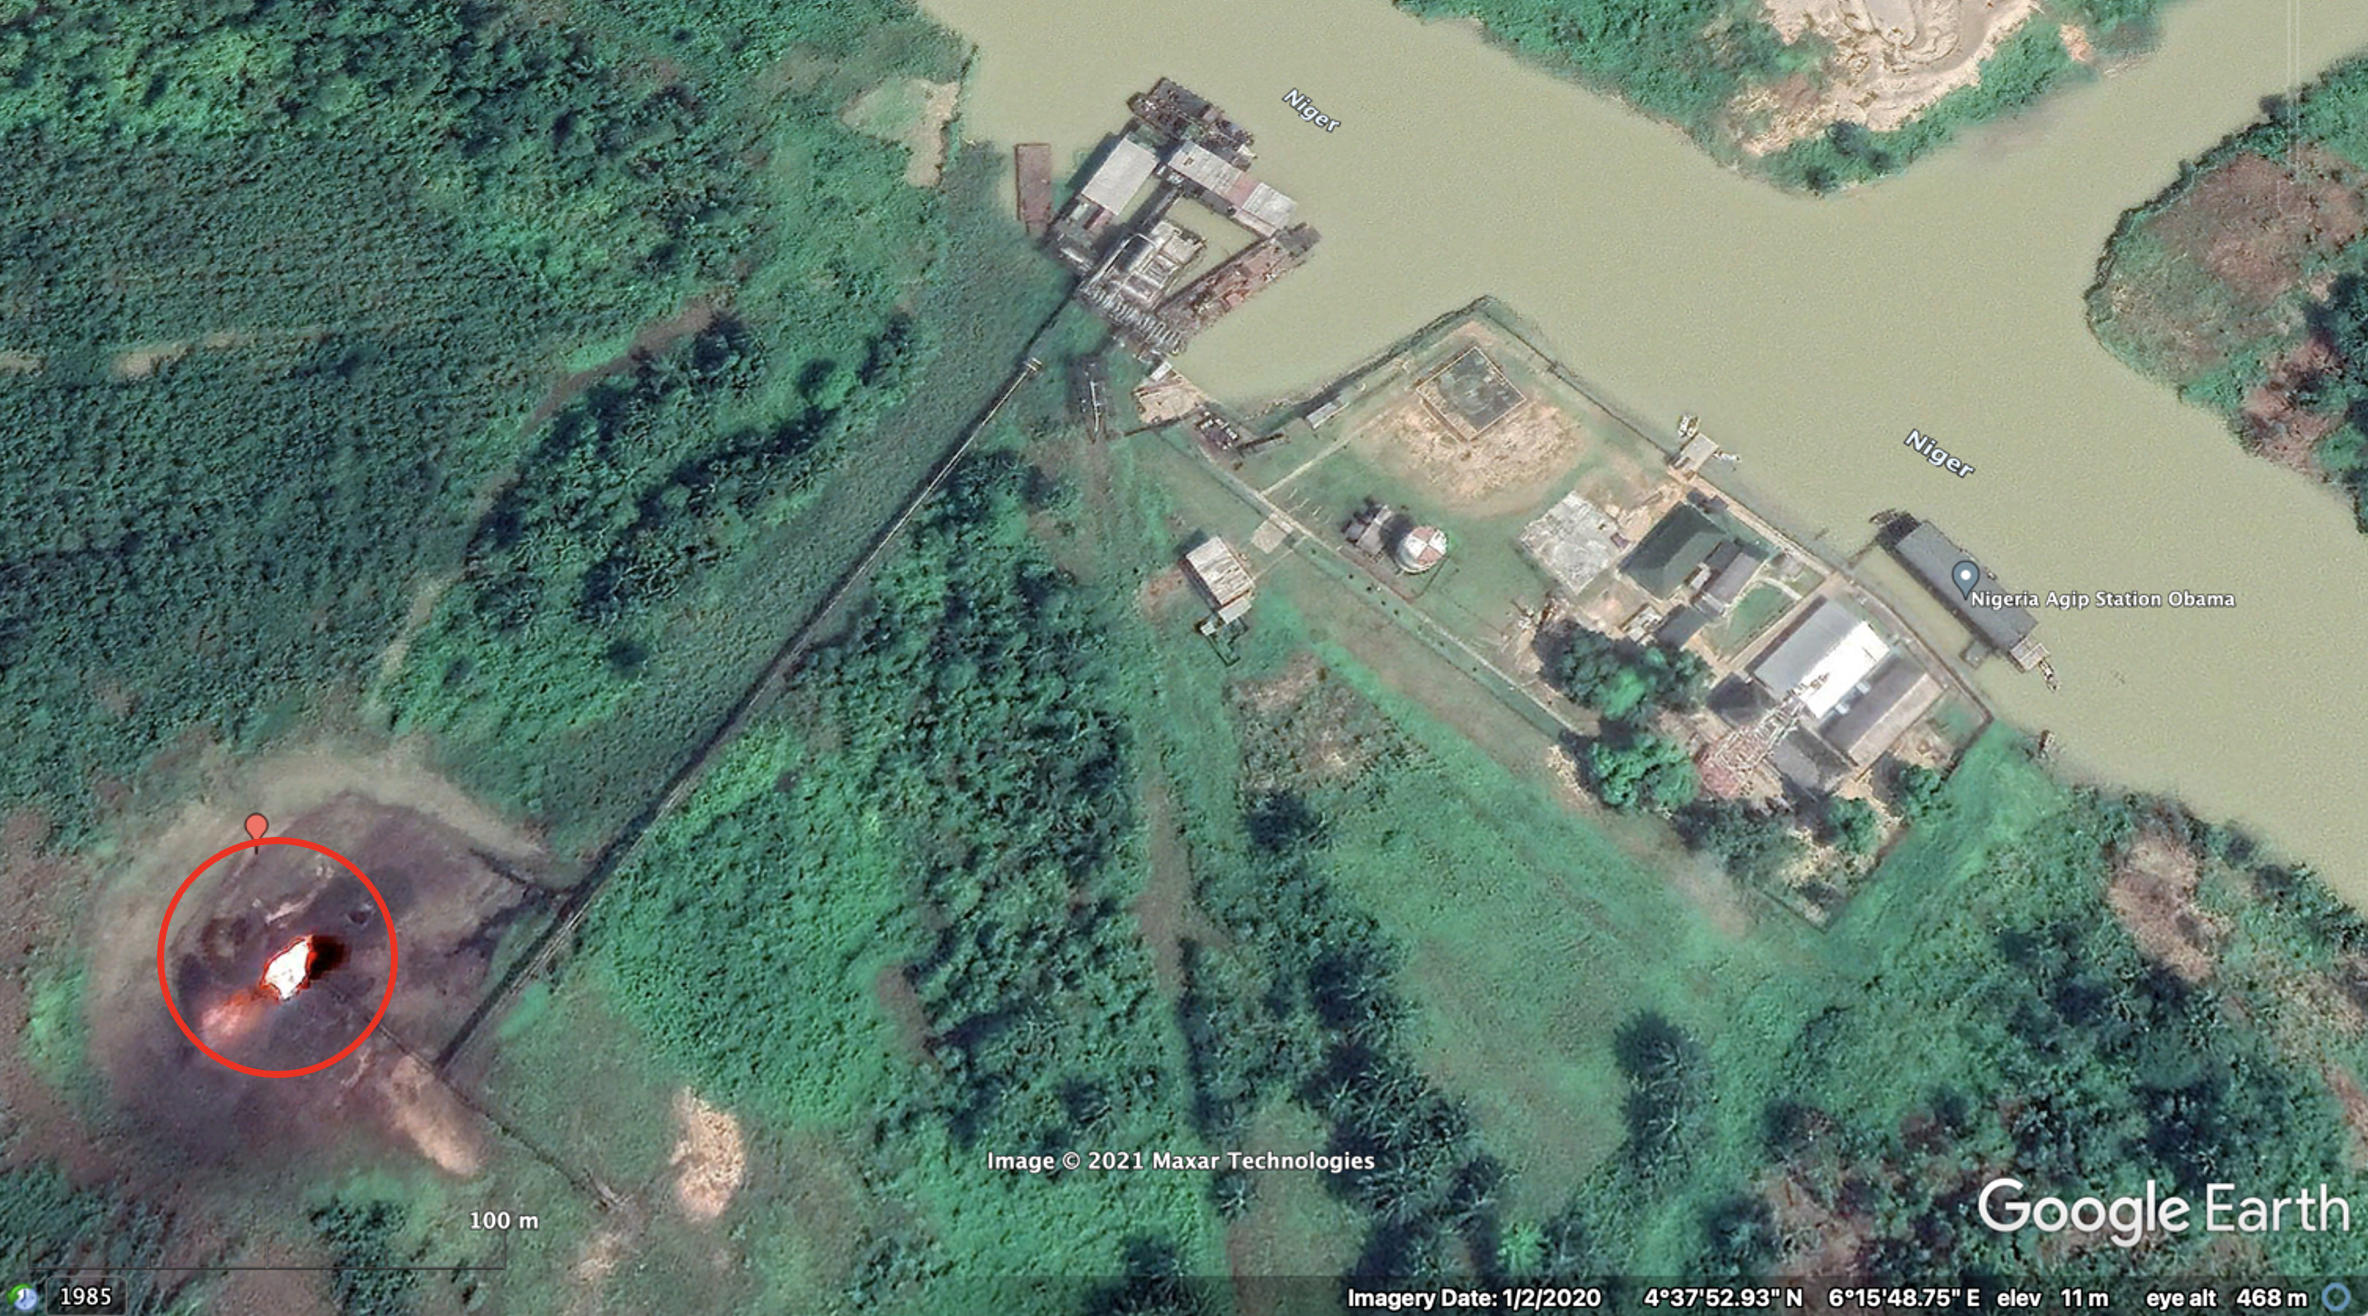
For instance, some units initially deemed ‘unpopulated’ or ‘uninhabited’ in the Gridded Population of the World (GPW) census data, another dataset, were reviewed using ancillary data and very high-resolution (VHS) imagery from web-mapping services such as Google Maps. This process found that people were, in fact, living in 269 units across 31 countries that had previously been deemed as ‘uninhabited’. If no one is assessed to be living in an area, there is no way to assess their migration. While those 269 units are small compared to the total number of 42,000, they nonetheless leave blind spots.
Figure 1. GHS-POP extract, 2015

Source: GHSL
A better option is the CLICIM dataset, created by the European Commission’s Knowledge for Policy programme. CLICIM builds off GHS-POP by overlaying additional information on birth rates, infant mortality rates, death rates, and migration surveys to establish micro estimates on migration at a spatial resolution of 25 square kilometers. It does not cover the entire world but still covers a large subset of countries. It serves as—to our knowledge—the most useful dataset of net migration at a high level of spatial resolution (Figure 2).
CLICIM builds off of GHS-POP by incorporating demographic data to provide migration estimates, assuming that if there is a difference between the birth rate and death rate in a cell, migration—into or out from the cell—must explain the difference. This works insofar as demographic calculations are accurate; if population growth estimates are inaccurate, the net migration estimates will also be skewed.
Figure 2. CLICIM extract, 2021

There are others, such as the dataset for Estimating Net Migration By Ecosystem and By Decade developed by the Center for International Earth Science Information Network (CIESIN), which was used by the 2011 Foresight Report and by the World Bank’s Groundswell report. These have shorter time horizons, however (CIESIN runs to 2010, versus to 2015 for CLICIM). CLICIM was only released in June 2020, which may explain why it hasn’t yet been used as widely.
And, of course, the CLICIM dataset, while still the most recent and best, also comes with its own limitations. The dataset has been validated against data from Eurostat and UN DESA, but given that UN DESA data is a component part of the dataset (along with GHS-POP data), this validation is slightly problematic. Unfortunately, both the GHS-POP and CLICIM datasets present several limitations in capturing useful insights on climate migration:
- The datasets don’t give a useful insight into seasonal migration, which is most prevalent in the context of climate change, nor into shorter-term migration undertaken due to sudden-onset disasters, such as cyclones, given that the data offers snapshots of net migration at five-year intervals.
- The datasets can’t capture migration within a 25-square-kilometer cell.
- The datasets can’t capture the difference between return migration and permanent migration, given that areas of origin are not identified for the migration estimates.
Essentially, these datasets can’t tell us where migrants are going or why they’re moving; they only demonstrate which areas of the world are attracting people and which are losing them.
Climate data for migration purposes
Conversely, when it comes to climate, there are a relatively large number of datasets that cover the whole globe. For example, NASA has a range of datasets, including on urban wet bulb temperatures (the combination of heat and humidity that, when it rises too high, creates a serious health hazard). For our project, we’re using datasets from the University of Delaware (UDEL), covering land temperature and precipitation from 1900 up until 2017 (Figures 3, 4).
Figure 3. UDel Mean temperature, July 2017

Source: University of Delaware
This is a longer time-series than CLICIM’s migration data from 1970 to 2015, which allows a more accurate understanding of averages and anomalies. Further, these datasets use point estimates of precipitation and temperature at high spatial definition, which are more accurate than grid-cell estimates. The high spatial definition of UDEL datasets, at 55 square kilometers, is higher than other datasets, but less high definition than the 25 square kilometers of the migration dataset CLICIM.
Figure 4. UDel Total rainfall, July 2017

Source: University of Delaware
As a whole, datasets on climate variables are improving, but have their own limitations:
- Weather datasets often agree on long-run averages, but frequently disagree on anomalies. Two datasets might, for example, agree that the average temperature in a given area was 24°C, but one might suggest that the highest temperature in that set was 32°C in July, while another might record 36°C in August. Because deviations from the mean are the climate shocks that change people’s circumstances, difficulties in establishing exactly when the big variations happened can make it harder to accurately establish when climate shocks were factors in migration decisions.
- Different spatial resolutions of datasets can create divergent results. Many of the areas that may be most vulnerable to climate change are underserved by weather observation stations, and different modeling techniques trying to balance these deficits can give different results. To establish causal links between climate events and international migration, we need as fine a spatial resolution as possible.
- Many datasets lack some historical data points. Not just today, but over the past few hundred years, many geographical areas have had sparse station coverage—often in parts of Africa, South America, and Central Asia—and historical data has since been interpolated, with resulting inaccuracies. (In Africa, only one in four weather stations produce data that meets international standards). This creates challenges in obtaining accurate results and in comparing across areas over time.
UDEL’s datasets reflect some of these limitations. Their reliance on ‘raw’ weather station data means that they are vulnerable to the inaccuracies caused by areas with sparse and inadequate coverage. And UDEL's map projection uses Mollweide (an oval-shaped projection), whereas CLICIM’s uses WGS84 (which uses an ellipsoid model for the globe, mapping coordinates precisely across it). UDEL’s projection choice allows it to avoid biases resulting from non-equal-area map projections, but the conversion to align with CLICIM’s ellipsoid may reintroduce some biases.
But when looking to merge climate and migration data, researchers are getting better at using innovative data sources to attribute causal relationships. The NASA BlackMarble extract uses nighttime light to assess wealth, and gives us an idea of what we can hope to use to establish a causal link (Figure 5).
Figure 5. NASA BlackMarble extract, 2021

Many have used this dataset to track urbanization, electrification, and disaster monitoring, all of which may impact who moves as a result of climate changes. However, as Justin Sandefur has stated, night lights data “is probably good enough for academic purposes, but probably not accurate enough for policy purposes.” This seems to be consistent across all satellite datasets that may be used in the study of climate migration.
Using remote sensing data is…challenging
While we can’t wait for better data in order to act, we still need to make data collection a priority moving forward, to gain a more context-specific understanding of how and where people are moving. These four challenges can be started on now:
- Improve frequencies and depth of data collection. This can only be corrected moving forward, of course, and more needs to be done. At COP15 in 2009, high-emitting, developed countries pledged US$100 billion in climate finance to developing countries; some of that should be used to support improved data collection.
- Do not validate against the same data input. With few datasets, there are few validation options. Until we have more datasets available, validation exercises must be done innovatively against other data sources, not an original input, such as country censuses or satellite imagery. In the future, we hope to have enough high-quality datasets that data validation can be done more easily. At more local levels, validation can also be conducted against household surveys (although there is also scope for making them more useful in this space).
- Distinguish between mobility vs. migration. Daily location data from mobile phones and Facebook show that people do move in response to sudden-onset events, often temporarily. This mobility can be understood as distinct from more permanent migration resulting from slow-onset events, for which we need better data.
- Integrate qualitative data. Perceptions of climate change and other factors can inform migration decisions as much as the ‘real situation.’ In northern Senegal, an area with increasing climate hazards and high vulnerability, migration is expected to be highly affected. In qualitative research, however, both mayors of small towns and migrants themselves stress that ‘climate is not the cause;’ instead, lack of political representation, precarious livelihoods, and jealousy of migrant families’ wealth were the primary motivators. Climate change interlinks with all these factors, but a simple linear narrative derived from big data would not provide a reliable causal link.
Moving forward
So, we don’t have good disaggregated, reliable data that allows us to predict migration, especially in areas exposed to slow onset change. But policymakers will still need to make decisions in the very near future, even in the absence of good, global information. Some new datasets may help. As part of the Data For Good initiative, for example, technology firms including Google, Meta, and cell-phone aggregators like Unacast and Veraset have started sharing high-frequency anonymised data on mobility (Figure 6). Such datasets can estimate mobility patterns at very high resolutions and were used in determing lockdown strategies during COVID-19.
Figure 6. Facebook mobility data, 2020

Source: Movement maps, Meta: Data for good
While the recency of these datasets mean their usefulness for understanding long-term migration is limited, they can help us understand short-term migration in response to disasters and sudden onset climate change events. Governments can get started now by engaging with such private companies to better understand, and provide services for, people on the move in response to immediate climate disasters.
To improve understanding of migration as a result of slow onset disasters, however, increased collaboration between climate scientists, demographers, economists, agricultural scientists, and many other researchers is essential (this was a common refrain at the recent International Migration Review Forum).
We are hoping to collaborate across disciplines as we explore these topics under our new initiative. If you are interested in collaborating with us, please reach out to Sam Huckstep at [email protected].
Topics
DISCLAIMER & PERMISSIONS
CGD's publications reflect the views of the authors, drawing on prior research and experience in their areas of expertise. CGD is a nonpartisan, independent organization and does not take institutional positions. You may use and disseminate CGD's publications under these conditions.