On Tuesday, the World Bank announced the launch of a new database to characterize the quality and composition of the public sector in 115 countries. According to Jim Brumby, the Director of the World Bank’s Governance Global Practice, the Worldwide Bureaucracy Indicators (WWBI) “can help researchers and development practitioners gain a better understanding of the personnel dimensions of state capability, the footprint of the public sector on the overall labor market, and the fiscal implications of the government wage bill.” The new indicators are part of a larger effort by the World Bank’s Bureaucracy Lab, which is seeking to promote the use of evidence and technology in civil service reform.
At this point, you might be thinking: “Who decided that we needed another country-level index?” Fear not! The WWBI does not rank countries or offer up a summary index on the scope and functioning of the public sector. Instead, the WWBI draws on the World Bank’s harmonized micro-level Global Monitoring Database of labor force surveys to construct 87 objective indicators on public employment and wages—for example, the proportion of public employees with tertiary degrees and the public sector wage premium.
Here are three patterns that jumped out at me after looking at the data:
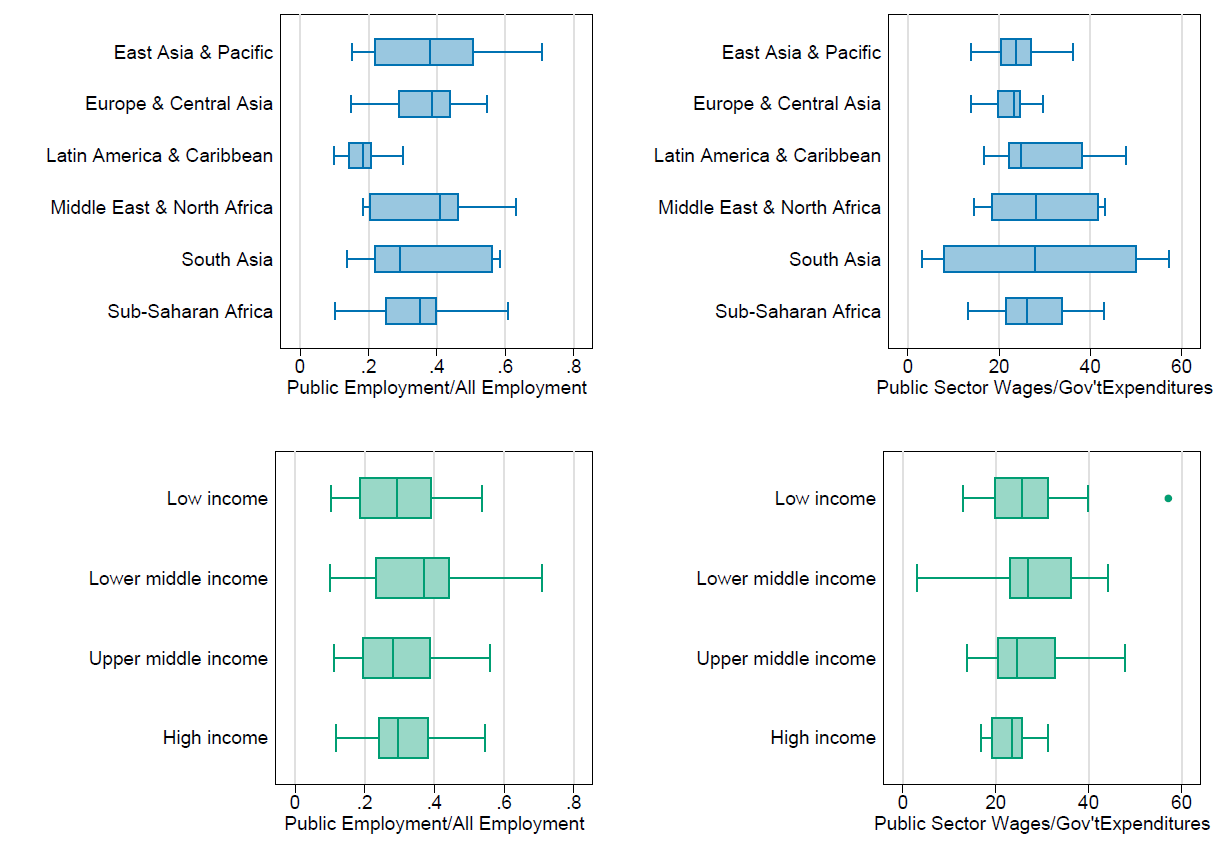
1. The size of the public sector doesn’t vary with income level.

Source: Author’s visualization based on Worldwide Bureaucracy Indicators data
The public sector is large in many countries, accounting for about 32 percent of paid employment and 26 percent of government expenditures among countries in the WWBI database. Perhaps less widely known is how little of the variation in the scale of the public sector is explained by country income-level. In my (admittedly small-N) poll of development economists that I ran into last Friday, four expected a negative relationship between national income and the size of the public sector (as a share of all paid employment) while one expected a positive association. In fact, the WWBI database suggests that almost all of the variation in the scale of the public sector is within rather than across country-level income categories.
2. A higher public sector wage premium is not associated with lower corruption.
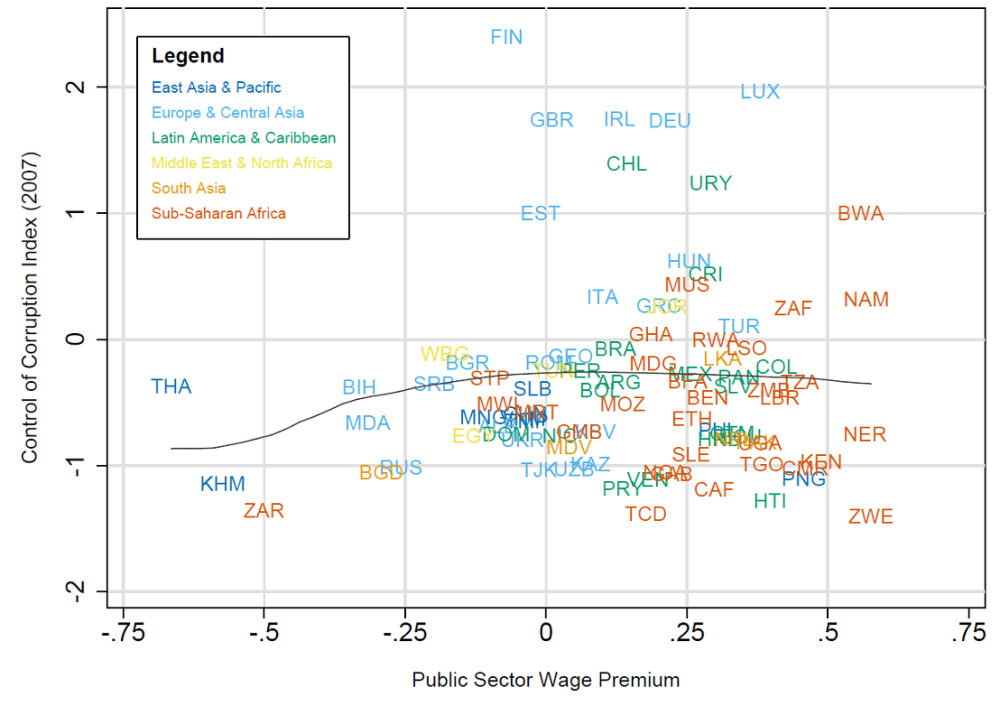
Source: Author’s visualization based on Worldwide Bureaucracy Indicators data and the Control of Corruption Index 2007
Are better paid civil servants less corrupt? Existing cross-country evidence tends to point toward a weak but negative relationship between corruption and the public sector wage premium (c.f. Van Rijckeghem & Weder 2001). Such an empirical link wouldn’t be surprising: economic theory suggests that the costs of corruption depend on the relative attractiveness of public sector jobs as compared to the private sector.
Interestingly, that is not what the data say: as the figure above shows, merging the WWBI and the World Bank’s Control of Corruption Index suggests that there is no relationship between the extent of corruption (indicated by lower Control of Corruption scores) and the public sector wage premium. On the one hand, this is a correlation and not an estimate of the causal impact. On the other hand, the absence of an association over such a wide range of wage premia suggests that—if there is a causal relationship—there must be some other important factors that move with the wage premium to offset its impact. Conclusion: Summary Statistics: 1, Overly Simplified Economic Theory: 0.
3. Women are over-represented in the public sector relative to the private sector, and there is little evidence of urban bias in public sector employment.
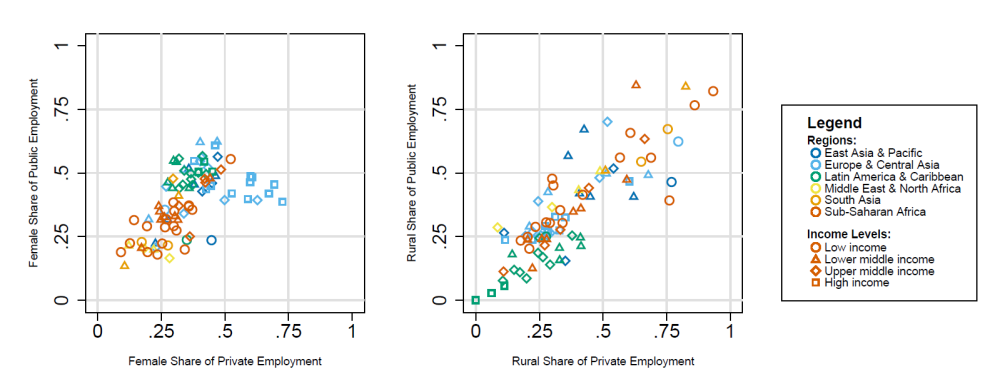
Source: Author’s visualization based on Worldwide Bureaucracy Indicators data
I was not surprised to learn that women account for less than half of all public sector employment in most countries in the data set. In general, women’s participation in the public sector appears to be strongly correlated with their participation in the private sector—but the former tends to be a little higher (except in Europe and Central Asia, where women appear to account for more than half of private sector employment in the WWBI). Interestingly, women’s participation in the public and private sectors is substantially higher in the Latin America and Caribbean region than in sub-Saharan Africa—though total female labor force participation is substantially higher in the latter.
The absence of urban bias in public sector employment was one of the more surprising descriptive results I stumbled across during my scenic tour of the new database. Across all countries in the WWBI data set, there is a huge amount of variation in the share of public employment concentrated in rural areas. However, rural public employment is very highly correlated with rural private employment—almost all the date points in the figure above are centered around the 45-degree line. One interpretation is that governments’ apparent urban biases may just reflect the concentration of economic activity in urban centers—and not any inherent desire to target government benefits toward urbanites. Or perhaps urban bias is a thing of the past. In any case, it is conspicuously absent from the WWBI data.
Measuring the public sector: an idea whose time has come
I was pleasantly surprised by how much I was able to learn from the World Bank’s new cross-country database, but there is also plenty of room for improvement. The World Bank’s Dan Rogger has been doing fascinating work collecting internationally comparable survey data from civil servants, but no direct measures of the attitudes or ability-levels of those working in the public sector make it into the WWBI. Also absent from the database is geographical and sectoral information that would allow researchers to evaluate the allocation of public sector jobs across regions (within countries) or variation in worker characteristics across ministries.
The WWBI database is only a first step, but it is an important one. The World Bank has been telling developing country governments how to reform the public sector for more than half a century. Governments now have a tool for objectively evaluating their own performance—and the reasonableness of donor recommendations regarding civil service reform. In the era of evidence-based policymaking, these internationally-comparable measures of the compensation and composition of the public sector seem long overdue.
Topics
DISCLAIMER & PERMISSIONS
CGD's publications reflect the views of the authors, drawing on prior research and experience in their areas of expertise. CGD is a nonpartisan, independent organization and does not take institutional positions. You may use and disseminate CGD's publications under these conditions.


