“Illicit financial flows” means dirty money crossing borders. It is an umbrella term which covers diverse actors including organised crime groups, business people making bribes, political leaders engaging in grand corruption, and individuals and firms misusing cross border transactions to evade taxes.
What they all have in common is that what they are doing is illegal (although they may be getting away with it), and they often use opaque international networks of legal entities, bank accounts, and property holdings to facilitate and store ill-gotten gains. There is a clear development case for rich countries to act to prevent their financial systems being used as havens for illicit financial flows that harm developing countries.
Reducing illicit financial flows has been adopted as a Sustainable Development Goal (target 16.4). But the question of how to define and measure progress remains fraught.
Descriptions of the concept of illicit financial flows articulated before the target was agreed tended to look like this:
Illicit financial flows comprise tax evasion, the theft of state assets, the laundering of the proceeds of crime, and a range of market and regulatory abuses under cover of anonymity.
Since the SDG target was agreed, there has been a shift towards focusing on legal tax avoidance (or “base erosion and profit shifting”) by multinational corporations (which does not rely on anonymity or secrecy).
I have argued that tax avoidance and illicit financial flows are different things and it is a bad idea to bundle them together. If the aim is to improve the integrity of financial and fiscal systems, strengthen the rule of law and accountability of governments, and enable productive investment, then combining legal and criminal behaviours into a single category is perverse. Others—such as Sol Piciotto and Alex Cobham of the Tax Justice Network and the members of the Independent Commission for Reform of International Corporate Taxation—argue that we should take a wide approach to defining “illicit” on the understanding that “law is fuzzy. . . hence, elements of morality and politics inevitably come into its interpretation.”
Measuring “misalignment”
The job of recommending how to interpret the SDG target and coming up with a way to measure progress has been given to two UN agencies: the UN Office on Drugs and Crime (UNODC) and the UN Conference on Trade and Development (UNCTAD). UNCTAD is responsible for tax-related illicit flows, and its proposal includes an indicator based on “misalignment” between the locations where multinational enterprises declare profits and where their economic activity takes place (using a simple metric of employee headcount and sales—see the box at the bottom of this blog post for the formula).
The idea of this indicator is that it would be calculated using statistics which the OECD is compiling based on data from companies’ confidential country-by-country reports as part of the “Base Erosion and Profit Shifting” (BEPS) programme (see annex C of the OECD report). The data itself has been submitted by major companies as part of their compliance responsibilities in different countries and collected by tax authorities as a risk-assessment tool. The aggregate statistics are being compiled by the OECD with the aim of providing governments with a more complete view of the global activities of the largest multinational enterprises and to improve the analysis of BEPS. The OECD stresses that this data will not provide definitive conclusions on profit shifting. None of this was intended to capture illicit financial flows.
The proponents of the “misalignment” indicator acknowledge that it captures ordinary tax compliance as well as tax avoidance (since tax rules do not seek alignment between profits and the average of headcount and sales, and international businesses are not homogenous globally). Nevertheless, they hope that this effect is small and the metric can be used as a meaningful indicator of progress on illicit financial flows (without bringing the number down to zero). As far as I know they haven’t tested this intuition with real numbers.
Testing the formula with some real numbers
The OECD statistics won’t be out till next year. But it is possible to try out the proposed formula already using examples from individual companies that have published their own data. I looked at four companies: Pearson, Barclays, Vodafone, and Lush.
Pearson, the international educational publisher, published a tax report in 2017 which includes country-by-country financial and employment data. Overall it made a $2.6 billion loss. The “illicit financial flow formula” suggests it got away with shifting 42 percent of its global losses mainly out of the UK and China into the US. In practice, the company experienced real losses in its US business.
Illicit financial flows calculation applied to Pearson (percent of global losses)

Vodafone is the company that has put the most detail on its tax affairs into the public domain, publishing an 82-page tax report. Plugging its figures into the illicit financial flows formula gives a result which suggest illicit flows of £3.6 billion out of Germany, the UK, and India into Italy, South Africa, and Luxembourg. The company’s tax report highlights that it has made losses in the UK due to large investments in networks and licenses, and it employs over 300 people in Luxembourg undertaking financing, international roaming agreements, and global purchasing. Some financing is also taxed in the UK under “controlled foreign company” rules.
Illicit financial flows calculation applied to Vodafone (percent of global profits)

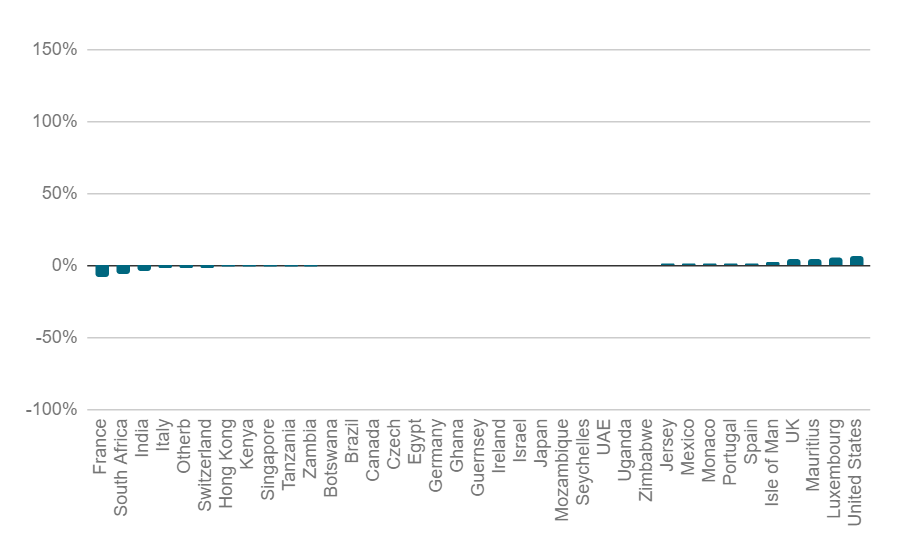
Barclays, like all large European banks, is required to publish country-by-country data under the Capital Requirements Directive IV regulations; it also publishes a narrative explanation for the figures. Applying the formula suggests illicit flows from France, South Africa, and India to the UK, Mauritius, Luxembourg, and the US. The proportion of global profits is smaller than Pearson and Vodafone (so might perhaps be close enough to zero to be disregarded in theory), but in absolute terms the numbers are large—some £2 billion. In practice Barclays explains that its reported profits in the UK include dividends which have already been taxed before being repatriated.
Illicit financial flows calculation applied to Barclays (percent of global profits)
Finally, I looked at the handmade cosmetics company Lush. It has been awarded the Fairtax Mark (a scheme which seeks to certify that businesses “are paying the right amount of tax in the right place at the right time”). Surprisingly, Lush has the highest illicit financial flows result based on the formula, which suggests that it is shifting 260 percent of its global profits from Brazil, Japan, Germany, and Hong Kong mainly into the UK.
Illicit financial flows calculation applied to Lush (percent of global profits)

I am sure that there is a perfectly boring business explanation for Lush’s pattern of profitability. But these are the answers the formula generates.
This initial analysis of four companies supports the concern that the proposed indicator is not fit for purpose for assessing illicit financial flows. It takes data submitted as part of the BEPS program which does not relate to anything recognizably “illicit” and transforms it into an official indicator of criminal activity, interpreting ordinary business losses as billions of dollars’ worth of illicit financial flows and painting a significant portion of tax-compliant business behaviour as “illicit.”
Illicit financial flows calculation applied to four companies (percent of global profits/losses and £ billion)


Testing the concept with people
Debates on illicit financial flows have already been shaped by a previous generation of trillion dollar headlines based on applying another simple formula. While these figures drew attention to the issue of illicit financial flows, the methodology was not reliable, and questioning it was not encouraged. As a result, unrealistic perceptions and confusion (between “trade misinvoicing” and “transfer pricing”) built up. The new indicators seem poised to repeat the same cycle.
The indicators are being developed through a series of invitation-only meetings which aim to gather expert knowledge. However, the invited participants seem to have been drawn from an increasingly narrow pool. The most recent meeting involved seven different individual and organisational members of the tax justice movement, as well as a smaller number of crime and corruption experts and some PhD students. It did not include a single tax practitioner (either from the private sector or from revenue authorities), or any mainstream tax academics. UNCTAD and UNODC say they will continue to engage stakeholders. I hope they succeed in broadening the conversation.
The proposed indicator risks misleading and distracting from the real, important, and difficult business of detecting and deterring money laundering, bribery, and tax evasion, and tracking the proceeds of crime and corruption, while destroying trust in international collaboration on base erosion and profit shifting.
Misaligned Profits: The Proposed Formula
“For each jurisdiction misaligned profits are defined as: χ𝑖 = 𝜋𝑖 - 𝜔𝑖Π where: 𝜔𝑖 is the share of all multinationals’ economic activity in jurisdiction i; Π is the global, gross profits of all multinationals; and π𝑖 is the value of all multinationals’ gross profits declared in jurisdiction i. We propose to capture economic activity as the simple average of single indicators of production (the share of full-time equivalent employees in a jurisdiction, 𝜄 𝑖 ) and consumption (share of final sales within each jurisdiction, 𝛾𝑖 ). We define, for all i: 𝜔𝑖 = 1 /2 (𝜄 𝑖 + 𝛾𝑖)”
Topics
DISCLAIMER & PERMISSIONS
CGD's publications reflect the views of the authors, drawing on prior research and experience in their areas of expertise. CGD is a nonpartisan, independent organization and does not take institutional positions. You may use and disseminate CGD's publications under these conditions.