Recommended

POLICY PAPER
Philippe Le Houerou, the Chief Executive of the International Finance Corporation (IFC) has announced his intention to step down in September. His legacy will include a significant effort to focus the work of the corporation on development impact and the world’s poorest countries. Last year he said that “[m]y goal since I started at IFC three years ago has been to put development impact at the heart of IFC.” He introduced significant institutional reform and staffing changes designed to deliver on that goal. And Le Houerou has had some success. But a look at IFC’s portfolio suggests how far the institution still has to go to have the biggest impact.
In January 2018, we published an analysis of the IFCs lending portfolio which concluded that the organization had been moving investments away from lower-income countries towards richer economies. Two and a half years later, we’ve updated the numbers. Thanks to increased IFC transparency, the update was considerably more straightforward than the original exercise. The data shows that the Corporation still invests mostly in richer developing countries. In part because of that, and despite being the largest development finance institution in the world, IFC investments range from small to insignificant in most countries when compared to foreign direct investment flows. The IFC’s announced pivot to poorer (International Development Association or IDA) countries is reasonable in that regard: it is where the Corporation has the scale to make a difference and where the need is greatest. Sadly, however, evidence of that pivot is hard to find in the recent lending data.
Figure 1 shows the scale of IFC investments on an interactive map. A mouseover of each country reveals data for the number of investment projects undertaken between 2000 and 2019, the total amount committed, the number of advisory projects and funds spent, and the total amount of IFC commitments, summing up investments and advisory services. It also shows IFC spend per capita and IFC spend per $1,000 of 2019 GDP, adjusted for inflation. Finally, we compare the numbers to summed net inward flows of FDI per capita into the country over the period 2000-19, adjusted for inflation. Net inward FDI is not a perfect comparison, we should note: our IFC figures are gross rather than net and include portfolio flows as well as foreign direct investment. Both of these differences make the comparison favorable to IFC, but the FDI figure does serve the purpose of demonstrating the approximate magnitude of IFC flows in relation to other types of foreign private investment.
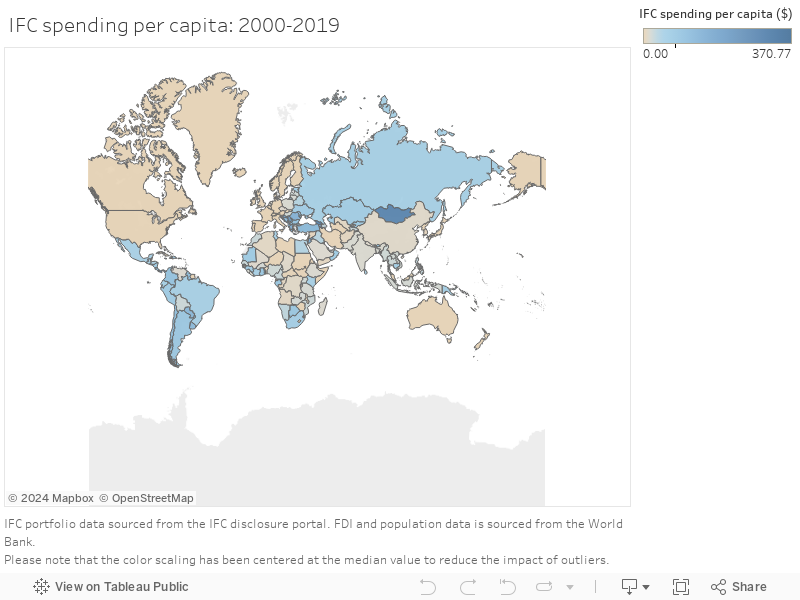
The map makes clear that IFC does most of its investing in larger, richer developing countries. The largest investment totals are in India, China, Russia, Turkey and Brazil. This is followed by South Africa, Argentina, Chile, Colombia and Mexico. India—not an upper middle-income country but a rising economic power—received $16.5 billion in investment projects. The IFC invested $10.5 billion in Brazil over the period of our analysis, a country on the cusp of high-income status, and the Russian Federation received $7.4 billion. And this is not just about absolute dollar terms. IFC per capita investments were larger in middle income countries: Per capita Brazil received $50, Turkey $127, and Mexico $44.
In contrast, Mali—one of the poorest countries in the world—received $169 million in IFC investments over the period since 2000 with a per capita spend of $9. Respectively, Chad received $121 million (or $8 per head) while the Democratic Republic of Congo received just over half a billion dollars (or $7 per head).
These results are not surprising. Upper middle-income countries are more investment worthy and like most private investors, this is where it is easiest for the IFC to operate. But these are the countries where the IFC is less significant and less necessary: considerable foreign private investment goes on without any engagement from development finance institutions. In Brazil, the IFC’s summed investment of $50 per capita pales in comparison to FDI per capita of $9,444.
It is clear that the only places the IFC has the scale to have a significant impact on overall private investment flows is in small, poor economies. The Central African Republic’s FDI per capita sums to $218, for example. That is less than the IFC’s per capita investment in Serbia. And, of course, small, poor economies are the ones that most need more private investment. Given that, it makes some sense that the IFC under Le Houerou agreed to focus more of the Corporation’s lending on the poorest economies. In return for a capital increase, the IFC has promised to increase its commitments in IDA countries and fragile and conflict-affected states (FCS) to 40 percent of its portfolio by FY30. Of this, 15 to 20 percent is supposed to be invested in projects in fragile and conflict affected states.
It takes time for corporate behavior to shift but while the (very) early evidence on IFCs pivot to the poorest suggests some success for Le Houerou, it isn’t that encouraging. Figure 2 provides a breakdown of IFC investment volumes by income group over time. Under Le Houerou’s leadership, the share of investment in LICs has climbed from 4.9 percent in 2016 to 7.6 percent in 2019. But that still leaves the proportion lower than any year between 2000 and 2013. The share in low-income and lower-middle income countries (LIC, LMIC) climbed from 41 percent in 2016 to 49 percent in 2019, but that is still lower than any year before 2011. So far, while the reforms have stabilized a collapse, it is yet to be seen if they can do more.
Figure 2
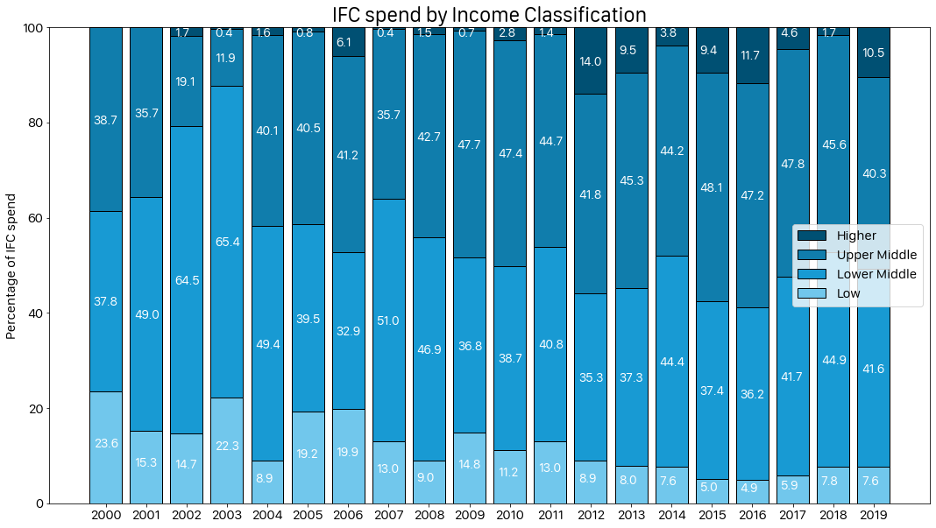
Between 2000-2017, an average of 28.6 percent of IFC investments were in countries that were IDA status at the time of investment. In 2018, when the IFC made its commitment to increase its IDA/FCS share to 40 percent, lending to IDA countries only reached a 26.7 percent share. In 2019 that declined to 24.1 percent.
And it will only get harder to meet the IFC’s commitments going forward. First, the total size of IFC’s portfolio is set to expand, so IDA countries should receive a growing share of a growing pot (according to the IFC, it will deliver 75 percent more in cumulative commitments in IDA countries between FY19 and FY30). And second, thankfully, countries are graduating out of IDA status (as a sign of things to come, the number of LICs has fallen from 63 to 29 just since 2000). That means a lot more money will need to be funneled to a smaller set of economies. It isn’t at all clear that the IFC has the potential flow of deals to achieve that outcome.
How could Le Houerou’s successor help the IFC meet its commitments to refocus on the poorest countries where it is most likely to have impact? It would need to take a far more proactive role in creating projects to support in target countries. This would involve working closely with client country governments to support the implementation of their industrial and infrastructure strategies, potentially working with national development banks as well as designing competitively auctioned public-private partnerships in infrastructure that the IFC could help finance. There might be a small role for competitive, capped, and transparent subsidies in these projects. But such a strategy carries considerable financial risk and overhead costs. It is far more complex and time consuming to design investments than simply appraising them. The IFC would need support from its board for both risk tolerance and the staffing requirements of a proactive strategy. So far, we have not seen much evidence of change in the board’s attitude. And without this, the important work that Philippe Le Houerou began will fall short of its promise.
Topics
DISCLAIMER & PERMISSIONS
CGD's publications reflect the views of the authors, drawing on prior research and experience in their areas of expertise. CGD is a nonpartisan, independent organization and does not take institutional positions. You may use and disseminate CGD's publications under these conditions.