Income growth is the holy grail of development.
At least that’s been the implicit view of much of the development community in recent history. The ultimate aim of development is to improve people’s lives, and GDP growth and income distribution are the yardsticks of this hallowed ground. This is because income (whether spent by individuals or the state via taxation and redistribution) is used to obtain all of the things fundamental to better lives, such as healthcare, education, and nutrition.
Looking beyond income growth: the example of child mortality
While the development community has spent decades searching, with limited success, for reliable models of economic growth, however, advances in technology have been quietly increasing these other quality of life measures. Technology is defined here in the economic sense as improved knowledge—of how to make products, for example, or how to organise people, deliver services, or cure diseases. Technology can be embodied in physical products—and these may be cutting-edge and thus fit the conventional notion of technology—but it does not have to be.
We have not yet arrived at a dependable model of raising incomes, but the “development” that any level of money can buy is growing, and technology has been the force increasing the bang per buck; it has allowed us to shortcut the route to development.
To explore this dynamic, we consider child mortality rates. Child mortality is tragic in and of itself, and reducing it can surely be viewed as a priority, but it is also generally correlated with other health outcomes. Richer countries have always had lower child mortality, but this century mortality rates have fallen steeply everywhere. The poorest countries today have rates comparable to the richest countries in the in 1900s. This is despite the fact that they are still much poorer in real terms than the richest countries of that time, as this chart illustrates.
Figure 1. GDP per Capita vs Child Mortality Rates in 1900 and 2016
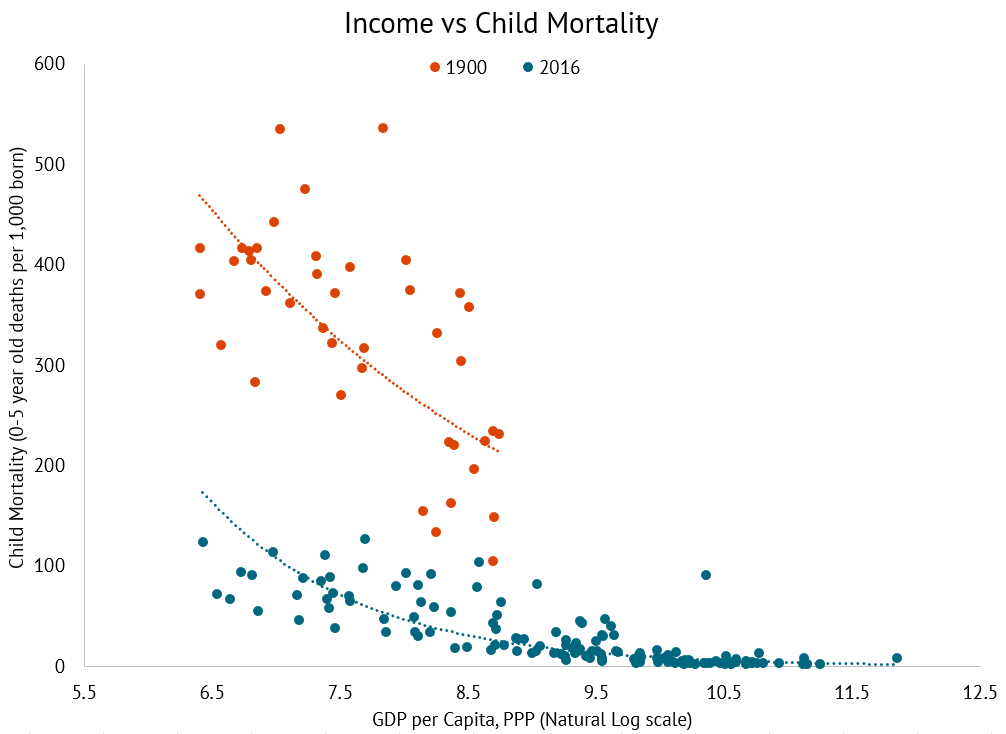
What is striking here is the large gap between the regression lines. At any level of income in 2016, we would predict a mortality rate considerably lower than the 1900 predicted rate. This finding is nothing new, but its implications should have a much bigger influence on how we discuss development. Development discourse very often focuses on income growth or poverty reduction—that is, moving along the lines on the graph. Viewing this chart through that lens might invite despondency: there were many countries as poor in real terms in 2016 as the poorest in 1900.
But if we look at the vertical axis, child mortality, we see that mortality for the poorest country in the 2016 sample (which is the Central African Republic), was 123 per 1,000 born. Peru had roughly the same income in real terms in 1900, but its mortality rate then was 371—three times higher. The highest recorded mortality rate in 1900 was 537, for Chile, whereas the highest rate in 2016 was 127, for Chad. For all levels of income, the global poor in 2016 have much better life chances than their income peers of 1900. We have chosen child mortality, but this same story can be told on numerous other metrics of development.
Charles Kenny presents evidence that knowledge and technology have played a direct role in reducing child mortality—perhaps as much as income. The two lines on the chart above bear that out. We can see that non-income factors that shift the curve downwards can greatly reduce infant mortality. Owen Barder has also often presented the stylised fact that non-income factors that shift the curve account for a large share of mortality reductions over the past century. The following chart illustrates the method by which such an estimate can be arrived at for an individual country.
Figure 2. Determining Estimates for Non-income Factors Related to Mortality Reductions
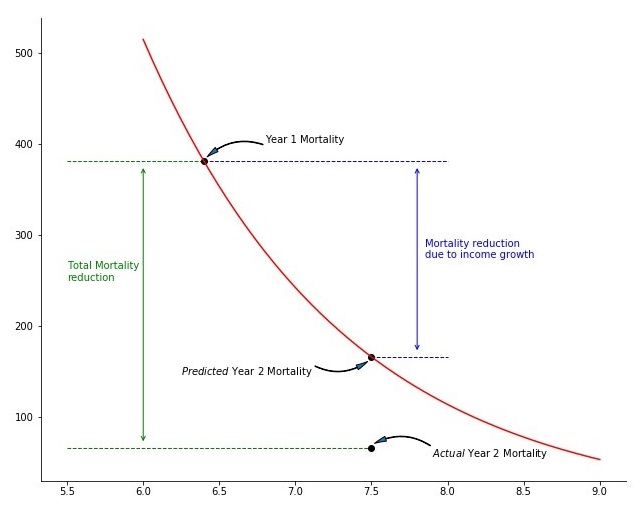
This chart decomposes the child mortality reductions of a country between the two time periods into that resulting from higher income and that due to curve shifts. Firstly, the line of best fit for all countries in Year 1 is calculated, which is the red line (and we assume our country has an average income mortality relationship in that it sits on this line of best fit). A given change in income results in movement along this line this line to a new mortality rate, and thus also results in a change in mortality explained by income growth. Any changes in mortality outside of this income effect are therefore due to a shift in the curve, rather than a movement along it. This shift effect is the green “total mortality reduction” minus the blue “mortality reduction due to income growth” in the chart.
What does the line shift represent?
By definition it’s “everything that is not income.” We propose that a large proportion of this residual effect is technology, defined broadly as above. The standard neoclassical models of economic growth define increases in technology, or “Total Factor Productivity,” as the increase in production not accounted for by changes in capital or labour. We similarly assume that a large share of the residual here is broad technological innovation. The things that income makes available that reduce mortality, such as access to better healthcare, nutrition, drugs, etc., are themselves the outcomes of historical innovation, such as research into pharmaceutical products and into diet, innovations in hospital management, improved understanding of germ theory and so on. And it has been possible to spread these things more widely partly as a result of income (better funded governments, hospitals, and the ability to purchase medicines), but also because of the development of better technologies, translated into, for example, more efficient medical processes, improved drugs, the organisation of hospitals, and the global spread of knowledge of germ theory. This may be obvious but it is worth highlighting the role of technology in this regard, given that the development debate has often centred around income.
The size of the line shift effect
To demonstrate the importance of the line shifting effect, we zoom in to the above chart and select a few countries from a range of 1900 income levels.
Figure 3. GDP per Capita vs Child Mortality Rates in 1900 and 2016, Select Countries

Using this methodology, the reduction in mortality that are due to income and shift effects for these countries are:
| % of improvement due to technology | % of improvement due to income | |
|---|---|---|
| Argentina | 76 | 24 |
| India | 67 | 33 |
| Austria | 57 | 43 |
| Indonesia | 50 | 50 |
| China | 39 | 61 |
| Peru | 17 | 83 |
| Norway | -22 | 122 |
The technology effect varies by income level—it is generally smaller for rich countries and it can even become negative. Consider Norway, whose distance beneath the curve in 1900 could not be maintained below the lower bound of 0 in 2016 and thus has a negative shift effect. But it is clear it can be very important; it has accounted for over two thirds of India’s improvements in child mortality, and even for Argentina, which was relatively very wealthy in 1900, this technology effect explains over three quarters of mortality improvements. The average technology effect is 57 percent—obtained by applying the above methodology to a hypothetical average income country. This tells us that generally, at least half of the improvement in child mortality over the last century is not from countries getting richer, but from improved and more widely available technology.
Shifting the curve requires accessible tech and research agendas focused on poor countries
When charting income versus mortality in this way for many other time periods, it is clear that the slope has different gradients in different years. A steeper slope indicates that more money buys more health, or, conversely, that poverty implies reduced access to health. Kenny notes that some advances that have reduced infant mortality, such as piped water, are expensive and require developed administrative infrastructures to implement, whereas others, such as pit latrines or education on basic hygiene are more broadly accessible. In this regard, the steepness of the slope could be caused by several factors, including: the prevalence of low-cost technologies, the accessibility of patented technologies to poor countries, and the challenges on which researchers focus their efforts—whether on poor or rich country problems (e.g., on cures for baldness or for malaria).
Two key themes stand out in the above examples: dissemination and focus, or how accessible technologies are to poor countries and how prevalent poor country challenges are on research agendas. But there are blurred lines between these themes and the relationships between them can be complex. For example, potential markets are smaller in developing countries, so private researchers tend to focus on rich country problems (focus) but to maintain their monopoly prices in the rich country market, and recoup their huge research investments, firms are reluctant to disseminate them cheaply in the developing world (access). Unlicensed trade in products from these markets as well as criticism of such a pricing structure within their main markets could threaten their profits. Furthermore, it may not be possible to transplant directly the products meant for Western countries to poorer countries. Differences in market size, for example, imply differences in what are cost effective ways to manufacture, deliver, and dispose of waste from these products, while differences in climate imply considerations of storage and refrigeration. Such adaptations can be costly and are likely to offer only minor market returns. These dynamics add further complexity to viewing this as a challenge of focus and access.
A call for greater focus on technology
Much of the economic debate centres on how we can improve incomes in poorer countries to enable them to enjoy the fruits of progress, such as longer lives and improved health. But our analysis here suggests that there is at least as much value in focusing on the factors that cause the line to shift: that is, on promoting innovation and the spread of technology.
In a series of forthcoming blogs and papers, we will explore these ideas in greater detail, and broaden the scope from child mortality to a broader range of development issues. We will measure spending on R&D, particularly in development; assess how these funds can have the greatest impact; and explore how donors and governments can structure research incentives to overcome the focus and dissemination challenges of technologies and mobilise them towards the particular challenges of developing countries.
Topics
DISCLAIMER & PERMISSIONS
CGD's publications reflect the views of the authors, drawing on prior research and experience in their areas of expertise. CGD is a nonpartisan, independent organization and does not take institutional positions. You may use and disseminate CGD's publications under these conditions.