Recommended

Blog Post

POLICY PAPERS
As the urgency and scale of development and climate challenges become more obvious and alarming, we have seen a surge in interest in how multilateral development banks (MDBs) can help low- and middle-income countries meet these challenges. Much of that focus has been on the volume of their finance, the shares of climate finance in total finance, and how MDBs should adapt their instruments and processes to better meet country and global needs.
Notably missing from the debate has been the question of what MDB success looks like in terms of impact at the institutional or corporate level. How will we know if these institutions are playing the role they need to play? Before shareholders and other stakeholders decide whether and where to put additional capital and concessional funds into MDBs, they should be certain they have a basis to judge performance and value for money. And institutional performance must be defined at least in part in terms of impact, not just the volume of MDB financial inputs. (This focus complements stakeholder assessments of measurement and reporting at the project level.)
To answer these questions, we looked at how MDBs currently define impact though their corporate scorecards. Our aim was to assess whether those scorecards make it possible for shareholders and other stakeholders to judge whether MDBs are contributing enough to reaching development and climate goals. We found that most scorecards do not make that possible, although the African Development Bank and Asian Development Bank set stronger standards. We also found that the MDB system as a whole lacks any coordinated approach to measuring and reporting corporate impact. These findings reveal basic weaknesses in transparency and accountability, at a time when shareholders are confronting major decisions on whether to expand MDB financial capacity and how to boost their effectiveness.
Our approach
In this analysis, we examine the corporate scorecards of seven of the largest MDBs. We ask two basic questions:
- Do MDBs measure and report at the corporate level quantitative outputs and outcomes supported by their finance and other activities?
- Do MDBs set output/outcome targets that define their projected corporate contributions to aggregated country and global objectives?
Our assessment is based on publicly available corporate scorecards, not internal documents. Some scorecards were relatively easy to find on MDB websites. Others required searching through development effectiveness and other reports.
Outputs are defined here as ex post results supported by MDB projects or programs, such as kilometers of roads built or number of small businesses financed. Outcomes measure the ex post effects of those outputs on beneficiaries: e.g., reductions in transport time and cost, small business revenue and job growth. Ex post refers to impact measured when the MDB projects have been executed, as distinct from ex ante measures which project impact before the projects have been implemented.
In addition to overall output/outcome reporting at the corporate level, we looked at other key dimensions of corporate impact transparency:
- Frequency of reporting;
- Disaggregation by country, country income group, and gender;
- Mapping of projects to the UN Sustainable Development Goals (SDGs);
- Publishing of baselines to allow assessment of progress over time;
- Setting and reporting of output/outcome targets;
- Exercise of executive board oversight to promote strong output/outcome performance;
- Inclusion of climate-related outputs and outcomes.
MDB corporate scorecards are generally divided into three tiers:
- Tier 1: global or regional macroeconomic results;
- Tier 2: corporate ex post outputs and outcomes from MDB-supported projects: and
- Tiers 3 and 4: corporate key performance indicators (KPIs) and management goals.
We focused on Tier 2 outputs/outcomes because they are necessary for assessing value for money. Most of the conversation about MDB corporate targets to date has been in terms of finance volume, finance allocation, speed of finance approvals and disbursement, and, to some extent, how much private finance is mobilized by MDB activities. These measures are rightly included in MDB corporate scorecards, but they do not measure the development and climate impact of MDB finance.
Findings
The most striking finding is that there is no standardized practice across the MDBs, despite the significant overlap in their largest shareholders. This is somewhat surprising, but the variability has its uses. Transparency and reporting that are possible for one institution should be possible for others.
This matrix compares Tier 2 output/outcome measurement and reporting practices across the seven institutions.
Figure 1. MDB corporate scorecard matrix: Tier 2
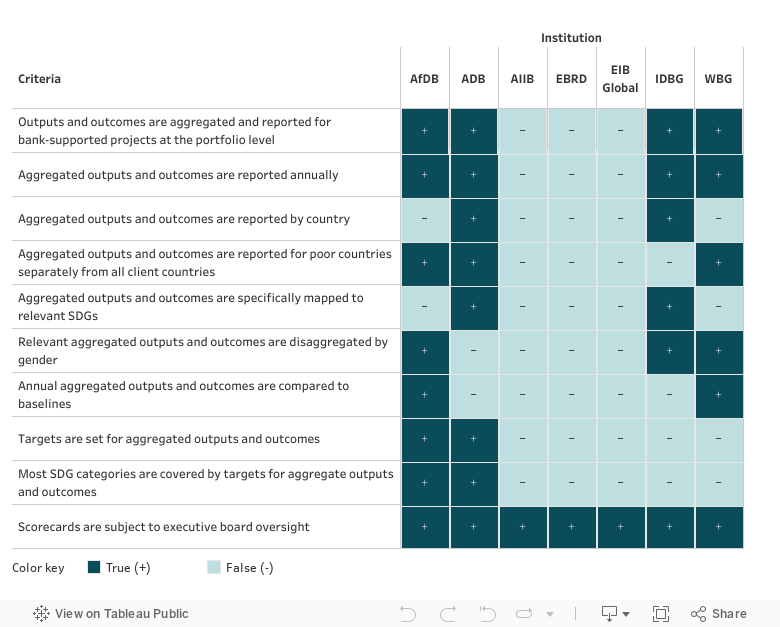
Key: AfDB: African Development Bank; AIIB: Asian Infrastructure Investment Bank; ADB: Asian Development Bank; EBRD: European Bank for Reconstruction and Development; EIB Global: European Investment Bank; IDBG: Inter-American Development Bank Group; WBG: World Bank Group
The matrix does not include the New Development Bank (NDB) as it does not currently produce a corporate scorecard. However, the NDB's 2022–2026 strategy document notes that the NDB “...will develop a corporate results framework (CRF) to assess its quantitative and qualitative performance in implementing the Strategy, as well as NDB’s overall effectiveness in fulfilling its mandate.” The CRF will include the “Bank’s development impact, including the social, economic, and environmental outputs and outcomes of NDB’s operations.”
None of the seven institutions meets all the criteria outlined above for measuring and reporting corporate impact in their corporate scorecards:
- Only four out of seven institutions report outputs/outcomes.
- Only two disaggregate by country.
- Only two map impact to relevant SDGs.
- Only two report baselines.
- Only two set output/outcome targets at the corporate level.
For all seven banks, executive boards review corporate scorecards. But our criterion defines a low bar: board meetings or board committee meetings to discuss corporate scorecard performance. We have no way of telling whether there are systems in place to proactively address shortfalls in performance.
Setting targets
Notably, the African Development Bank (AfDB) and Asian Development Bank (ADB) excel by these standards relative to their peer institutions. They both set output/outcome targets that cover a broad range of SDGs, and they both report progress in meeting those targets, though in different ways.
The AfDB sets Tier 2 targets differently in different sectors. For sectors covered by the High 5s, a grouping of five priority areas defined by the AfDB’s corporate strategy, targets are drawn from those strategy documents as approved by the Board. (The AfDB estimates that the overlap between the High 5s and the SDGs is 86 percent.) For example, the high-level objective of achieving universal energy access in Africa by 2025 (a pre-pandemic goal) implies several output targets, including increasing on-grid capacity by 162 GW. Targets for other sectors are generated from the bottom-up-based on the expected results of the portfolio aggregated across projects.
The AfDB’s approach addresses two criticisms of target setting (see page four of the IDB’s CRF 2020-2023): first, that setting top-down corporate targets may conflict with country priorities; and, second, that the timeframe for most corporate scorecards is too short for assessing changes in performance that require long periods of time and multiple projects. Regarding the first, borrowing country shareholders shape targets in two ways: by approving individual projects in their own countries and by their voice and vote in approving corporate strategies like the High 5s. On the second criticism, AfDB’s Results Measurement Framework (RMF) has a 10-year timeframe (until 2025), with both end-period targets and interim annual targets (Figure 2). This approach incentivizes AfDB management and staff to set ambitious long-term targets and focus on a series of projects over time that will enable achievement of targets. It also helps them adjust when the annual performance trajectory signals problems.
Figure 2. Excerpt from AfDB Results Management Framework with 10-year targets

To facilitate assessment of progress over time, the AfDB reports baselines, annual ex post values, and annual targets. Note the shortfalls in performance for the agriculture example below, likely due at least in part to setbacks from climate change and external shocks like the pandemic. AfDB’s reporting transparency alerts shareholders and management to areas of underperformance, providing data necessary for timely course corrections.
Figure 3. Excerpt from AfDB corporate scorecard: Tier 2

For the ADB, rather than target values for indicators, it reports an achievement rate, taking actual indicator values as a share of total ex-ante projected results for each output and outcome indicator. But, in the absence of baselines, it is not possible to determine the magnitude of the gains embodied in the ex-ante projections. It is also worth noting that ADB has reported target completion rates greater than 100 percent for more than three quarters of indicators since 2019, raising questions about whether targets are set at sufficiently ambitious levels.
Figure 4. Excerpt from ADB corporate scorecard: Level 2

Disaggregation, mapping to SDGs, and baselines
The Inter-American Development Bank Group (IDBG) and World Bank Group (WBG) do not set targets, but they report on outputs/outcomes supported by bank activities. Reporting practices related to disaggregation, mapping to SDGs, and establishing baselines differ. For instance, the IDBG breaks down indicator values by country while the WBG has separate values for fragile and conflict-affected situations (FCS). Both disaggregate by gender where relevant. The WBG reports baselines while the IDBG does not. The IDBG maps indicators to SDGs while the WBG does not. At the recent IDA Midterm Review, World Bank President Ajay Banga announced that the Bank’s new corporate scorecard will feature a greater focus on impact and outcomes.
Figure 5. Details on education indicator from IDBG corporate scorecard: Level 2

Figure 6. Excerpt from WBG corporate scorecard: Tier 2

Outcomes vs. outputs
One other difference across institutions is the extent to which they include outcomes in their corporate scorecards, versus outputs. While difficult to measure and to aggregate across projects and countries, outcomes are the most direct measure of changes in the wellbeing of individuals, households, farms, businesses, as well as the impact of climate-related activities. As shown below, the ADB makes a particularly strong effort in this context, with outcomes accounting for nearly 40 percent of its scorecard indicators.
Figure 7. Shares of output and outcome indicators in MDB corporate scorecards
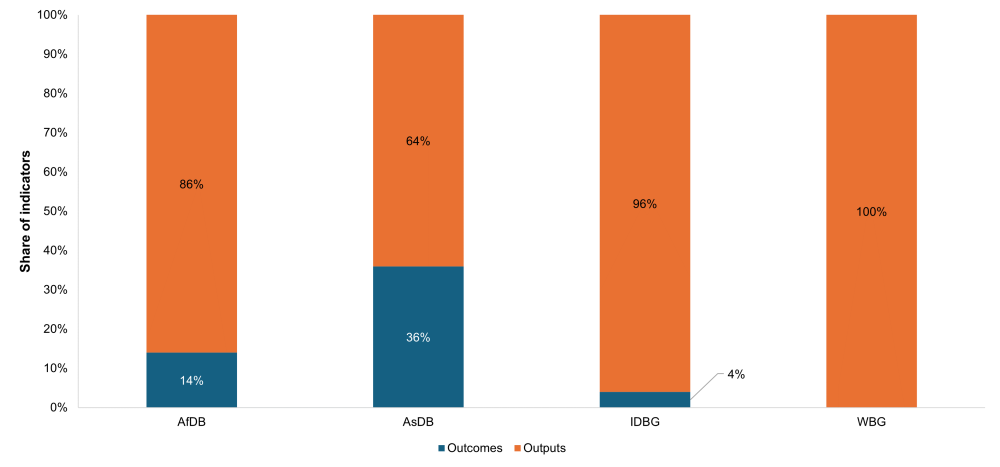
Source: MDB corporate scorecards
Climate-related impact
We also examined how MDBs are incorporating climate objectives in their corporate scorecards. Figure 8 shows that about 10 to 20 percent of indicators are related to climate mitigation and adaptation.
Figure 8. Shares of climate-related indicators in MDB corporate scorecards

Source: MDB corporate scorecards
But, as shown in the list below, the number and definitions of indicators differ (with the exception of greenhouse gas emissions reductions), making it hard to compare or aggregate across institutions.
Which climate-related corporate indicators do each bank use?
AfDB
- People provided with clean cooking access
- New renewable power capacity installed
- Emissions reduction in energy
ADB
- Women and girls with increased resilience under climate change, disasters, and other external shocks
- Total annual greenhouse gas emissions reduction
- People benefiting from strengthened environmental sustainability
- Zones with improved urban environment, climate resilience, and disaster risk management
IDBG
- Emissions avoided
- Beneficiaries of enhanced disaster and climate change resilience
- Habitat that is sustainably managed using ecosystem-based approaches
- Installed power generation capacity from renewable sources
- Value of investments in resilient and/or low-carbon infrastructure
WBG
- Expanded power generation (renewable)
- Countries supported toward institutionalizing disaster risk reduction
- Greenhouse gas emission reductions
Institutions that do not report quantitative outputs and outcomes
The European Bank for Reconstruction and Development (EBRD), which mostly finances the private sector, takes a different approach. Its corporate scorecard includes its own qualitative judgments on transition impact instead of quantitative output/outcome indicators. Seven transition qualities are scored using composite performance assessments based on underlying indicators (the full list of which can be found in annual transition reports).
Figure 9. Transition impact section of EBRD corporate scorecard

Similarly, the European Investment Bank (EIB) Group uses a set of qualitative KPIs to report on its value added at a corporate level. These are disaggregated for the EIB and EIB Global, the portion of the Group that works in non-EU countries. As demonstrated in the figure below, this scoring is based on qualitative EIB judgments. It provides no quantitative information about the impact of Bank-supported operations. It is worth noting that these performance measures are found in an “indicator table,” which is not labeled as a corporate scorecard.
Figure 10. Value added section from EIB global indicator table


The scorecard for the Asian Infrastructure Investment Bank (AIIB) offers an overview of the bank’s anticipated financial inputs and operational efficiency. Where applicable, these projections are linked to institutional targets. While this covers financial performance well, it says nothing about the results or impact of the finance.
Figure 11. AIIB corporate scorecard for 2023

Conclusion
This look at corporate scorecards across MDBs shows that it is not now possible for shareholders and other stakeholders to compare impact value for money consistently across institutions. It is not clear why this should be so. The AfDB in particular has blazed a trail that provides a model and valuable experience for other institutions, demonstrating that better reporting is feasible.
The full set of outputs/outcomes prioritized by different institutions may vary somewhat, but it seems reasonable to have a core set that is common across institutions in the same way that the SDGs are common to all countries. MDBs have demonstrated that they can collaborate to build shared methodologies and definitions. They already produce joint reports on climate and blended finance volumes.
The absence of this common, core set of corporate impact metrics makes it hard for MDBs to make a persuasive case for their own effectiveness. Especially at a time of very active debate on the merits of additional MDB capital and donor grant finance, reporting of aggregate outputs and outcomes in MDB corporate scorecards is an essential tool for government shareholders as they decide how to allocate resources across institutions. It would also help private investors decide which MDBs are the most impactful partners.
We are seeing progress on reporting climate outcomes. At COP 28, MDB heads issued a joint statement which committed to: “enhance our approach that is largely focused on our joint reporting of climate finance commitments to also tracking and reporting climate outcomes. This will enable us to better track results for climate and development priorities - for both mitigation and adaptation. To this end, at COP28 we agree to develop a common approach for reporting climate results and impact, and we will continue close collaboration to harmonize and improve our methodologies for climate indicators.” If MDBs can develop a common approach to reporting climate results and impact, including for adaptation, they can do so for development results and impact.
The G20 has an essential role to play here, to ensure that transparency is not focused only on climate-related impact. It could and should call on MDBs to develop standardized joint annual reports on commonly defined development and climate outputs and outcomes supported by their operations, with comparisons to baselines. The reports would drive stronger MDB impact measurement systems, capable of aggregating impact first at the country level and then at the corporate level. Stronger measurement should also drive better MDB finance allocation decisions, which in turn should help governments make more compelling, evidence-based cases to taxpayers for additional MDB capital and concessional finance.
Disclaimer
CGD blog posts reflect the views of the authors, drawing on prior research and experience in their areas of expertise. CGD is a nonpartisan, independent organization and does not take institutional positions.
Image credit for social media/web: Deemerwha studio / Adobe Stock