The
G8 summit in Heiligendamm, Germany, this week will focus global attention on African development and broader foreign assistance issues. Many analysts are examining the G8's progress towards its
pledge to double foreign assistance to Africa by 2010, made two years ago at the summit at Gleneagles, Scotland. Initial
partial evidence suggests that while progress is being made, several countries appear to be falling behind on meeting this pledge.
In a forthcoming CGD Brief, Sami Bazzi, Sarah Rose and I take a different approach and focus not on pledges, but on the
allocation of aid and how it has changed in recent years. In the late 1990s, donors began to state their commitment to providing more assistance to poorer countries and to countries with stronger governance. We provide a broad assessment of the extent to which this has occurred in practice. We examine these trends both for total aid, and for aid excluding debt relief and humanitarian assistance.
We begin by exploring the
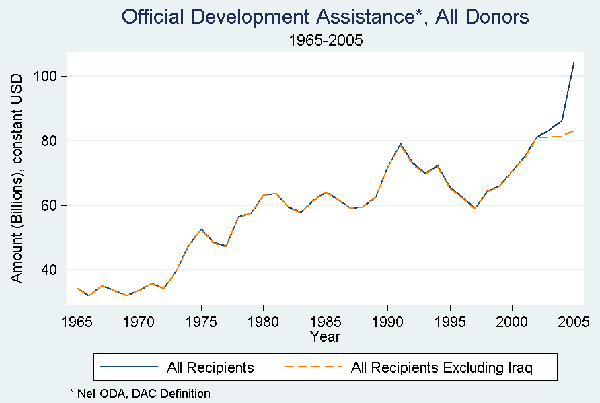
overall levels of Official Development Assistance (ODA) in recent years, both including and excluding Iraq. In 2005 Iraq received over $21 billion in ODA--nearly 20% of the world total--and became the largest single year recipient of development assistance in history.
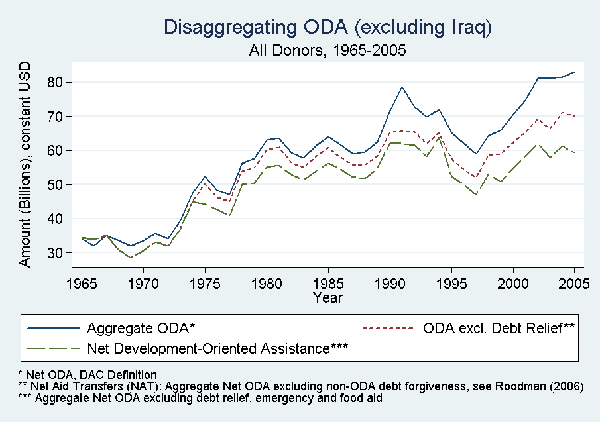
We then disaggregate total ODA (excluding Iraq) into amounts for debt relief (of non-ODA loans; see footnote in graph below), humanitarian and food aid, and the remainder, which we call Net Development-Oriented Assistance (NDOA). In the early 1980s, NDOA constituted about 88% of total ODA. By 1998-2001, NDOA had declined to 79% of total ODA, and by 2002-05 (excluding Iraq) it had dropped to about 74%. In total dollar amounts, global NDOA grew steadily from 1997 to 2002, but between 2002 and 2005 (excluding Iraq) it has remained basically unchanged at about $60 billion. In fact, in real U.S. dollar terms (i.e., after accounting for inflation and exchange rate movements) global NDOA between 2002-05 (excluding Iraq) was slightly lower than the level between 1990-94. It is clear from these figures that while global ODA levels have increased significantly in recent years, the bulk of the increases can be accounted for by aid to Iraq and for debt relief, particularly since 2002.
We then investigate the allocation of ODA and NDOA in two dimensions. First, we examine the extent to which aid allocation has changed by
income: How much aid goes to the poorest countries relative to other low-income and middle-income countries? Second, we explore how allocation has changed based on
governance: How much aid goes to better governed countries relative to more poorly governed countries?
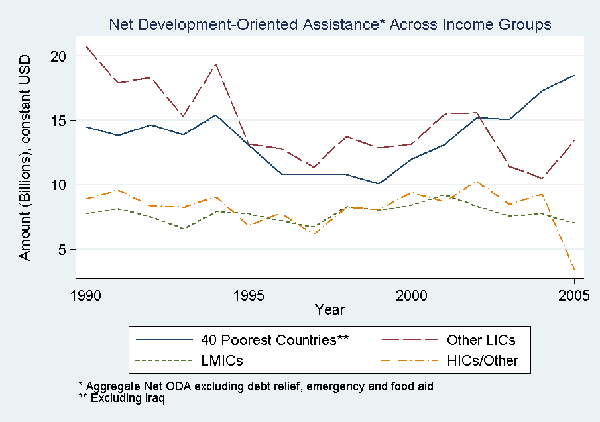
With respect to income we find that (excluding Iraq) more Net Development Oriented Assistance is being allocated to the poorest countries of the world, and less to middle-income countries. Bilateral donors in particular have increased NDOA to the poorest countries in recent years.
With respect to governance (as measured by the World Bank Institute's
governance indicators), two points are notable. First, the bulk of funds in both periods go to countries in the top half of the governance scores. Second, however, both the level and share of ODA going to the 25% of countries with the weakest governance scores has increased. This increase is driven largely, but not entirely by debt relief.
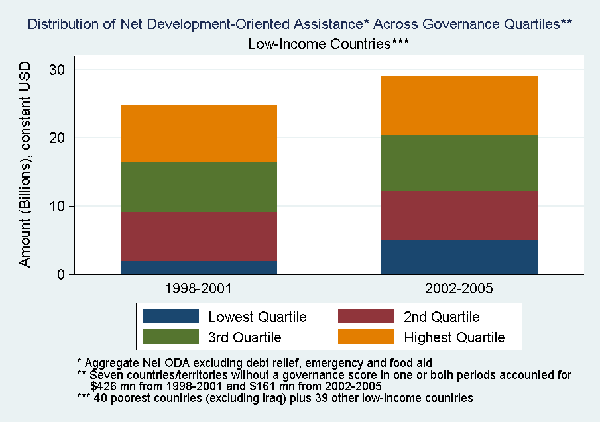
When we look only at NDOA (the figure below) which excludes the debt relief effect as well as any humanitarian and emergency assistance, we see a smaller change in allocation among the governance quartiles from one period to the next. Nevertheless there is a clear increase in both the amount and the share of funds going to the countries with the weakest governance scores. About 7% of NDOA went to countries in the weakest governance quartile in 1998-2001; that share increased to 17% in 2002-05. Looking at the countries in the bottom half (rather than quartile) of the governance ratings, 36% of NDOA went to these countries in the first time period, increasing to 42% in the second period. The increase is driven by large flows to Afghanistan, Pakistan, Ethiopia, and other countries with governance scores in the bottom half of the distribution.
CGD blog posts reflect the views of the authors, drawing on prior research and experience in their areas of expertise.
CGD is a nonpartisan, independent organization and does not take institutional positions.


 The
The  We then disaggregate total ODA (excluding Iraq) into amounts for debt relief (of non-ODA loans; see footnote in graph below), humanitarian and food aid, and the remainder, which we call Net Development-Oriented Assistance (NDOA). In the early 1980s, NDOA constituted about 88% of total ODA. By 1998-2001, NDOA had declined to 79% of total ODA, and by 2002-05 (excluding Iraq) it had dropped to about 74%. In total dollar amounts, global NDOA grew steadily from 1997 to 2002, but between 2002 and 2005 (excluding Iraq) it has remained basically unchanged at about $60 billion. In fact, in real U.S. dollar terms (i.e., after accounting for inflation and exchange rate movements) global NDOA between 2002-05 (excluding Iraq) was slightly lower than the level between 1990-94. It is clear from these figures that while global ODA levels have increased significantly in recent years, the bulk of the increases can be accounted for by aid to Iraq and for debt relief, particularly since 2002.
 We then investigate the allocation of ODA and NDOA in two dimensions. First, we examine the extent to which aid allocation has changed by income: How much aid goes to the poorest countries relative to other low-income and middle-income countries? Second, we explore how allocation has changed based on governance: How much aid goes to better governed countries relative to more poorly governed countries?
With respect to income we find that (excluding Iraq) more Net Development Oriented Assistance is being allocated to the poorest countries of the world, and less to middle-income countries. Bilateral donors in particular have increased NDOA to the poorest countries in recent years.
 With respect to governance (as measured by the World Bank Institute's

