
Just before COP28, the OECD reported that $90 billion (bn) of climate finance was provided in 2021, and suggested it was “likely” the overdue $100bn target was met in 2022.
In this blog we summarise our new analysis, in which we estimate with a high level of confidence that over $100bn of climate finance was indeed provided in 2022. In our central estimate, we project $106.8bn of climate finance was provided, meeting the goal in the OECD’s interpretation. We also consider how much of the finance is additional, and find that at least a third of climate finance was funded from existing development budgets, and that, in fact, providers have not increased their financial or fiscal effort as a share of their economies since 2009. We conclude with lessons for the new climate finance goal to be agreed at this year’s COP.
The climate finance target
In 2009, “developed” countries committed to provide or mobilise $100bn per year in international climate finance by 2020; the Paris Agreement extended the target, so contributing countries should meet the $100 billion target each year through to 2025. Although the 2009 Copenhagen agreement stipulated that funding would be “new and additional,” developed countries—through the OECD—have only ever reported the simple total of climate finance (formally it is the UN that measures progress biennially, but the OECD provides more timely analysis). Measuring progress against the target remains contested—with no standard definition of what counts as climate finance, inconsistent reporting standards across donors, and a two-year lag on official data reported to the UNFCCC among the issues—but in this analysis, we mirror as far as possible the approach taken by the OECD to assess the face value of climate finance commitments from “developed” countries to “developing” countries (see note for definitions of these groups).
We analyse the most recent data on multilateral and bilateral public finance in 2022, the two largest contributing categories of climate finance as per the OECD methodology, to make our own estimates based on the OECD’s interpretation of the target. We assume there is no change since 2021 in the other elements of the target—private mobilised finance ($14.4bn) and export credits ($2bn)—as they have been relatively flat for several years. We also make conservative assumptions about less-concessional bilateral climate finance that is only reported directly to the UNFCCC biennially and will not be publicly available until December 2024.
$100bn target met in 2022
If the target was to provide over $100bn in climate finance, we find that it was met in 2022. In our central estimate, we project $106.8bn of climate finance was provided. This would mark an increase of $17.2bn on the $89.6bn provided in 2021—the largest single-year increase since the OECD began tracking in 2013.
Figure 1. Estimates of total climate finance in 2015, 2021 and 2022 ($ billions)
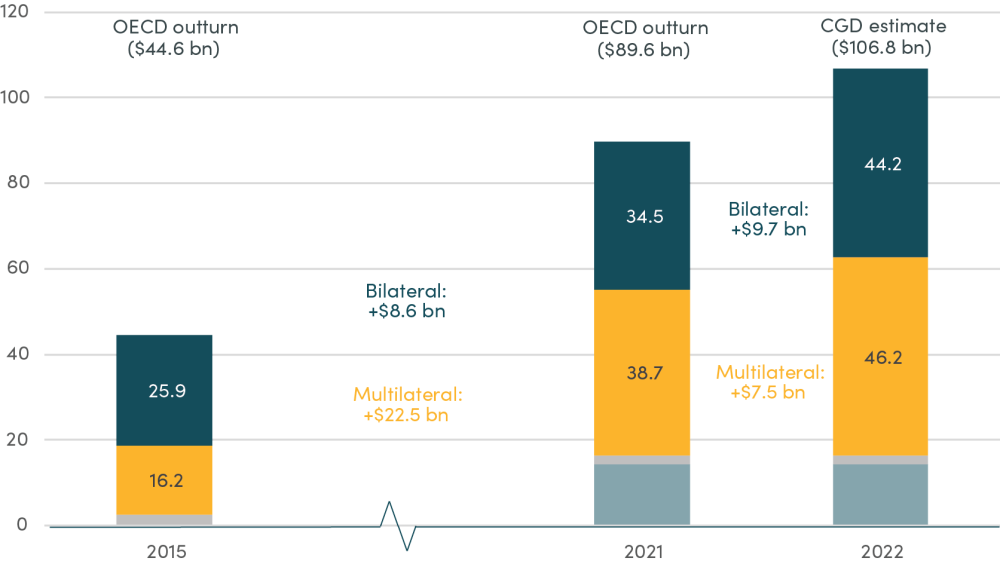
Source: Authors analysis and OECD climate finance tracking. Grey bars show private mobilised finance ($14.4bn, unavailable in 2015) and export credits and guarantees ($2bn).
Over half of the increase came from bilateral providers (+$9.7bn) and the remainder (+$7.5bn) was provided through the multilateral system. Our assumptions generally err on the conservative side, so the actual public finance figure could well be higher and, if export credits and/ or mobilised volumes rose/ fell, the increase could be larger/ smaller. Still, even in a conservative scenario, our projections of multilateral ($44.9bn) and bilateral ($42.4bn) public finance suggest the $100bn target was exceeded in 2022 by more than $3.5bn.
How did providers achieve the largest ever increase in climate finance?
For multilateral finance, there was a significant increase in total development finance (net official flows) to developing countries—of over $15bn. So, the $7.5bn increase in climate finance was part of this wider increase, with the MDBs reporting a higher climate share of their operations as a result (from 21 to 24 percent).
For bilateral finance, however, the increase was driven in large part by providers refocussing existing finance from other objectives to climate. Specifically, while support to Ukraine and for hosting refugees within their own countries increased (see chart below), wider bilateral development finance actually fell from $142bn in 2021 to $135bn in 2022. Within that reduced total, we estimate the share spent on climate increased steeply, from 17 to 25 percent. Put another way, one in every 13 existing projects (by value) were refocussed on climate in a single year.
Figure 2. Bilateral development and climate finance reported to OECD, and refugee hosting assistance
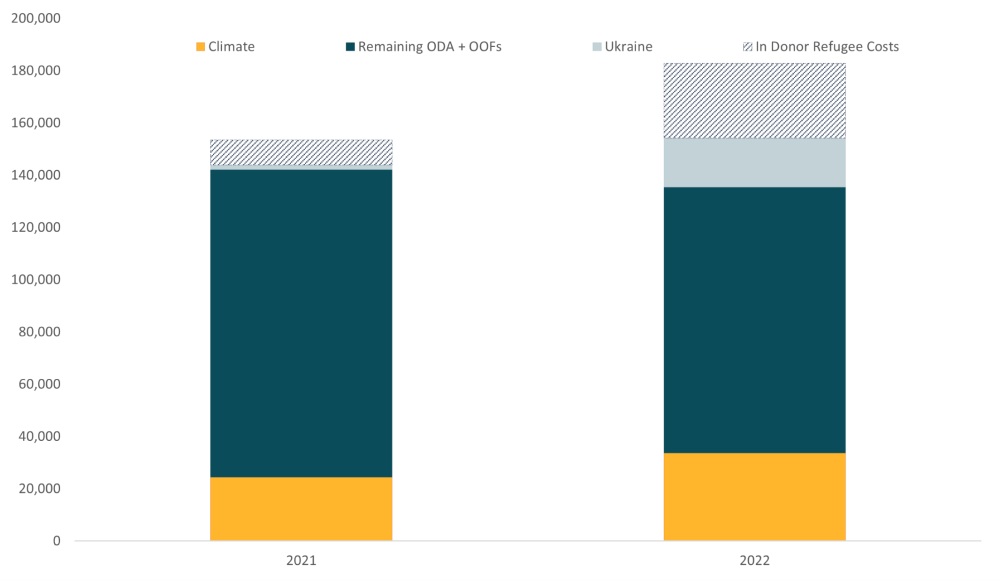
Source: Authors’ analysis. Climate figures are CGD estimates; other figures are OECD commitments data reported to the Creditor Reporting System (CRS).
Was the $100bn new and additional?
The original agreement on climate finance specified that finance would be “new and additional.” Although the definition of this was never formalised, it seems clear that developing countries might at least have expected that it should come on top of nominal development finance levels in 2009; and it wouldn’t have been unreasonable to expect it to represent an increase in the share of development finance expressed as GNI. In any case, climate finance is now such a significant part of development finance that assessing it in isolation gives a highly misleading picture.
For climate finance, looking back to 2009 is challenging as neither the UN nor OECD had reporting systems in place for measuring climate finance at that time: the first Biennial Reports covered 2011 and 2012, and the OECD did not start assessing progress until 2013. However, we have looked at total relevant international development finance to put progress on the $100bn climate finance goal in context. Specifically, this includes the face value (not just the grant element, but also the gross value of lending) of bilateral finance commitments (excluding refugee hosting), core contributions to multilaterals, and export credits to developing countries across all countries that the OECD considers as contributing climate finance (i.e. the 24 Annex II countries and the further 15 European countries who are included in the OECD’s climate finance report).
We find that:
- Since 2009, the face value of all public development finance has increased by $67bn to $243bn.
- That increase was achieved by providing a near-constant share of GNI. In 2022 it was 0.44 percent of GNI, slightly below the 2009 value of 0.45 percent.
- In terms of official development assistance (ODA) finance (excluding in-donor refugee spend), DAC countries provided 0.31 percent of GNI, which is unchanged from 0.31 percent of GNI in 2009.
As overall finance provided has only increased by $67bn, at least one third of the target $100bn must have been achieved by rebadging or refocussing existing development finance flows rather than as new and additional finance. This $67bn increase includes an increase in funding to multilaterals over the period but does not take account of efforts by MDBs to increase their lending relative to donor contributions. This is likely to increase finance available over the period, and going forward, though data is not readily available on outflows over the full period and we consider contributions to multilaterals to be a better measure of effort.
Figure 3. Total development finance, nominal prices
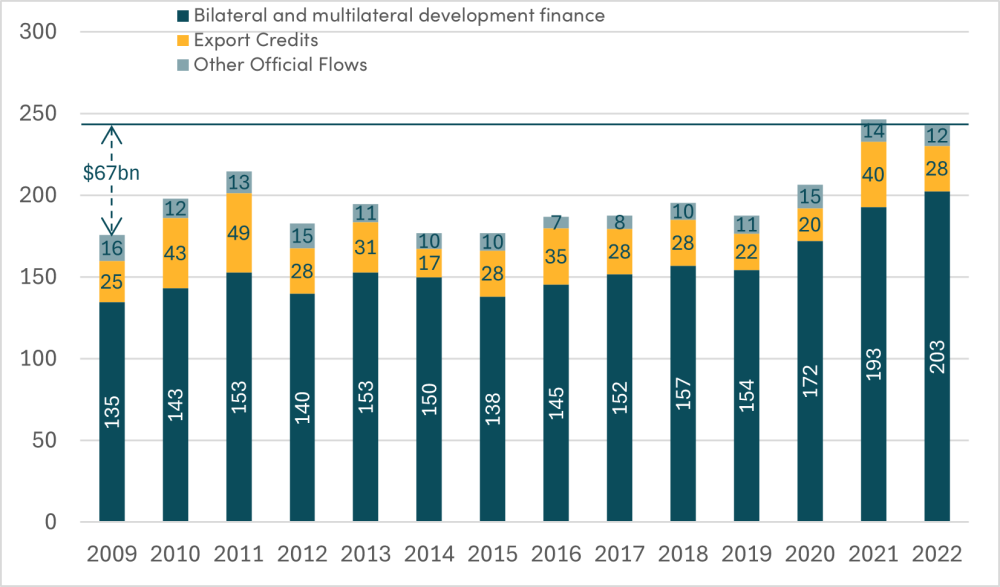
Source: Authors’ analysis of OECD data on gross disbursements
These statistics also show that the overall level of climate and development finance has not increased as a share of the providers’ economies: the remaining two thirds of climate finance has come from the expansion of budgets in line with inflation and GNI growth.
This is not to say the shift to climate finance hasn’t been valuable: it makes sense for any spending to consider climate change and, where appropriate, for climate objectives to be added. Some of the shifts are cosmetic, however, and CGD and other commentators have highlighted quality issues with climate finance, from slow disbursement, excessive use of loans, to a lack of focus on the poorest, and a large proportion being spent on mitigation—the benefits of which accrue globally rather than directly to the recipient.
Lessons for the post-2025 climate finance goal
The new collective quantified goal (NCQG) for climate finance is set to be agreed at COP29 and the Paris Agreement specifies it must be “from a floor of $100bn.”
The $100bn climate finance goal has led to significant sums of finance being directed towards projects with climate objectives, but it has not generated additional fiscal or financial effort from providers.
If negotiators from developing countries wish to see provider countries continue to refocus development resources on climate, then it seems a similar but higher target based on the face value of climate finance will achieve that aim. However, we would urge negotiators to pursue a target that increases the combined amount of climate and development resources (one suggestion here). If it was possible to express that target as an increased share of providers’ economies, it would make clear the fiscal effort involved and avoid inflation undermining the value of the finance provided.
Table 1. Comparison of total climate and development finance by “developed countries”
|
|
2009 |
2022 |
Change |
|---|---|---|---|
|
Face value (current) |
|||
|
All development finance* ($bn) |
175.6 |
242.7 |
+67.1 |
|
Climate finance ($bn) |
N/A |
105.6 |
+105.6 |
|
Fiscal effort |
|||
|
All devt. finance* (%GNI) |
0.45 |
0.44 |
-0.01% GNI |
|
ODA (exc refugee hosting)* (%GNI) |
0.31 |
0.31 |
- |
Notes: Development finance totals are for “developed countries” (see above for full definitions). Development finance includes ODA (excluding refugees), export credits and other official flows reported to the OECD. ODA as % GNI figures are for DAC members. Source: Authors’ calculations based on OECD and MDB climate finance data.
While there is also a need for private sector finance, we would also suggest that public resources are those most within the control of countries—as illustrated by the limited contribution of mobilised private finance to the $100bn effort—and we would urge the target to focus on those core resources.
Disclaimer
CGD blog posts reflect the views of the authors, drawing on prior research and experience in their areas of expertise. CGD is a nonpartisan, independent organization and does not take institutional positions.
Image credit for social media/web: Dana Smillie / World Bank