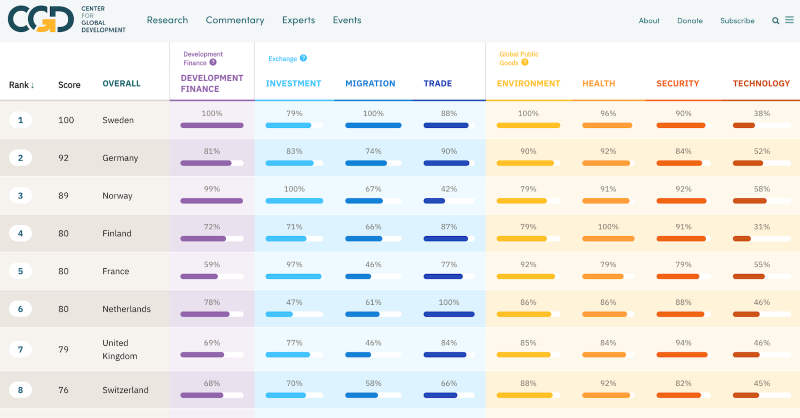
The Commitment to Development Index ranks 27 of the world’s richest countries on policies that affect the more than five billion people living in poorer nations. Those policies extend well beyond giving foreign aid, which is just one of seven components on the CDI:
- Aid
- Finance
- Technology
- Environment
- Trade
- Security
- Migration
The CDI gives credit for generous and high-quality aid, financial transparency and incentives for sustainable foreign direct investment, robust support for technological research and development, policies that protect the environment, open and fair trade policies, contributions to global security, and open immigration policies. Scores are reduced for barriers to imports from developing countries, selling arms to poor and undemocratic nations, barriers to sharing technology, and policies that harm global goods.
Why does the CDI matter?
The behavior of rich countries and powerful institutions profoundly affects the lives of people in poor countries.
In an increasingly integrated world, the actions of all countries affect others. Better public policies help build security and shared prosperity that benefits people in all countries, rich and poor. The CDI recognises countries whose behaviour contributes not only to their own prosperity, but also to the common good shared by all nations. It highlights particularly good policies where they occur, and identifies where some countries fall short. It is intended to help countries learn from each other, and hold each other to account, for the impact we have on each other and especially on the poorest countries and the poorest people.
Best and Worst Performers
The Nordic trio Finland, Denmark and Sweden has the best overall score because of their very good and consistent performance across the board. While Finland has outstanding polices in finance transparency, Denmark and Sweden have top marks in the quality and quantity of the aid they give. Switzerland ranks last despite its strength in technology. Its weakest policies towards developing countries are in the finance and trade components. Japan, ranking second last, lags in environment-friendly policies.
All countries perform poorly on one or more indicators and could do much more to spread prosperity.
Denmark ranks best on aid because of its generosity (0.85 percent of GNI) and effectiveness (a high score on the quality of aid). South Korea ranks worst with a small aid budget that is delivered relatively ineffectively. Norway does best on finance because of very good financial transparency and support for investment in developing countries. The United States comes last on finance, mainly because of relatively opaque financial secrecy rules and regulations measured in the Financial Secrecy Index. Opposite Denmark on technology is Poland, which spends only 0.35 percent of its national income on R&D (about one-third of Denmark’s 1.03 percent). Slovakia is in first place on environment with high gasoline taxes and low greenhouse gas emissions. Japan stands out as a poor performer with high tropical timber imports, low gasoline taxes, and limited reductions of greenhouse gas emissions. The Netherlands performs best on trade, imposing few restrictions on importing goods and purchasing services from other countries. In contrast, South Korea imposes some of the highest tariffs and imposes vast restrictions that stifle the import of services from elsewhere. South Korea is also last on security because it contributes relatively little to international peacekeeping, does not publish data on arms exports, and has not ratified major international security treaties. Norway is top-ranked with high contributions to peacekeeping, minimal arms exports, and participation in security treaties. Norway takes first place on migration, accepting a large number of migrants and bearing a large share of the refugee burden, unlike last-ranked Slovakia, which is relatively closed to migrants from developing countries.
Sweden ranks best on aid because it is the most generous donor out of all 27 CDI countries (1.09 percent of GNI) and provides that aid effectively. South Korea ranks last with a small aid budget (0.13 percent of GNI) that is delivered relatively ineffectively. Finland does best on finance because of its outstanding financial transparency and support for investment in developing countries. Despite its strength in International Investment Agreements (IIA), Switzerland comes last on finance, mainly because of its lack in financial transparency as measured in the Financial Secrecy Index.
South Korea has the best policies of technology transfer; Poland does worst on this measure, spending only 0.38 percent of its national income on R&D (compared to South Korea’s 3.26 percent). Slovakia retains first place on environment from last year with high gasoline taxes and low greenhouse gas emissions. South Korea on the other hand stands out as a poor environmental player with limited participation in biodiversity treaties and a small reduction in greenhouse gas emissions.
The Netherlands continues to take the top spot on trade. It imposes only few restrictions on importing goods and purchasing services from other countries. In contrast, South Korea has some of the highest tariffs and imposes significant restrictions that stifle the import of services from elsewhere, hurting the ability of poor countries to trade their way out of poverty.
Though Sweden has admirable policies on most components, it ranks worst on security because of its major arms exports and its limited contributions to international peacekeeping efforts. Austria is top-ranked on security with high contributions to peacekeeping, low arms exports, and a complete participation in the international security regime. New Zealand takes first place on migration, accepting a relatively large number of migrants and students and its very good integration policies (as measured by the MIPEX indicator). By contrast Slovakia does worst on migration, as it is relatively closed to migrants from developing countries . All countries perform poorly on one or more indicators, highlighting how much more all could do to spread prosperity simply by raising their performance to the level of other countries.

Aid
It’s important how much aid countries give, but how well they give it matters too.
Although only a handful of countries meet the internationally-accepted target of spending 0.7 percent of gross national income on aid, foreign assistance remains an important source of finance for some of the poorest countries. The CDI rewards countries that give more aid than their peers as a share of their GNI, but it also rewards the quality of aid as measured by the Quality of Official Development Assistance (QuODA) assessment. QuODA examines each donor’s development assistance on 31 indicators of the accepted aid-effectiveness principles of development impact, fostering institutions, reducing burden, and promoting transparency.
Sweden takes first place on aid because of its generous (1.09 percent GNI) and high-quality foreign aid. At bottom is South Korea, which contributed only 0.13 percent of GNI to aid and scores relatively poorly on aid quality.
Luxembourg and Norway are also very generous on aid, giving 1.06 and 1 percent of GNI each. In absolute terms, the United States gives the most foreign assistance, but it scores relatively badly because its aid represents only 0.19 percent of its national income. Compared to other CDI countries, Slovakia and Poland were the least generous aid donors, contributing only 0.09 percent of their GNI each to international aid.
Aid quality is notoriously difficult to measure, but can be as important as the amount of aid that a country gives. On our indicators, Ireland comes top, followed by Denmark and the UK. Canada gives aid to more effective multilateral agencies. To reduce the burden on recipient countries, Spain and Austria should increasingly coordinate their missions and Australia and New Zealand could invest more in multilaterals.
Finance
Foreign investment can drive growth and jobs in poor countries but also instability, corruption, and exploitation.
Foreign direct investment is the largest source of financing for many developing countries, with benefits to infrastructure, housing, transport, energy supply, and many other areas. Successful investment in the developing world can benefit everyone. The CDI therefore rewards wealthy countries with investment-promotion policies that are good for the investors and for the developing country by protecting their public policy interest and sustainable development. This can be achieved through balanced international investment agreements. Policies that allow for financial secrecy, in contrast, may enable tax evasion, money laundering, and corruption, which reduces money available to developing countries and degrade governance and international security. Using data from the Financial Secrecy Index (FSI), the CDI recognizes countries that have regulations in place to promote transparency in financial transactions within their jurisdiction and their sphere of influence.
Finland tops the league on finance, with high scores on both its sustainable support to investment and its transparency in the financial sector; Canada and Denmark come second and third. Despite its strong institutional commitment on investments, where it occupies a top position, Switzerland ranks last on finance because of its poor score on the FSI. Denmark is the most transparent financial jurisdiction out of all CDI countries according to the FSI. The Netherlands, the United Kingdom, and the United States are penalized for enabling secrecy jurisdictions within their sphere of influence; and the United States joins Switzerland near the bottom of the financial secrecy ranking. Canada and the United States are strongest on their international investment agreements with developing countries, whereas South Korea reports the highest volumes of non-ODA investment in developing countries.
Technology
Technology and knowledge are key drivers of human and economic development. Pro-poor policies promote dissemination.
Medicine, sustainable energy, information and communication technology, and other technological advances improve the lives of all of us. Technologies invented in rich countries, such as vaccines, the internet, mobile phones, and high-yielding grains have improved—and saved—many lives. Adopting technologies created elsewhere is one way that developing countries can keep pace with, and perhaps close the gap on, rich countries. But rich countries can impede the diffusion of knowledge and technology, and so prevent that catch-up, with excessively restrictive protections for intellectual property rights.
The CDI rewards government support for research and development (R&D) and policies that facilitate the creation and dissemination of innovations of value to developing countries. It marks countries down for policies on intellectual property rights that can inhibit the international flow of innovations.
South Korea, Portugal, and Austria show the biggest commitment to development in the technology component, thanks mainly to government and business expenditures on research and development. Poland and Hungary rank last on technology. Poland has among the lowest business expenditures on R&D and both countries spend only around 0.4% of their GDP on government support to R&D (compared to South Korea’s significant government expenses on R&D of 1.45%). Also, South Korea’s business expenditures on R&D significantly exceed those of other countries. New Zealand’s legislation on Intellectual Property rights (IPR) is the most development-friendly, followed by Canada and Australia. On the other side of the spectrum rank the United Kingdom and Sweden, which score at the bottom for intellectual property rights. This is mainly due to their right loss provisions, which potentially limit the spread of technology.
Environment
Climate change is regressive—awful for the rich, but catastrophic for the poor.
Rich countries are most responsible for anthropogenic climate change, but poor countries will suffer the most because they are more susceptible geographically and have less money and capacity to deal with the effects. Also, much of the world’s poor depend directly on their surrounding environment to meet their daily needs. Healthy ecosystems provide shelter, clean water and energy, food security, and income opportunities. Many policies and actions of richer countries degrade the natural resources on which the poor depend. The CDI therefore rewards countries for decreasing greenhouse gas emissions, implementing high gas taxes, not subsidizing the fishing industry, cutting imports of illegally harvested tropical timber, and committing to important international conventions. These measures benefit all countries— rich and poor—and time is running out for serious action to prevent damaging climate change.
Slovakia remains the leading CDI country in environment policies. Its gasoline taxes are among the highest of CDI countries, and its greenhouse gas emissions are among the lowest. South Korea takes last place with its limited commitment to biodiversity treaties’ obligations and its high imports of tropical timber. Hungary takes second place partly because of its high gasoline taxes. Portugal, Poland and Sweden share third place. Sweden reported the biggest percentage reduction in greenhouse gas emissions. South Korea, Japan and Australia are at the bottom of the environment component. These three countries all import high amounts of tropical timber. Australia ranks poorly overall because it produces a large amount of fossil fuel per capita, and has low gasoline taxes. The United States has the lowest gasoline taxes of all CDI countries, pushing it down the table. However, it slightly improved its score compared to last year because it signed up to the Paris agreement. In previous years, both the US and Canada had a lower score as they did not participate in the Kyoto Protocol (a predecessor of the Paris agreement).
Trade
Rich countries call the shots in trade negotiations; some poor countries lose out.
Trade provides poorer countries with opportunities to attract investment, create jobs, and reduce poverty. With rich countries largely in charge of the rules of trade, however, some goods that poor countries are best at producing still face trade barriers in rich countries. High tariffs, domestic subsidies that artificially make agricultural goods from poor countries too expensive, and burdensome red tape and legal restrictions all make it difficult for developing countries to complete and reap the benefits of trading on a level playing field. The CDI gives higher scores to countries most open to goods from developing countries, with low tariffs, few subsidies and streamlined importation processes. Improving market access for poor countries is an example of policy reforms which would benefit most consumers and taxpayers in industrialised countries as well as poor people in the developing world.
The Netherlands take top place on trade mainly because of its openness to trade in services and relatively few restrictions to imports. New Zealand and Denmark rank second and third respectively. The end of the trade table mirrors roughly the overall CDI ranking with South Korea, Switzerland, and Japan at the bottom. Japan has highest tariff rates on rice and South Korea on grains, seeds, and nuts. Switzerland has the most restrictive policies limiting trade in services. The Netherlands has the fewest restrictions on imports of services, according to the Service Trade Restrictions Index, whereas Denmark has the least burdensome import procedures. Slovakia strains importers with most unnecessary red-tape measures. Australia, New Zealand, and the United States are ahead of the pack on low import tariffs. In general, EU nations share common trade and agriculture policies and therefore their scores tend to cluster together on this measure. Norway and Switzerland languish near the bottom with high tariffs on meat, dairy products, and grains.
Security
Security and development are closely linked. War and political violence can destroy livelihoods and public institutions, while poverty and institutional weakness in turn make it easier for political violence and war to erupt. Such conflicts are not confined within borders. The CDI looks at four aspects of the security-development nexus: it rewards countries for contributing to peacekeeping and humanitarian interventions, for basing naval fleets where they can secure sea lanes, and for participating in international security regimes that promote non-proliferation, disarmament, and international rule of law. The CDI penalizes countries for some exports of arms, especially to nations with undemocratic regimes, and punishes countries if they don’t publish data on arms exports.
Rich countries have the power to enhance or degrade the security of people in developing countries.
Austria leads the ranking on security as it is a significant contributor to internationally-sanctioned peacekeeping and humanitarian interventions. It has also ratified all nine treaties through which the international security regime is measured in the CDI. France ranks second despite its relatively extensive arms exports. France remains the biggest financial contributor to peacekeeping missions and international sea lanes protection (in % of GDP). Ireland scores third due to its profound commitment to international security in all indicators. Sweden ranks at the bottom, as it is punished for its big arms industry, which exports to developing countries. The Czech Republic and South Korea are also close to the bottom for their low contributions to peacekeeping operations. While the Czech Republic also has a large number of arms exports, South Korea scores low due to its failure to ratify the Mine Ban Treaty, the Arms Trade Treaty and the Convention on Cluster Munitions. Australia is penalized for not making data on arms exports publicly available and for its low contributions to international peacekeeping efforts. New Zealand and Japan earn perfect scores on arms exports to developing countries (they have none). Japan has improved its score compared to last year mainly due to a bigger financial commitment to international peacekeeping operations. The United States is penalized for not ratifying the Ottawa Convention and the Arms Trade Treaty and loses additional points as the only CDI country that is not party to the Comprehensive Nuclear Test Ban Treaty or International Criminal Court.
Migration
Migrants from poor to rich countries send billions back to their families each year, a flow surpassing foreign aid.
Labour mobility is potentially the most powerful tool for poverty reduction and income redistribution. By migrating to richer countries, workers gain valuable skills and broaden their opportunities to earn higher incomes. They also send billions of dollars back home each year in remittances, a flow that significantly surpasses foreign aid. The receiving country also benefits from the contribution that migrants make to the economy and society. The CDI rewards countries for accepting migrants and students from developing countries, sharing the burden of refugees and asylum seekers, embracing migrant-friendly integration policies, and signing up to important international conventions protecting the rights of migrants.
New Zealand takes first place on migration, mainly for accepting a large number of immigrants and foreign students. It also scores high on the Migrant Integration Policy Index (MIPEX). Though it has the most development-friendly policies in migration, New Zealand has the potential to improve by signing the Convention on the Treatment of Migrant Workers. Sweden and Norway rank second and third on the migration component. Sweden stands out due to its high numbers of accepted asylum applications as well as its integration friendly policies. Norway has one of the strongest commitments to international conventions as it is one of only three countries (the others are Italy and Portugal) that have ratified all of the Migration for Employment Convention, the Convention on the Treatment of Migrant Workers and the Protocol to Prevent, Suppress and Punish Trafficking in Persons.
The Visegrad Countries Slovakia, Hungary, Poland, and the Czech Republic rank at the bottom of the migration component because of their significantly lower rates of accepting immigrants and their low score on the MIPEX. Japan also lingers close to the bottom of the table as it is not a party to any important international migration agreements. The same applies to South Korea, but it is doing well on the inflow of immigrants and students from developing countries which results in rank 12.

Methodological remark:
For calculation of the CDI, CGD generally uses the latest available data. However, it can happen that between the calculation of the index and its publication new data was made available. There is also an obvious time lag between the policies reflected by the index and the latest policies that have been introduced by CDI countries. An example of this can be seen in the migration component: the latest available data for many of the indicators is from 2014. Therefore, the results do not reflect policy changes some European countries have made in the wake of the inflow of refugees to Europe in 2015. These policies will be reflected in subsequent editions of the CDI when they are reflected in the official data.
For More
Visit cgdev.org/cdi to explore the Commitment to Development Index, view additional publications and background papers, and dive deeper into the CDI methodology, data, and code.
About the CDI
The Center for Global Development (CGD) has compiled the Commitment to Development Index each year since 2003. CGD is an independent think tank that works to reduce global poverty and inequality through rigorous research and active engagement with the policy community. CGD Europe director and senior fellow Owen Barder directs the Index, building on the previous work of former senior fellow David Roodman. Anita Käppeli is the policy analyst working on the CDI. The Index is supported by the CDI Consortium, which in 2016 included the following countries: Australia, Canada, Finland, France, Germany, Luxembourg, Norway, Sweden, and the United Kingdom. The content of this report does not reflect the official opinion of the Consortium members. Responsibility for the information and views expressed therein lies entirely with the authors.
Rights & Permissions
You may use and disseminate CGD’s publications under these conditions.