The World Bank has just released country-by-country data on the debt owed to individual creditors by the 73 countries eligible to participate in the G20-sponsored debt service suspension initiative. This is a welcome contribution to enhancing transparency of just who owes what to whom and how much debt service these countries are expected to pay to each creditor this year and for four years to come. President Malpass and his team should be commended for putting this information in the public domain—exactly the type of global public good the World Bank, with its detailed debtor reporting database, is well placed to provide. The intention is to update this data every week, which is an important incentive to countries and creditors alike to ensure that the numbers being used are accurate.
The tables bring new and interesting insights. Four struck me in particular:
The overall impact of suspending debt service due to official bilateral creditors, even for the 8 months of this year, is quite significant: the median saving across the 73 countries is 0.4 percent of GDP, with nine of them projected to save over 1 percent of GDP. So, limited and inadequate as it is, implementing the suspension quickly and completely is still an urgent priority.
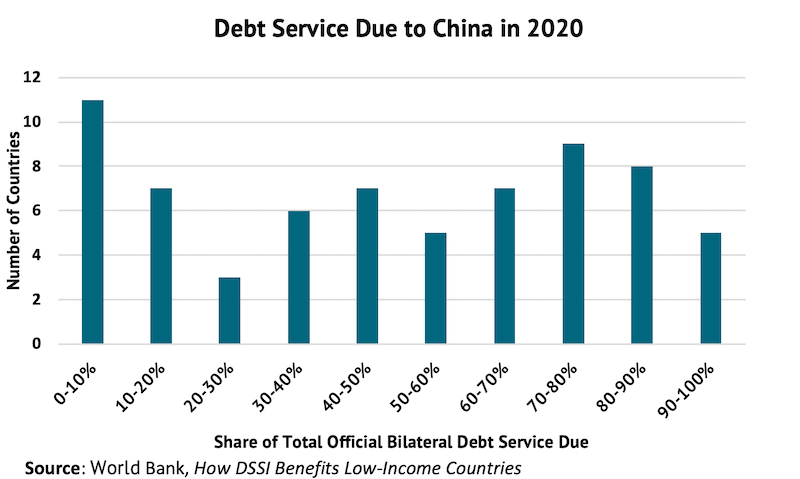
China is the largest bilateral creditor, often exceeding the combined weight of all other bilaterals, in terms of both debt stock and debt service. The figure below shows the distribution across countries of the share of bilateral debt service due to China. Given the design of the initiative, this translates proportionately into the share of the potential savings that will depend on China doing its share.
While the focus of the Debt Service Suspension Initiative (DSSI) is on official bilateral debt, the tables also helpfully show the debt service that is due to multilaterals, like the World Bank, the IMF and the regional development banks, and to the private sector. In many countries, these amounts are also quite large. As those who are following progress of the initiative know, conversations with the private sector have proven to be quite complex, and many countries are reluctant to even broach the topic with their private creditors because of the concern that this alone might be sufficient to trigger a ratings downgrade from the credit ratings agencies. And with the increase in the cost of market-based borrowing, even refinancing private debt becomes a very expensive option. As to the multilaterals, apart from the IMF, which has offset debt service from a subset of these countries (25 out of the 73), their main contribution is expected to be in the form of new funding which should—hopefully—at least be large enough to cover the debt service that they are taking out. This will be both particularly important, and more difficult, in the 41 countries where projected debt service to multilateral institutions is at least as large as that covered under the DSSI.
Finally, it seems self-evident, but these tables reinforce the importance of extending the duration of the DSSI beyond the end of this calendar year. Compared with the $12.1 billion of projected savings this year, an extension to the end of 2021 would save these countries an additional $16 billion. It is already clear that the crisis will not be over for them anytime soon and they will need all the help they can get. Some have argued that the G20 should agree to an extension when they meet in the Fall. It’s the right thing to do and will give low-income country policymakers clarity now on the DSSI savings available next year, enabling them to make important investment and spending decisions with better knowledge.

Helpful as these tables are, they have one important shortcoming that I hope the World Bank and/or the IMF can now take forward. They give a good sense of the potential savings from the implementation of the DSSI but provide no information on the status of implementation of the initiative itself. It is now three months since the initiative was agreed at the policy level: What has been the effect on actual debt service paid to the same bilateral creditors over these three months? What cash flow benefits have each of these low-income countries seen over these three months? We all agree that time is of the essence in fighting this unprecedented crisis, and additional cash is needed now to buy urgently needed health care supplies and to provide income support to households in lockdown. Is the initiative helping? Similarly, the multilateral institutions have made announcements of large amounts that they plan to provide to help these countries, but how much cash has actually made it out the door?
So, what I would like to see is a similar table for each debtor country showing the actual debt service paid for the three months since the initiative was announced, essentially the second quarter of CY2020, and also the new money provided by each of those creditors. As with the current tables, this should cover not only the bilateral creditors but also the private sector and the multilateral institutions to make public who is contributing what in helping with the current crisis. This information should be updated every month so that public scrutiny can help maintain and sustain momentum as the world emerges from what will be a deep and long shock. As a next step, the G20 should ask the IMF and World Bank to provide this information for a virtual meeting of finance ministers in July.
Disclaimer
CGD blog posts reflect the views of the authors, drawing on prior research and experience in their areas of expertise. CGD is a nonpartisan, independent organization and does not take institutional positions.
Image credit for social media/web: Center for Global Development