Recommended

WORKING PAPERS
Blog Post
Every week, new studies come out that have tested the impact of some program intended to improve student learning. Some of them increase the chances that students pass an important national exam by 15 percent. Others report that they boosted high school graduation rates by five percent. Still others improved student performance on an evaluation of a crucial basic skill, like literacy, by 0.2 standard deviations.
The gap in learning across countries is enormous. If you take the current rate of improvement in learning over time in one middle-income country and see how long it would take to catch up to the average learning level in high-income countries, the answer—in math—is a staggering 75 years. The gap within countries is also troubling: in another middle-income country, the poorest students in third grade are already three years behind the richest students in their mastery of content.
We need interventions that dramatically increase student learning. But what does “dramatically increase” mean? What is within the realm of current possibility?
The first step is to put test scores into a common unit, and the metric that researchers use most often is standard deviations. Several researchers—including me—have tried to translate standard deviations into more intuitive metrics, but that still doesn’t define a “big effect.” Many researchers are familiar with a set of benchmarks proposed by statistician Jacob Cohen in the late 1960s, that 0.2 standard deviations is a small effect size, 0.5 is a medium effect, and 0.8 is a large effect size. But the studies Cohen used to base that on weren’t even education studies!
How big are learning impacts really?
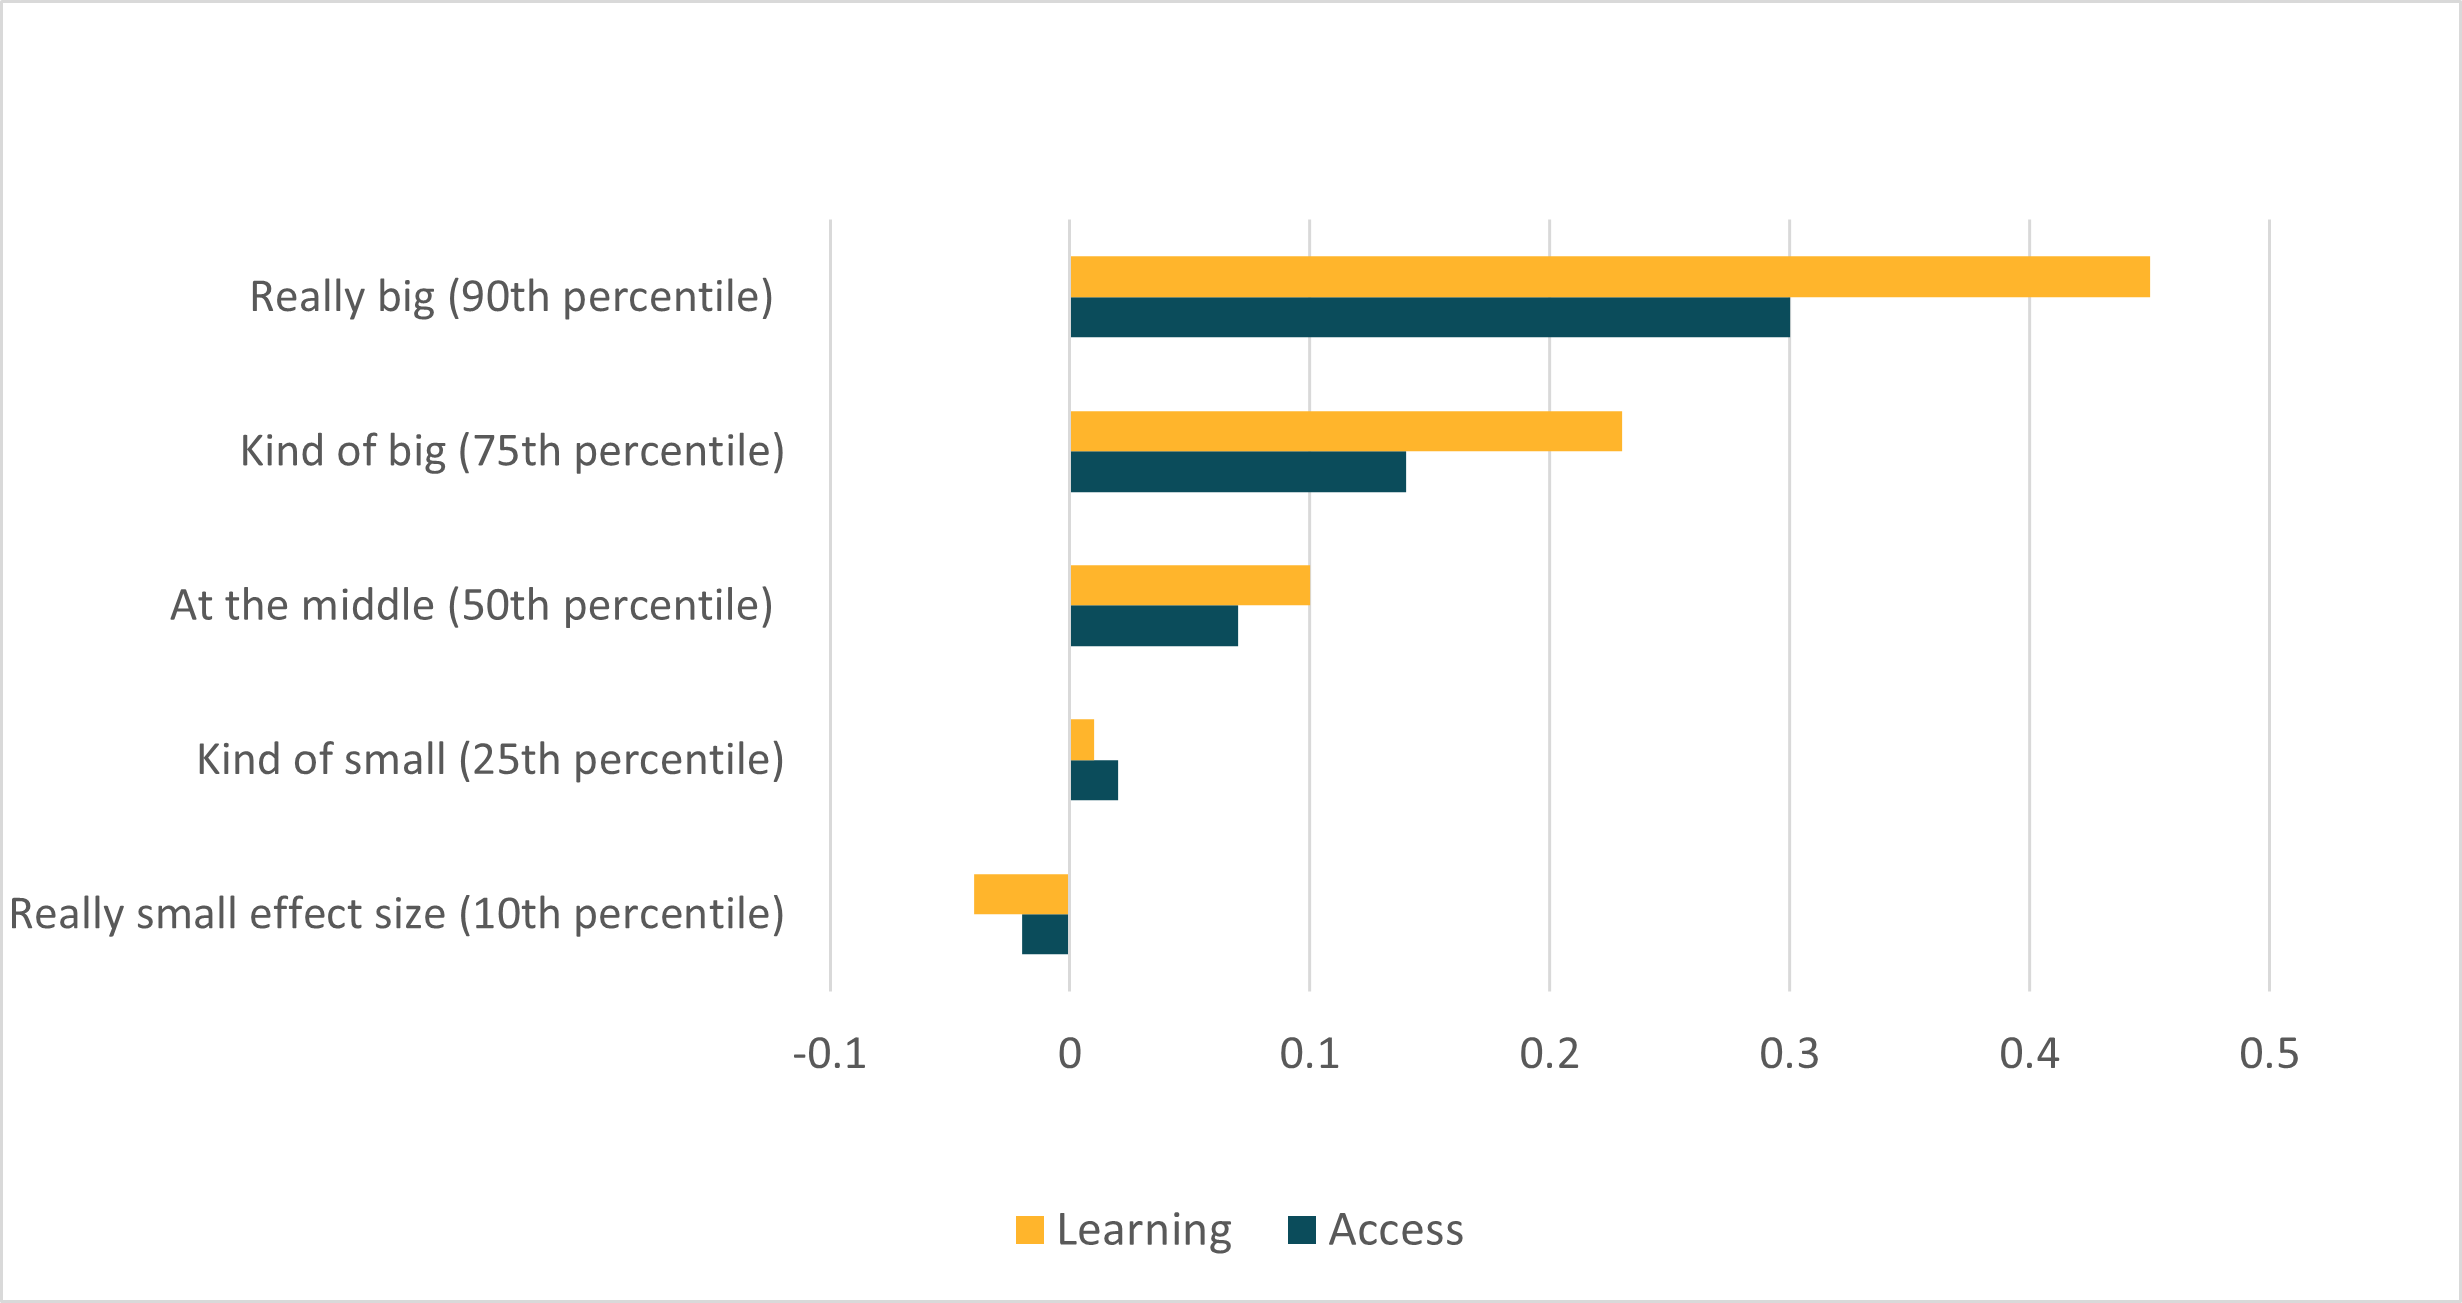
In a new study, “Interpreting Effect Sizes of Education Interventions,” Matthew Kraft examined nearly 750 randomized controlled trials (RCTs) of education projects with learning outcomes. (From the databases he searched, I imagine most are studies from the US and the UK.) The median effect size? Just 0.1 standard deviations. Even the 90th percentile effect size—so, if you take the biggest 10 percent of effect sizes, this is the smallest of those—is 0.47 standard deviations.
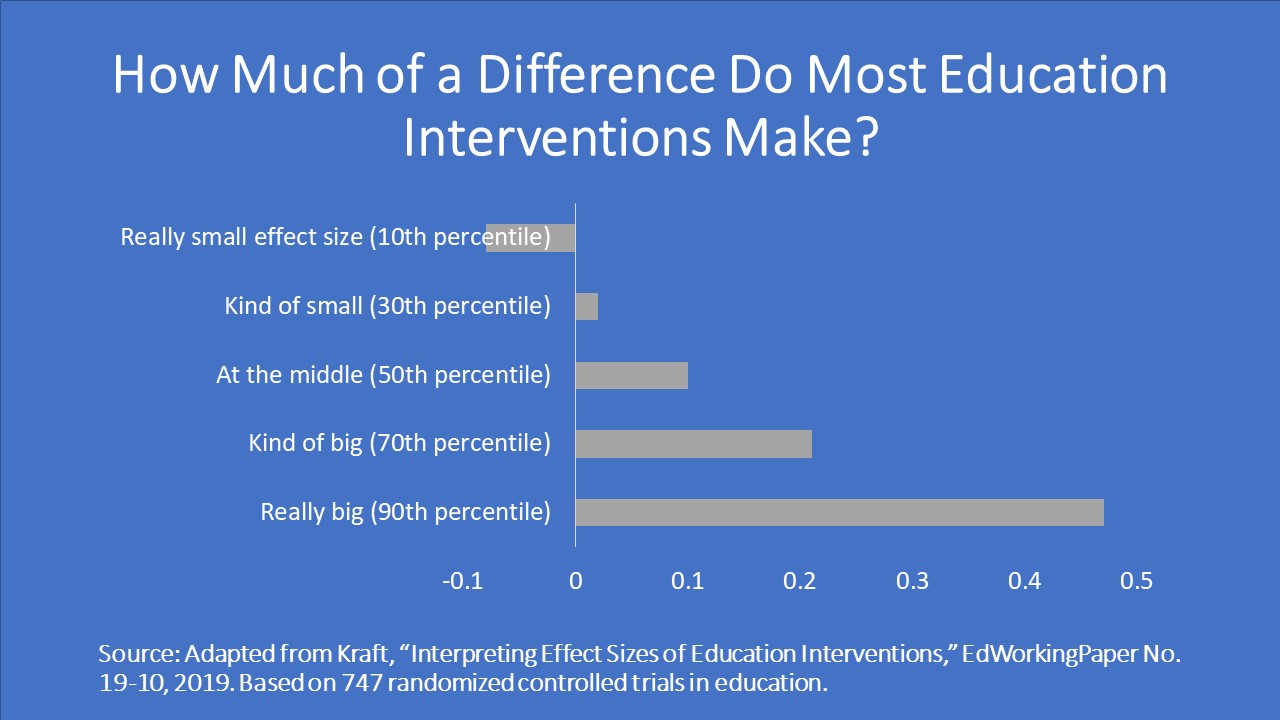
Given this distribution, Kraft proposes a new set of benchmarks: an effect less than 0.05 standard deviations is small, 0.05-0.19 is medium, and 0.20 or larger is, well, large. It would be useful to see a similar distribution for studies in low- and middle-income countries, but this provides a useful guide. If an education intervention has an impact of 0.5 standard deviations, then it’s in the top 10 percent of US/UK interventions.
Five factors to consider before you get too excited about that effect size…
Some studies show large impacts, but caution is still warranted. Kraft provides five factors to look out for.

-
Effects often appear larger in correlational studies than in RCTs, or in quasi-experimental studies that try to imitate the conditions of RCTs. Correlational studies often attribute differences between higher performers and lower performers (e.g., more motivated parents) to the program.
-
Effects are often larger when they measure outcomes that are closely linked to the intervention or right after the intervention. At first glance, this seems okay. If the intervention is about algebra, then we should test the kids on algebra to see if it worked, right? Sure, but if it doesn’t translate into gains in their overall math test, then the impact on their educational career may be muted. What’s more, a study that tests narrowly (on algebra and designed by the people who designed the intervention) and a study that tests generally (general math test, as part of the curriculum) won’t have comparable effect sizes.
Likewise, if the kids just had their algebra intervention, maybe we see an impact. (We hope so, anyway.) But what about three months later? Six months later? Kids forget stuff. Studies that measure right after the intervention and those that measure later won’t have comparable effect sizes.
-
Effects are sometimes larger in certain groups. A program that provides school meals is likely to have a larger impact on kids who don’t have meals at home than on kids who do. (In fact, that’s exactly what a study in Ghana found.) So a program that only evaluates the impact on kids who don’t have meals at home will likely have a larger impact than a program that just focuses on the kids most likely to benefit from the program. Studies that measure impact only for a likely high benefit subgroup and studies that measure for the broader population won’t have comparable effect sizes.
-
Effects for cheaper programs are more impressive than similar effects for more expensive programs. Most systematic reviews in education focus on which programs lead to the largest gains in student learning (or access to school). But obviously a program that delivers the same gains at a much lower price is better. Check the price tag!
-
Effects are often larger for programs that reach a few students than for programs that reach lots of students. Kraft compares studies that reach more than 2,000 students to studies with fewer than 100 students: The measured impacts are 8 times larger for the small programs! Why? Small programs can often use a few, carefully selected and highly motivated implementers. They can sometimes afford higher per-student costs. They can supervise carefully. When systems move to scale, the average quality of implementer may fall, the budget likely gets cut, and supervision is less intense. So, studies that measure impact for a small group of beneficiaries and studies that measure implementation at scale may not be comparable.
All of these factors make comparing impacts across interventions more difficult, but they also let us think more intelligently about comparisons. When two studies show comparable impacts, we can ask: was one of them implemented at larger scale? Did it show impacts that endured? Did the impacts only show up on the researcher-designed exam? How much did it cost?
There is no one intervention that will close the achievement gap between low-income countries and high-income countries. Education systems that want to improve will have to continually evaluate their education innovations for success and then interpret the results intelligently.
Disclaimer
CGD blog posts reflect the views of the authors, drawing on prior research and experience in their areas of expertise. CGD is a nonpartisan, independent organization and does not take institutional positions.
Image credit for social media/web: David Evans