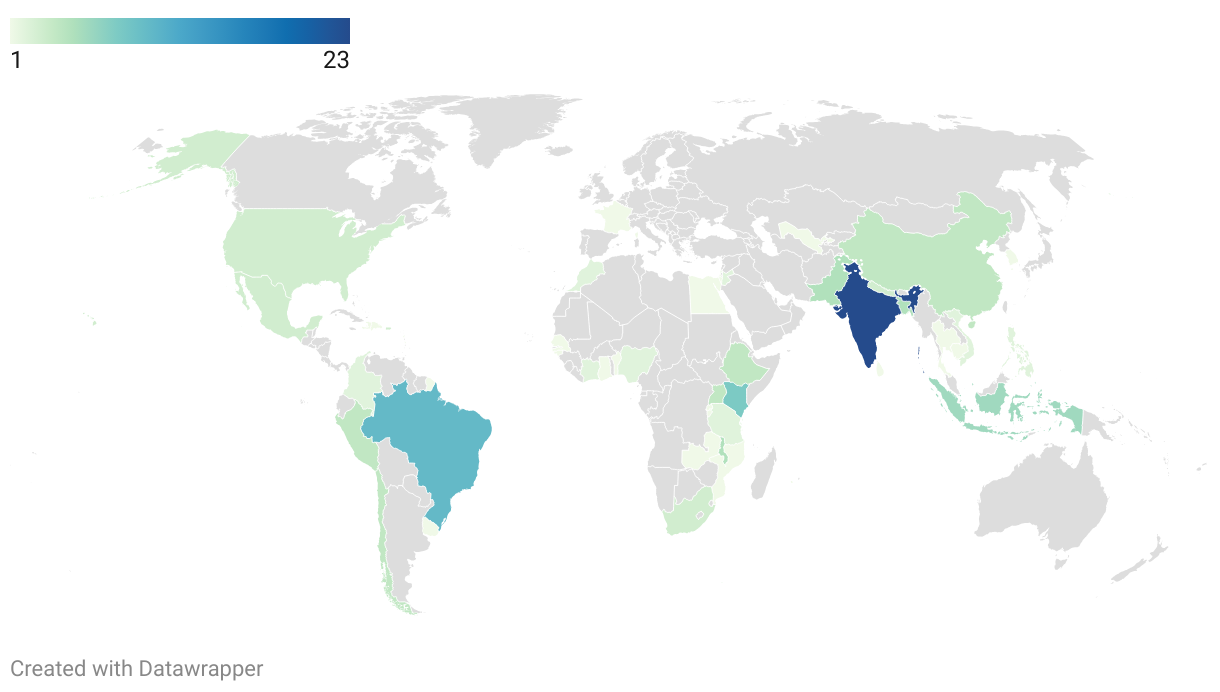
Financial inclusion—an individual’s access to bank accounts or other financial products—has improved around much of the world, but significant gender gaps remain. CGD will soon be releasing Citizens and States: How Can Digital ID and Payments Improve State Capacity and Effectiveness? In this report, we look at the state of financial inclusion around the globe using data from the 2017 Findex Survey. For a sample of 110,000 people in 99 countries (which represent 4.1 billion people), we find an 8.3 percentage point financial inclusion gap between men and women.
How can we account for this gap? Do gender gaps in financial inclusion reflect differences in observable characteristics such as income, education, or labor force status? Would the gaps persist if women had the same levels of education and income as men? Or, are other, less observable, factors at work?
In the report, we use a statistical tool, the Blinder-Oaxaca decomposition, to break down the global difference in financial inclusion among all individuals into several components. The report focuses on everyone pooled together, but the gender gap in financial inclusion actually differs a great deal between countries, varying from negative in a few—meaning more women than men have financial accounts—to as high as 30 percent in other countries where women lag far behind. This suggests that there could be large differences in the balance of factors behind the observed gaps.
Figure 1 graphs the relationship between the gender gap and log of GDP per capita over our sample of 99 countries. The gender gap favors men in most countries, although the fitted line shows that gender gaps tend to close at higher levels of income. Nevertheless, some notable outliers like Turkey, Lebanon, and Algeria suggest that higher income does not inevitably lead to a more equitable pattern of financial inclusion.
Figure 1. Men are more likely to be financially included in most countries, although the gap closes somewhat as income rises.
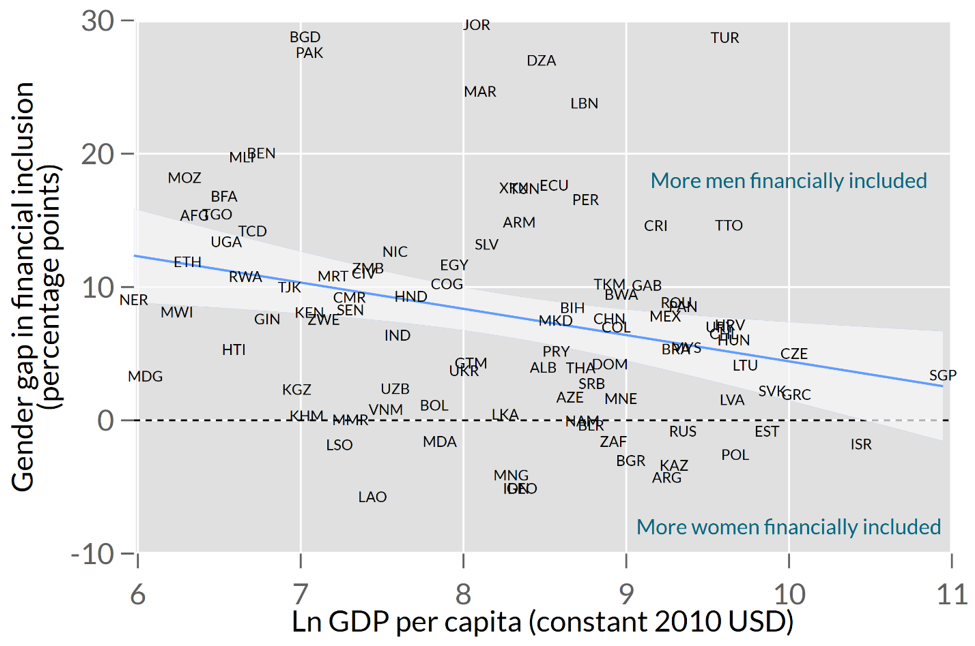
Shaded area around the fitted line shows a 95 percent confidence interval. Source: Global Findex 2017.
Breaking down the predictors of the gap
The Blinder-Oaxaca decomposition breaks down the difference in financial inclusion into three components. The “endowment effect” estimates how much the financial inclusion gap would change if women had the same observed endowments as men. The Findex survey provides a number of observable characteristics, or endowments, that we can use to try to explain the gap: income quintile, workforce status, education level, access to government-issued ID (important to comply with know-your-customer requirements in many countries), possession of a mobile phone, and whether the individual received a government transfer in the last year—all of which tend to lead to higher financial inclusion. The “coefficient effect” estimates what would happen to the gap if better endowments, such as higher income, increased women’s inclusion as much as that of men. Put simply, we are trying to figure out to what degree the financial inclusion gap is because women have less income, education, etc. than men (endowments), and to what extent they are less financially included despite having the same income, education, etc. as men (coefficients). There is also an “interaction effect,” which represents the simultaneous effect of the differences in endowments and coefficients.
Applying the decomposition to the aggregated individual data (106,571 people across 99 countries) produces statistically significant effects for both endowments and coefficients, but not of the interaction term. The combined influence of the endowments is around twice that of the coefficients, meaning about two thirds of the financial inclusion gap would be closed if women simply had the same observed levels of income, workforce status, education, etc. as men. The coefficient effects accounted for only 2.5 percentage points of the gap in financial inclusion, less than one third of the total gap. This suggests that improving women’s education, income, and other characteristics could close most of the observed gender gap in financial inclusion.
Shifting the analysis to the country level
The findings we present in the report use the pooled global individual data, but that masks substantial differences in endowment and coefficient effects across countries. The beauty of the Findex microdata is that it offers around 1,000 observations for each country. Figure 2 shows the results of the decompositions for each of the 99 countries in the data. Each point represents an individual country’s endowment effect (on the vertical axis) and its coefficient effect (on the horizontal axis).
Since the total inclusion gap is approximately the sum of the endowment and coefficient components (interaction effects are small), a country in which neither endowments nor coefficients impede women’s inclusion relative to men (i.e. a country with little-to-no gender gap) will appear close to the origin in Figure 2—Thailand and Russia are good examples. Countries situated high up and close to the vertical axis, like Togo, manifest a large financial inclusion gap which can almost entirely be attributed to women’s less advantageous endowments, like education. On the other hand, in countries situated low down and far out along the horizontal axis—if there were any—women would be experiencing a large financial inclusion gap despite having identical levels of education, income, labor force participation, and other endowments compared to their male peers. The intuition for this axis is that there is something else outside of these observed characteristics which is impeding women’s financial inclusion. That could be patriarchal social norms that restrict women’s agency, autonomy and social or financial independence. It could also be legal forms of discrimination which restrict their ability to access financial tools.
Figure 2. Country-level breakdown of whether endowments or coefficients are responsible for more of the gender gap.
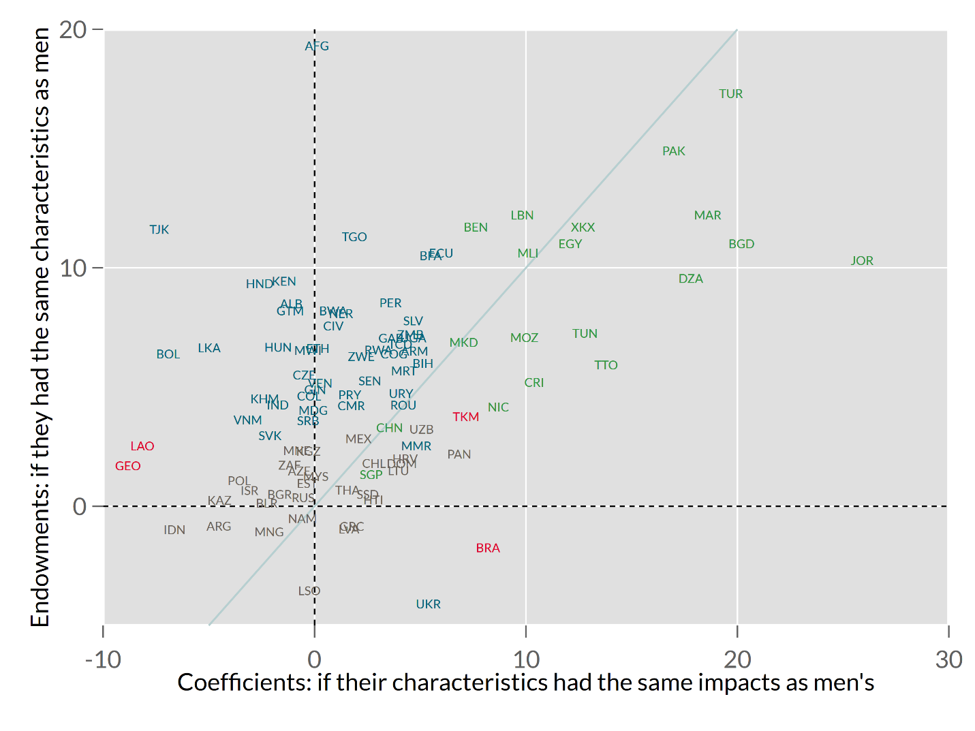
Note: Country codes are shaded to indicate the statistical significance of each coefficient. Gray means that neither factor is significant at the 95 percent confidence level, teal indicates significant endowments, red indicates significant coefficients, and green indicates both are significant. See this link for the ISO3 codes; XKX is Kosovo.
Endowment effects dominate…
The distribution of the points confirms what we saw in the pooled data. Endowment effects tend to dominate for most countries, as seen by the vertical bunching around the vertical axis representing small coefficient effects. Unsurprisingly, the vast majority of countries have male-dominated gender gaps for endowments.
At the same time, there are exceptions to the trend. In a few countries like Laos, Georgia, and Bolivia (and others to the left of zero), women have better financial inclusion outcomes than men with identical characteristics.
… but they’re not the whole story
The most attention-grabbing part of this graph is also the most troubling: the outliers in the top right quadrant, countries where the financial inclusion gap is the largest. In Pakistan, for example, the total gender inclusion gap is the sum of the endowments gap of 15 percentage points and a coefficients gap almost equally large, for a total gap of almost 30 percentage points—far above the weighted average gap of 8.3 percentage points in the cross-country data. These are countries where women face major obstacles to attaining parity on endowments like education and income, and even then, have difficulty leveraging their endowments into access to finance.
Something else is blocking their access to finance in these countries—something to the tune of 28 percentage points in Jordan and 20 percentage points in Turkey and Bangladesh. Are legal regimes blocking the way? Simple OLS regressions of the endowment and coefficient scores on the World Bank’s Women, Business, and the Law Index scores for 2017 show that both are strongly and inversely correlated with the Index, but only explain about 12 percent of the variation. Thus, legal discrimination is probably contributing to the gaps, but not enough to rule out social norms.
These financial inclusion gaps are not just large; they should profoundly concern policymakers and motivate us to understand what other barriers are being erected around access to finance. In most countries unequal access to things like education, mobile phones, and work open up financial inclusion gaps. Of course, we know that much of that denial of access can come from social norms or legal discrimination against women. Compounding the problem, in some countries we find that there are also strong unobservable factors which are impeding financial inclusion—meaning that even with the same endowments as men, women face additional barriers to financial inclusion. Dismantling the unobserved barriers is a major task facing policymakers.
Special thanks to Mead Over for introducing me to the Blinder-Oaxaca decomposition and commenting on this post, as well as Megan O’Donnell and Alan Gelb for helpful comments.
Disclaimer
CGD blog posts reflect the views of the authors, drawing on prior research and experience in their areas of expertise. CGD is a nonpartisan, independent organization and does not take institutional positions.