Just weeks into his presidency, Joe Biden announced a suspension of arms sales to Saudi Arabia and the United Arab Emirates—arms which were likely to exacerbate the humanitarian emergency in Yemen. This follows similar promising commitments from Italy last month.
As security and development are mutually reinforcing concepts, what countries do on arms exports matters for development. In this blog, we look at arms exports across all major economies—both in terms of value and their “conflict potential.” We analyse the extent to which the choice of arms customers is likely to increase risk and undermine development, and highlight which countries should be taking more action on reducing the conflict potential of their arms exports.
Our analysis for the 2020 Commitment to Development Index suggests that Israel, Russia, China, and the UAE’s arms exports are both large in proportion to their economies as well as conflict-prone (with their arms sales customers scoring higher in terms of risk as described below). Still, among the OECD, Czechia, France, and the United States also come in the bottom half of countries on both measures of export value and its risk. Additionally, Canada comes in the bottom three on the conflict-potential of export destinations.
Despite public interest in this, many countries are still failing to provide the information necessary for analysis. Australia, New Zealand, Japan, and South Korea are not fulfilling their minimum commitments on disaggregation under the Arms Trade Treaty; no data at all is available for four countries (Argentina, Saudi Arabia, Mexico, and Chile), and others, such as the United Kingdom, do not fully report arms sales made under all licenses.
Finally, we set out our new methodology on export risk to serve as an input to decision-making on exports, and we welcome feedback on the approach (reach out to us via bcichocka@cgdev.org or comment below).
Figure 1. Countries’ arms export value and conflict-potential of their customers
(based on recipients’ position in our conflict risk index, below)
Source: CGD’s analysis for the Commitment to Development Index (link to full methodology)
Why security matters for development
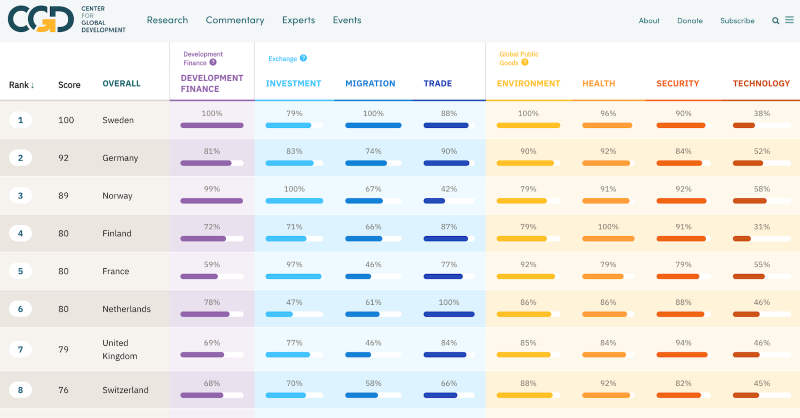
Security and development are closely interlinked: one cannot exist without the other. War, political violence, and instability can reverse years of social and economic progress in months as they harm government infrastructure, civilians, and their homes and livelihoods—one only need to look as far as Syria for proof of concept. That’s why, alongside development finance, investment, migration, trade, environment, and technology, security is one of seven components measured in CGD’s Commitment to Development Index (CDI), which ranks 40 of the world’s most powerful countries on their policies which affect people in poorer nations. Two of our security indicators focus on the supply of arms to other countries and together account for 25 percent of the weight in the security component (more on this in the full CDI methodology).
Who exports the most arms?
In order to estimate the value of arms exports we collate comparable estimates of arms trade volume, disaggregated by destination. It is worth noting that due to transparency issues (particularly for some of the non-OECD countries) these estimates are by no means an exact science. These are based on official sources, news reports, estimates by other think-tanks, or, as a last resort, scaled estimates from the Stockholm International Peace Research Institute’s Trend Indicator Values.
Overall, we find that the annual value of arms sales is substantial and is similar in magnitude to the value of development finance. Across 36 countries with available data, annual arms sales amounted to over $108 billion in 2017/18 based on our best estimate. For the same countries, development finance spend was $147 billion in 2017 according to our Finance for International Development measure.
The top arms exporters in absolute terms include the US ($30.9 billion in 2017) Russia ($15.8 billion in 2018), China ($10.9 billion in 2018), France ($8 billion in 2018), and South Korea ($7.4 billion in 2018).
In our measure, which is relative to the size of the economy, Israel comes in prominent last (worst) place for arms export volume, with a whopping 1.9 percent of its gross national income (GNI) exported in arms. In second-worst place is Russia, with 0.92 percent, and then there’s a large gap to South Korea who export 0.37 percent. Japan, which continues to have a “Pacifist Constitution” (despite incremental expansions on the interpretation of its 9th Article, which restricts the use of force and forbids having a military) scores best on this measure.
Figure 2. Country’s arms sales relative to their economies since 2014, highest to lowest
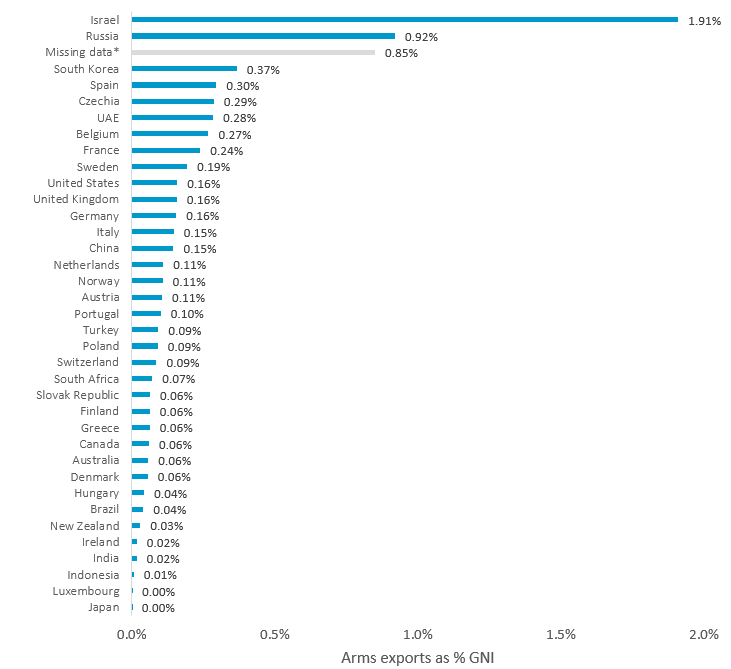
*Note: the figures for arms exports use a multi-year average to smooth lumpiness, with 50 percent based on the most recent year, and 50 percent coming from the average of other years since 2014. Argentina, Saudi Arabia, Mexico, and Chile do not report arms export data and are given a score equivalent to the worst score minus 1 standard deviation, or 0.85 percent of GNI
Who sells arms to the most conflict-prone countries?
Numerous case studies as well as a growing body of statistical analysis strongly support the idea that arms exports not only contribute to prolonging conflicts, but also increase the probability of onset where risk factors are already present. Though by no means exhaustive of the many complexities of each individual conflict, we construct a simple index to provide a snapshot of aggregated risk.
So how is the customer risk factor calculated? In short, informed by research from RAND, we assess poorer, more militaristic, and less democratic countries as more likely to engage in both intra- and inter-state conflict. The Cato Institute produces a similar index of arms sale risk, which places more emphasis on imminent and internal risks stemming from corruption and instability. Still, we place emphasis on long-term risk factors, including economic development and accumulation of arms (militarisation).
-
Low-income levels: Slow growth and scarce domestic resources can be drivers, particularly of intra-state conflict. Economic growth (if broadly shared) strengthens state capacity and increases opportunities for employment—thus raising the opportunity-cost of participating in violence. As low income means individuals are less resilient to conflict, we capture this and proxy (historic) economic growth through looking at the level of income (GNI) per head.
-
Lack of Democracy: Non-consolidated democracies are at greater risk of both inter-state conflict, and of resorting to violence against their own citizens. We proxy this by using the World Governance Indicator’s measure on Voice and Accountability.
-
Militarization: If a country is already spending large proportions of its income on arms, this may signal a militaristic stance. Further, it diverts crucial resources away from other important development goals. We proxy militarism by SIPRI’s measure of military expenditure.
Importing countries are then ranked and scored from 1 to 10, with the three factors given equal weight.
Table 1. Arms customers which are most and least conflict-prone according to our arms risk index
| Rank | Top (most conflict-prone) | Risk Score |
|---|---|---|
| 1 | Libya | 10.0 |
| 2 | Saudi Arabia | 9.9 |
| 3 | Syria | 9.9 |
| 4 | Oman | 9.8 |
| 5 | Yemen | 9.8 |
| 6 | Algeria | 9.7 |
| 7 | Djibouti | 9.7 |
| 8 | Uzbekistan | 9.6 |
| 9 | Jordan | 9.5 |
| 10 | Sudan | 9.5 |
| Rank | Bottom (least conflict-prine) | Risk Score |
|---|---|---|
| 160 | Luxembourg | 1.0 |
| 159 | Switzerland | 1.1 |
| 158 | Ireland | 1.1 |
| 157 | Norway | 1.2 |
| 156 | Denmark | 1.2 |
| 155 | Austria | 1.3 |
| 154 | Qatar | 1.3 |
| 153 | Sweden | 1.4 |
| 152 | Netherlands | 1.5 |
| 151 | Belgium | 1.5 |
*Source: CGD’s analysis (link to full CDI methodology); full details available on request
To calculate the overall “conflict potential” of each exporting country, we weight according to the proportion of exports going to each of the customers by their scores (above). So, a score of 1 for an exporter would be achieved by sending all exports to countries as conflict prone as Luxembourg, and a score of 10 would mean all exports went to a country like Libya.
Figure 3. Conflict potential of arms sale destinations

Source: CGD’s analysis for the CDI (full methodology)
Note: Missing data on exports is penalised in the value of exports (above) so here countries with missing data receive the average.
Of OECD countries, Canada has the highest risk (in rough terms, its average importer is slightly more conflict-prone than Belarus). Notably, the US scores just outside the bottom ten with a relative risk score of 5.0 (its average importer is about as conflict prone as El Salvador). The countries which send arms proportionally to the least conflict-prone partners are Luxembourg, Denmark, and Austria.
Transparency and ethical commitments in the Arms Trade Treaty
Within the participation in international security treaties sub-component of the security component, we further track country participation in the Arms Trade Treaty (ATT). Celebrated as a paradigm shift in 2014 when it was concluded, it aims to curb illicit arms trade, increase the degree of transparency, and restrict sales when the exporter has knowledge that arms “would be used in the commission of genocide, crimes against humanity, grave breaches of the Geneva Conventions of 1949, or attacks directed against civilian objects.”
Not all CDI countries are signatories—China, India, Indonesia, Israel, Russia, Saudi Arabia, Turkey, UAE, and the US are not—yet many of the ones which have are still sending arms to high-risk countries, despite ethical commitments.
Further, the ATT’s minimum transparency requirements include providing full annual reports with descriptions of transferred weapons, financial value of licenses, transit countries, and recipient country. Yet, signatories’ reporting remains inconsistent. Australia, New Zealand, Japan, and South Korea do not fulfill the minimum requirement of disaggregating figures by recipient countries (for the CDI, estimates were used from SIPRI). Other transparency problems are also common. To cite just one example, while the UK reports on its standard arms export licenses, there is another class of open licences which allow an unlimited and unspecified amount of exports of specific goods to specific countries. Licensees aren’t asked to report this to the Export Control Joint Unit.
Awaiting improvements on arms trade transparency and screenings
With the harmful role of arms sales towards the humanitarian emergency in Yemen back in the spotlight, the ongoing process for the UK’s integrated review on security and development, and China considering joining the ATT, we hope the time is ripe to reinvigorate the debate around global arms sales.
Even with recent promising commitments from the US and Italy, the world is far from turning the tide on risky arms sales as other countries continue to face both international and domestic opprobrium for their arms sale records (see also, news from: the UK, Australia and Canada). In doing so, these countries may be working against themselves in in development and trade, and undermining global security.
We look forward to countries working towards greater transparency as well as better screening of arms exports towards recipient country risk, and will continue to measure their progress in the Commitment to Development Index 2021.
Disclaimer
CGD blog posts reflect the views of the authors, drawing on prior research and experience in their areas of expertise. CGD is a nonpartisan, independent organization and does not take institutional positions.