But don’t celebrate too quickly. There was an increase in the share of kids, especially poor kids, who can’t even recognize letters or numbers.
A couple weeks ago, Uganda finally ended the longest national school closure on record, reopening its public schools after nearly two full years. The New York Times ran a good piece with first-hand reporting about some of the potential fallout (teachers who left the profession, pre-schools that shuttered, and adolescent girls who got pregnant and are unlikely to return to school). But there was a notable lack of real systematic data in any of the press coverage I saw.
So I was excited last week when Uwezo Uganda released a new report on its latest national learning assessment. The data were collected in August 2021, more than a year after schools initially closed in March 2020, and allow for direct comparison to the pre-pandemic Uwezo round in 2018.
In a country with limited data on education outcomes, the Uwezo surveys are an unrivaled resource. Crucially for pandemic purposes, Uwezo samples households rather than schools, so the survey is representative of all kids aged 6 to 16, including those who aren’t enrolled.
The first systematic data on learning levels in Uganda during the pandemic show both good and bad news
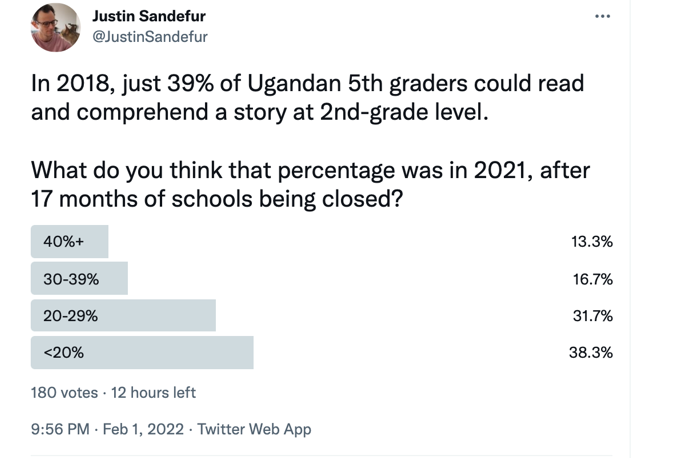
After 17 months without school, one might anticipate a fairly dramatic decline in learning levels. Indeed, in a very non-scientific poll of my twitter followers, the dominant view was that reading levels would collapse.
That is not exactly what the Uwezo team found, however. On Uwezo’s headline measure of reading competency, the new data reveal essentially the opposite: an improvement.
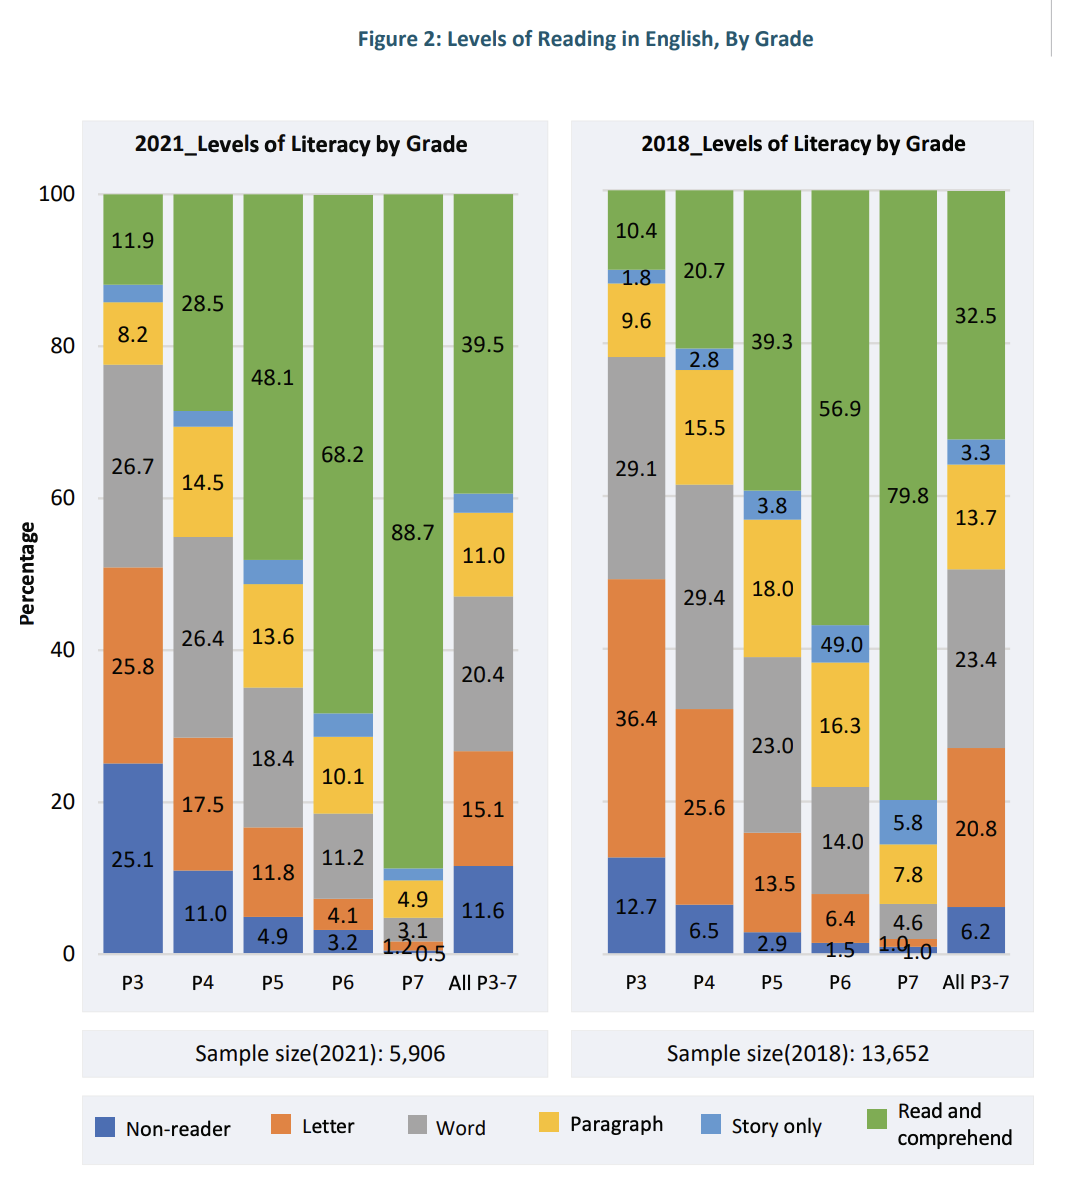
“The proportion of children fully competent in English reading (ability to read and comprehend a P2 level English story) for the whole set of grades P3-P7 has risen from 32.5% in 2018 to 39.5% in 2021.”
I had to read that several times. Schools had already been closed for more than a year and a half, and reading comprehension had gone up? How is that even possible?
Now, before we dig into this mystery, note the data also show fairly significant learning loss at lower parts of the learning distribution.
“[T]he overall proportion of children who are still in the ‘non-reader’ stage (i.e. those who could not read or sound out letters of the alphabet) doubled from 6.2% in 2018 to 11.6% in 2021. For P3, the proportion of non-readers increased from 12.7% in 2018 to 25.1% in 2021.”
That deterioration is still probably less severe than my subjective expectations, but a quarter of kids in 3rd grade not being able to recognize the letters of the alphabet is clearly very bad. Much more on that below. But first, how can it be that so many kids kept on learning at the same pace as before?
Figure 1. Levels of reading in English, by grade in 2021 versus 2018, reproduced from Uwezo
Source: Reproduced from Uwezo National Learning Assessment Report, 2021, page 8.
What explains the (apparent) increase in literacy while schools were closed?
Possibility #1. Kids kept up through home study
One possibility is that while Ugandan kids were not in school, they spent their time actively engaged in remote learning, private tutoring, and other extracurricular learning activities.
The Uwezo survey provides some corroboration for this hypothesis. Fewer than a third of kids in preschool through grade three engaged in any home-based learning. But from grade six through secondary school, a majority did at least some studying at home. Radio lessons and printed materials from the government or other sources were the most common means of home study. A few kids participated in TV lessons. Online learning was essentially unheard of.
It would probably be naive to assume kids spent too much of their time on the radio lessons. The Uwezo data also suggests they, ahem, “improved their skills” at cooking and farming.
Possibility #2. The good news is an artifact of kids repeating grades
To be honest, my own initial suspicion when reading about increased reading competency in various primary grades was that something was simply wrong with the analysis (spoiler: I was wrong). Specifically, I worried that doing the analysis by grade might obscure the true level of learning loss if kids had failed to advance to new grades. So I blindly emailed the kind folks at Uwezo and asked for the data.
[I should note as an aside, I’m not sure I’ve ever encountered an organization which was so responsive to a completely cold request for data. Goretti Nakabugo from Uwezo noted the full dataset will be online shortly, but emailed me a zipped folder in the meantime. Kudos for transparency!]
As the report notes, Ugandan kids in 2021 appear to have been about 0.6 years older at each grade level than they were in 2018. And even then, “current grade” may have been a pretty slippery concept in August 2021, approaching a year and a half since schools closed the first time.
To avoid that mess, I decided to compare learning levels by *age* rather than grade. The ability to do that in a fully comparable way is, again, one of the great features of the Uwezo sample and test. Perhaps it looks like kids in, say, grade two of primary haven’t seen any drop in word recognition or addition and subtraction, but that’s because many kids who should be in second grade are now in first. Fortunately, Uwezo measures all kids on the same simple learning scale, so it’s easy to make comparisons of learning progress across ages and grades.
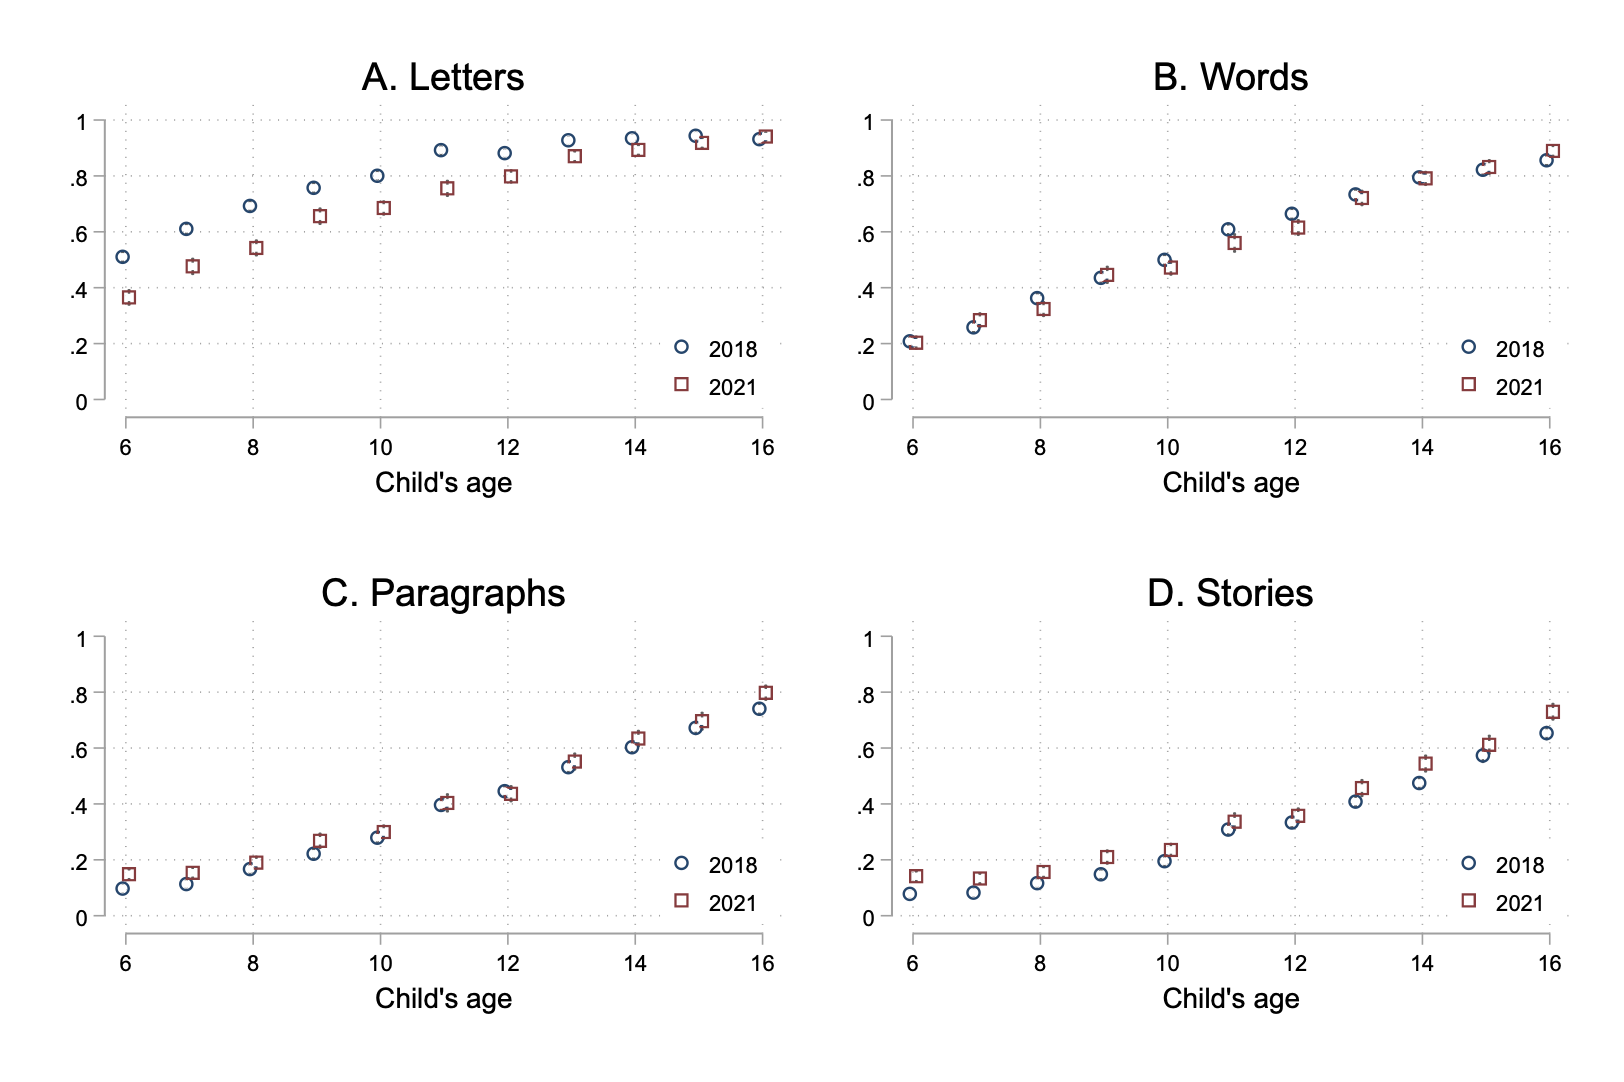
Looking at average competencies at each age rather than grade however, and again comparing 2018 and 2021, the same two basic patterns repeat:
-
For most reading skills (and most math skills too), there is really just no change in performance by age from 2018 to 2021. The lack of change is rather striking, with zero sign of learning loss at any age in word recognition, paragraph reading, or story reading. That said, there is no sign of a meaningful increase (or decrease) in any of these indicators once we look at kids by age, not grade.
-
Once again the real story of learning loss in the Ugandan data is at the very bottom of the learning distribution. The proportion of kids who can’t even recognize letters jumped up by about 10 percentage points, with the biggest losses for the youngest kids. In 2018, 80 percent of 10-year olds could recognize letters, in 2021 that number had fallen to 69 percent.
Figure 2. English learning loss in Uganda
Proportion of children reaching each English competency level, pre- and post-pandemic
Source: Author’s calculations based on household survey data from Uwezo Uganda.
Note: Each circle or square is a survey-weighted estimate of the proportion of children at that age (and for each survey round) reaching the stated competency or higher. Gray whiskers (barely visible here) show 95% confidence intervals.
Part of me was still suspicious this could be a fluke. Perhaps enumerators graded the English test more gently this time and so obscured the real learning loss, or conversely, they were stricter on letter recognition so exaggerated that part. We’re just comparing two survey rounds here, so it’s hard to distinguish the effect of the pandemic from any change in field protocols across survey rounds.
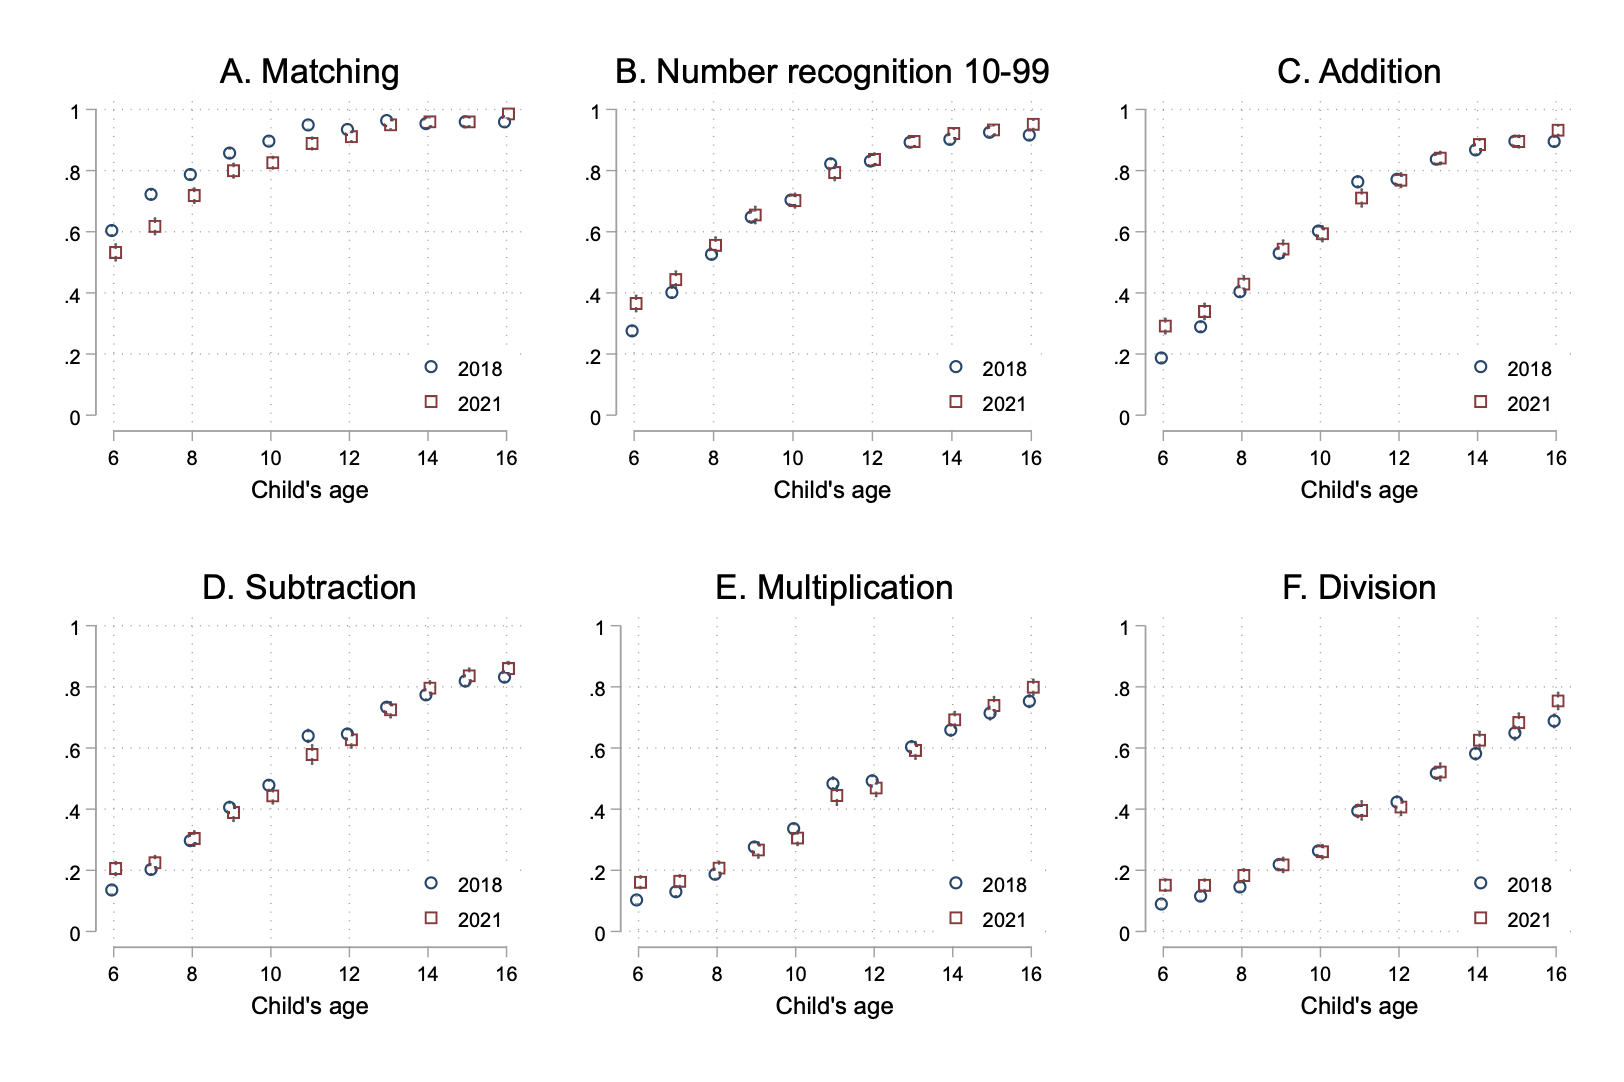
But a very similar pattern is visible in the mathematics scores. The share of kids who couldn’t clear the lowest numeracy hurdle went up, but performance on all the other higher-level tasks was completely unchanged. So the good news across much of the learning distribution appears to be real. And puzzling.
Figure 3. Mathematics learning loss in Uganda
Proportion of children reaching each mathematics competency level, pre- and post-pandemic
Proportion of children reaching each mathematics competency level, pre- and post-pandemic
Source: Author’s calculations based on household survey data from Uwezo Uganda.
Note: Each circle or square is a survey-weighted estimate of the proportion of children at that age (and for each survey round) reaching the stated competency or higher. Gray whiskers (barely visible here) show 95% confidence intervals.
One final concern is that this non-result on learning loss for most skills is driven by a change in the sample: for whatever reason, the 2021 sample drew richer, better prepared kids than in 2018, and that’s masking the true learning loss in Uganda. There’s some basis for this in the data. Constructing a wealth index (based on household assets, housing amenities, and adult education and occupation) we see a 0.27 standard deviation increase between survey rounds.
But it’s not obvious this increase in wealth is spurious or driving the results. Over three years, an increase of 0.1 TVs owned per household, 0.05 extra motorcycles, and 0.33 mobile phones seems entirely plausible. Years of schooling among household heads are unchanged, as they should be, and salaried employment is down 9 percentage points, perhaps due to the pandemic. Furthermore, controlling for these assets—as an aggregate index, or chucking them all individually into a learning outcomes regression—does little or nothing to change the result that reading fluency didn’t decline.
Back to the bad news: Not only are slower students falling further behind, that drop is bigger for poorer kids.
In many realms, COVID-19 has exacerbated inequalities. A specific fear expressed by many education experts across many countries is that when schools are closed, more affluent kids will keep up (via online courses, parental support, or even enrolling in private schools that reopened sooner), while poorer kids are left behind.
What the Uwezo data show is indeed a deterioration for the kids who were likely already behind, and really no change for the rest. But does that correspond to a difference between socio-economic classes, or for that matter, genders?
The answer in the first case is yes. Table 1 shows results from pooling the data from 2018 and 2021 and regressing pupil outcomes on a dummy for 2021, a dummy for children from a household below median wealth, and their interaction (as well as controls, not shown, for a full set of age dummies).
The decline in the proportion of children who can recognize letters appears to be about 5 percentage points greater among poorer pupils (Panel A). Again though, this only operates for the lowest learning levels. There’s no sign of learning loss, even for poorer pupils, on higher-level English reading skills.
The same pattern does not hold for gender. As seen in Panel B, there is no detectable difference in learning loss by gender on any English reading outcome.
For the sake of space, I left out the math results, but once again they look very similar. Learning loss is concentrated at the lowest learning levels, it’s moderately worse for poorer kids, and no different between boys and girls.
Table 1. Did the pandemic leave poorer kids or girls behind?
Pooled cross-section, pupil-level regressions
Source: Author’s calculations based on household survey data from Uwezo Uganda.
Note: The dependent variable is an indicator for whether a pupil achieved the competency listed in the top row or higher. All regressions control for a full set of age dummies. Estimates use survey weights.
What do these results imply for policy?
Policymakers could legitimately read these results as evidence that learning losses are not as bad as feared. Perhaps, they might conclude, test scores aren’t the biggest problem right now, and policy should focus on vulnerable kids who’ve entered the labor market or gotten pregnant, and might not return. I’m not sure this would be a bad policy lesson to draw.
But there’s also plenty of evidence here to validate more traditional concerns about learning loss. The kids who were furthest behind appear to be further behind. And poorer kids are taking the biggest hit.
Will that damage fade out over time, or leave lasting scars? For now, we don’t see impacts on higher-level skills, like reading stories or doing multiplication or division. But perhaps those impacts are still coming down the pipeline. Kids who failed to learn the most basic skills during COVID might struggle in future years to master more sophisticated concepts, exacerbating the picture above. Or perhaps they’re going to bounce back over the next year or so, in a process of reversion to the mean. Only time will tell.
Disclaimer
CGD blog posts reflect the views of the authors, drawing on prior research and experience in their areas of expertise. CGD is a nonpartisan, independent organization and does not take institutional positions.