Recommended

POLICY PAPERS
In two new papers published today, we document some uncomfortable facts about how official development assistance (ODA) is distributed across countries at different income levels and levels of poverty—even among members of the OECD’s Development Assistance Committee (DAC), and how poorly informed senior and mid-ranking donor officials are about this.
The DAC’s mandate is to promote development cooperation and to contribute to the implementation of the 2030 Agenda for Sustainable Development, including sustained, inclusive, and sustainable economic growth, poverty eradication, and improvement of living standards. In its pursuit of this admirable mission, it has become the widely accepted arbiter of the definition of ODA, and has taken on the important task of promoting better and more cooperative models for its provision. Donors—among both DAC members and beyond—have, nominally, bought into this agenda, signing up to a series of statements and ambitions governing how they provide ODA.
Despite this, in the paper Some Unpleasant ODA Arithmetic, we use data from the OECD’s Creditor Reporting System to document that over the last 15 or so years, the patterns of bilateral ODA provision have not materially changed; and there remains substantial scope to target ODA more closely to poorer places with more significant development challenges; and to structure what ODA is provided more sensibly. This does not mean that ODA doesn’t “work”—indeed substantial evidence points in the other direction—but that members of the DAC have not focused their ODA where it matters the most. In a companion paper, Progressive, Optimistic and Misinformed: What Donor Officials Believe about ODA Allocations, we use novel survey data to further document that donor officials systematically overestimate how closely-targeted their ODA is on the poorest countries, and express preferences for distributing ODA that are substantially more progressive than the actual decisions their agencies take. We conclude with recommendations to incentivise change.
ODA is not concentrated in the poorest places
Despite the strong case for spending a large proportion of available ODA resources in the poorest places, the prevalent practice among DAC donors seems to be to move away from this ideal, not towards it. Figure 1 shows that an increasing proportion of ODA goes to lower- and upper-middle-income countries (LMICs and UMICs, respectively). In only three years since 2006 have total bilateral disbursements made to low-income countries been greater than those made to lower-middle or upper-middle-income countries.
Figure 1. Distribution across income categories and time
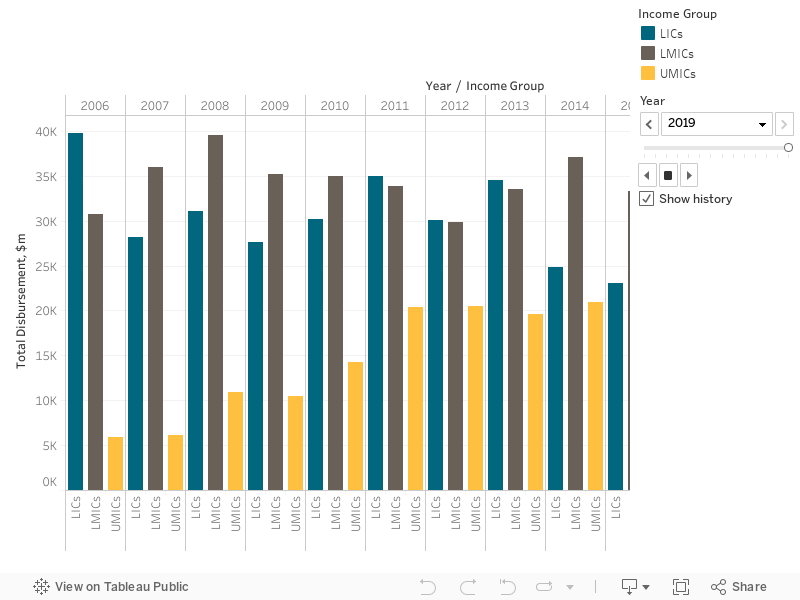
Since our analysis uses contemporary income classifications, it’s possible that this simply reflects the changing number of LICs, LMICs, and UMICs over time. After all, the number of LICs has fallen from 53 in 2006 to just 29 in 2019, while the number of UMICs has increased from 41 to 56 in the same period. Perhaps the shifting distribution of ODA is simply following where the bulk of the poor are?
Table 1. Number of LICs, LMICs, and UMICs in each year covered
| Year | LICs | LMICs | UMICs |
|---|---|---|---|
| 2006 | 53 | 55 | 41 |
| 2007 | 49 | 54 | 41 |
| 2008 | 43 | 55 | 46 |
| 2009 | 40 | 56 | 48 |
| 2010 | 35 | 56 | 54 |
| 2011 | 36 | 54 | 54 |
| 2012 | 36 | 48 | 55 |
| 2013 | 34 | 50 | 55 |
| 2014 | 31 | 51 | 53 |
| 2015 | 31 | 52 | 56 |
| 2016 | 31 | 53 | 56 |
| 2017 | 34 | 47 | 56 |
| 2018 | 31 | 47 | 60 |
| 2019 | 29 | 50 | 56 |
Note: The increase in the number of LICs in 2011 reflects the creation of South Sudan.
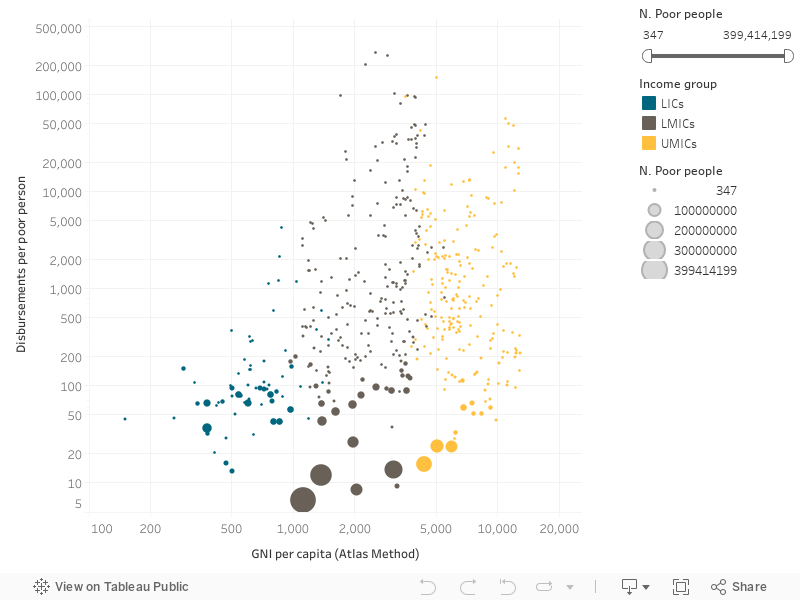
This is not the case, however: if we look at ODA disbursed per person living in extreme poverty (using the World Bank’s $1.90 a day poverty line), we observe a regressive trend: richer places receive more ODA per poor person than poor places. Figure 2, ODA per poor person for each country-year pair we have data for, illustrates this with the size of the point proportional to the number of poor people living in the country in that year.
The regressive trend survives excluding outliers with either very large or very small populations (that is, excluding China and India on the one hand, and a few small island states on the other).
Figure 2. ODA per person and per person living in poverty by income group, 2006-19
ODA eligibility criteria are too broad and include too many wealthy countries
Though this distribution of ODA seems suboptimal, it is not in any sense a violation of the rules the DAC itself has set. Figure 3, below, plots the GNI per capita of every country eligible to receive ODA for each year from 2000 to 2020. The box represents the range from the 25th to the 75th percentile of eligible recipients (known as the interquartile range); the median eligible recipient is found at the mid-point of each box, where the shading changes; and the vertical black lines represent countries within 1.5 times the interquartile range. With the filter, we can include or exclude three extreme outliers (Saudi Arabia, Bahrain, and Oman) which received little ODA during this period.
Figure 3. GNI per capita of ODA-eligible countries since 2000
The ODA eligibility criteria are extraordinarily generous: countries with a GNI of almost $30,000 per person (in purchasing power parity terms, i.e., measuring purchasing power and accounting for price differentials across space) have been eligible at some point or another since 2000. Excluding the most egregious outliers in this period makes the picture less startling but reveals an equally worrying fact: the range of incomes of ODA-eligible countries has been growing, even as the number decline. While there has been little change among the poorest ODA-eligible countries (the “floor” has not risen appreciably since 2000), there has been rapid growth at the other end (again, omitting outliers). The rules the DAC sets incentivises the counting of transfers to well-off countries as ODA.
Donor officials systematically overestimate how progressive their countries ODA is
Despite the data being fairly clear that a substantial portion of bilateral ODA goes towards middle-income countries, including many with little or no poverty, donor officials systematically overestimate how much ODA their countries provide to low-income countries. We ran a survey asking 70 senior and middle managers from 46 distinct agencies what share of ODA they believed their country sent to LICs and MICs respectively, what they thought the optimal share should be, and what they thought their agency would move to in the future. We also asked them to divide a hypothetical $100 million pot of additional ODA across low-, middle-, and high-income countries.
Figure 4. Difference between survey respondents’ answers and actual country allocations
Note: a score of zero would indicate a perfect match between survey response and current country practice
The results are striking: officials are substantially more progressive than their agencies’ revealed actions, but also misinformed about the actual distribution of ODA provided by their country. They overestimate the share of ODA spent by their country in LICs by around 11 percentage points, and their chosen allocation from an additional pot of money are on average around 30 percentage points more focused on LICs than their country’s current portfolio.
How to improve matters
Based on the findings of these papers, we suggest that the DAC might try to shift this stubborn pattern in two ways: through information provision and by directly changing the incentives for providing finance to poorer places. Through the information channel key proposals include:
- The DAC should report as standard how the current stock of commitments for each DAC member are distributed by both GNI per capita of recipients relative to other DAC donors, and relative to the distribution of eligible countries.
- This should be supplemented by annual analysis of whether the new commitments reported by each donor serve to make their portfolio more or less pro-poor.
Through the incentive channel, we suggest:
- DAC peer reviews could be supplemented or replaced by independent evaluations, empowered to make judgements over how well ODA is allocated and structured, and to investigate the impact (or expected impact) of the portfolio of each donor. The expected impact will depend not only on what they do, but where they do it.
- The DAC could tighten rules on ODA eligibility, or even outsource decisions to an independent committee.
- The DAC could signal a shift towards an impact-focused agenda. Switching from tackling the management and institutional arrangements around ODA to tackling the content of ODA programmes may have more impact on final outcomes than the current process focus.
It seems likely that a world without the DAC would have substantially worse outcomes than we currently observe. That said, if geopolitics constrains the DAC from making progress beyond where we are, it is time to change tack.
Disclaimer
CGD blog posts reflect the views of the authors, drawing on prior research and experience in their areas of expertise. CGD is a nonpartisan, independent organization and does not take institutional positions.
Image credit for social media/web: Adobe Stock