Recommended
The case against the cuts to the UK’s aid budget is well-rehearsed. We know they damage the UK’s contribution to its own priorities, that the stated aim to revivify the budget when “fiscal conditions allow” is barely coherent, and that it leaves a laundry list of good causes going wanting.
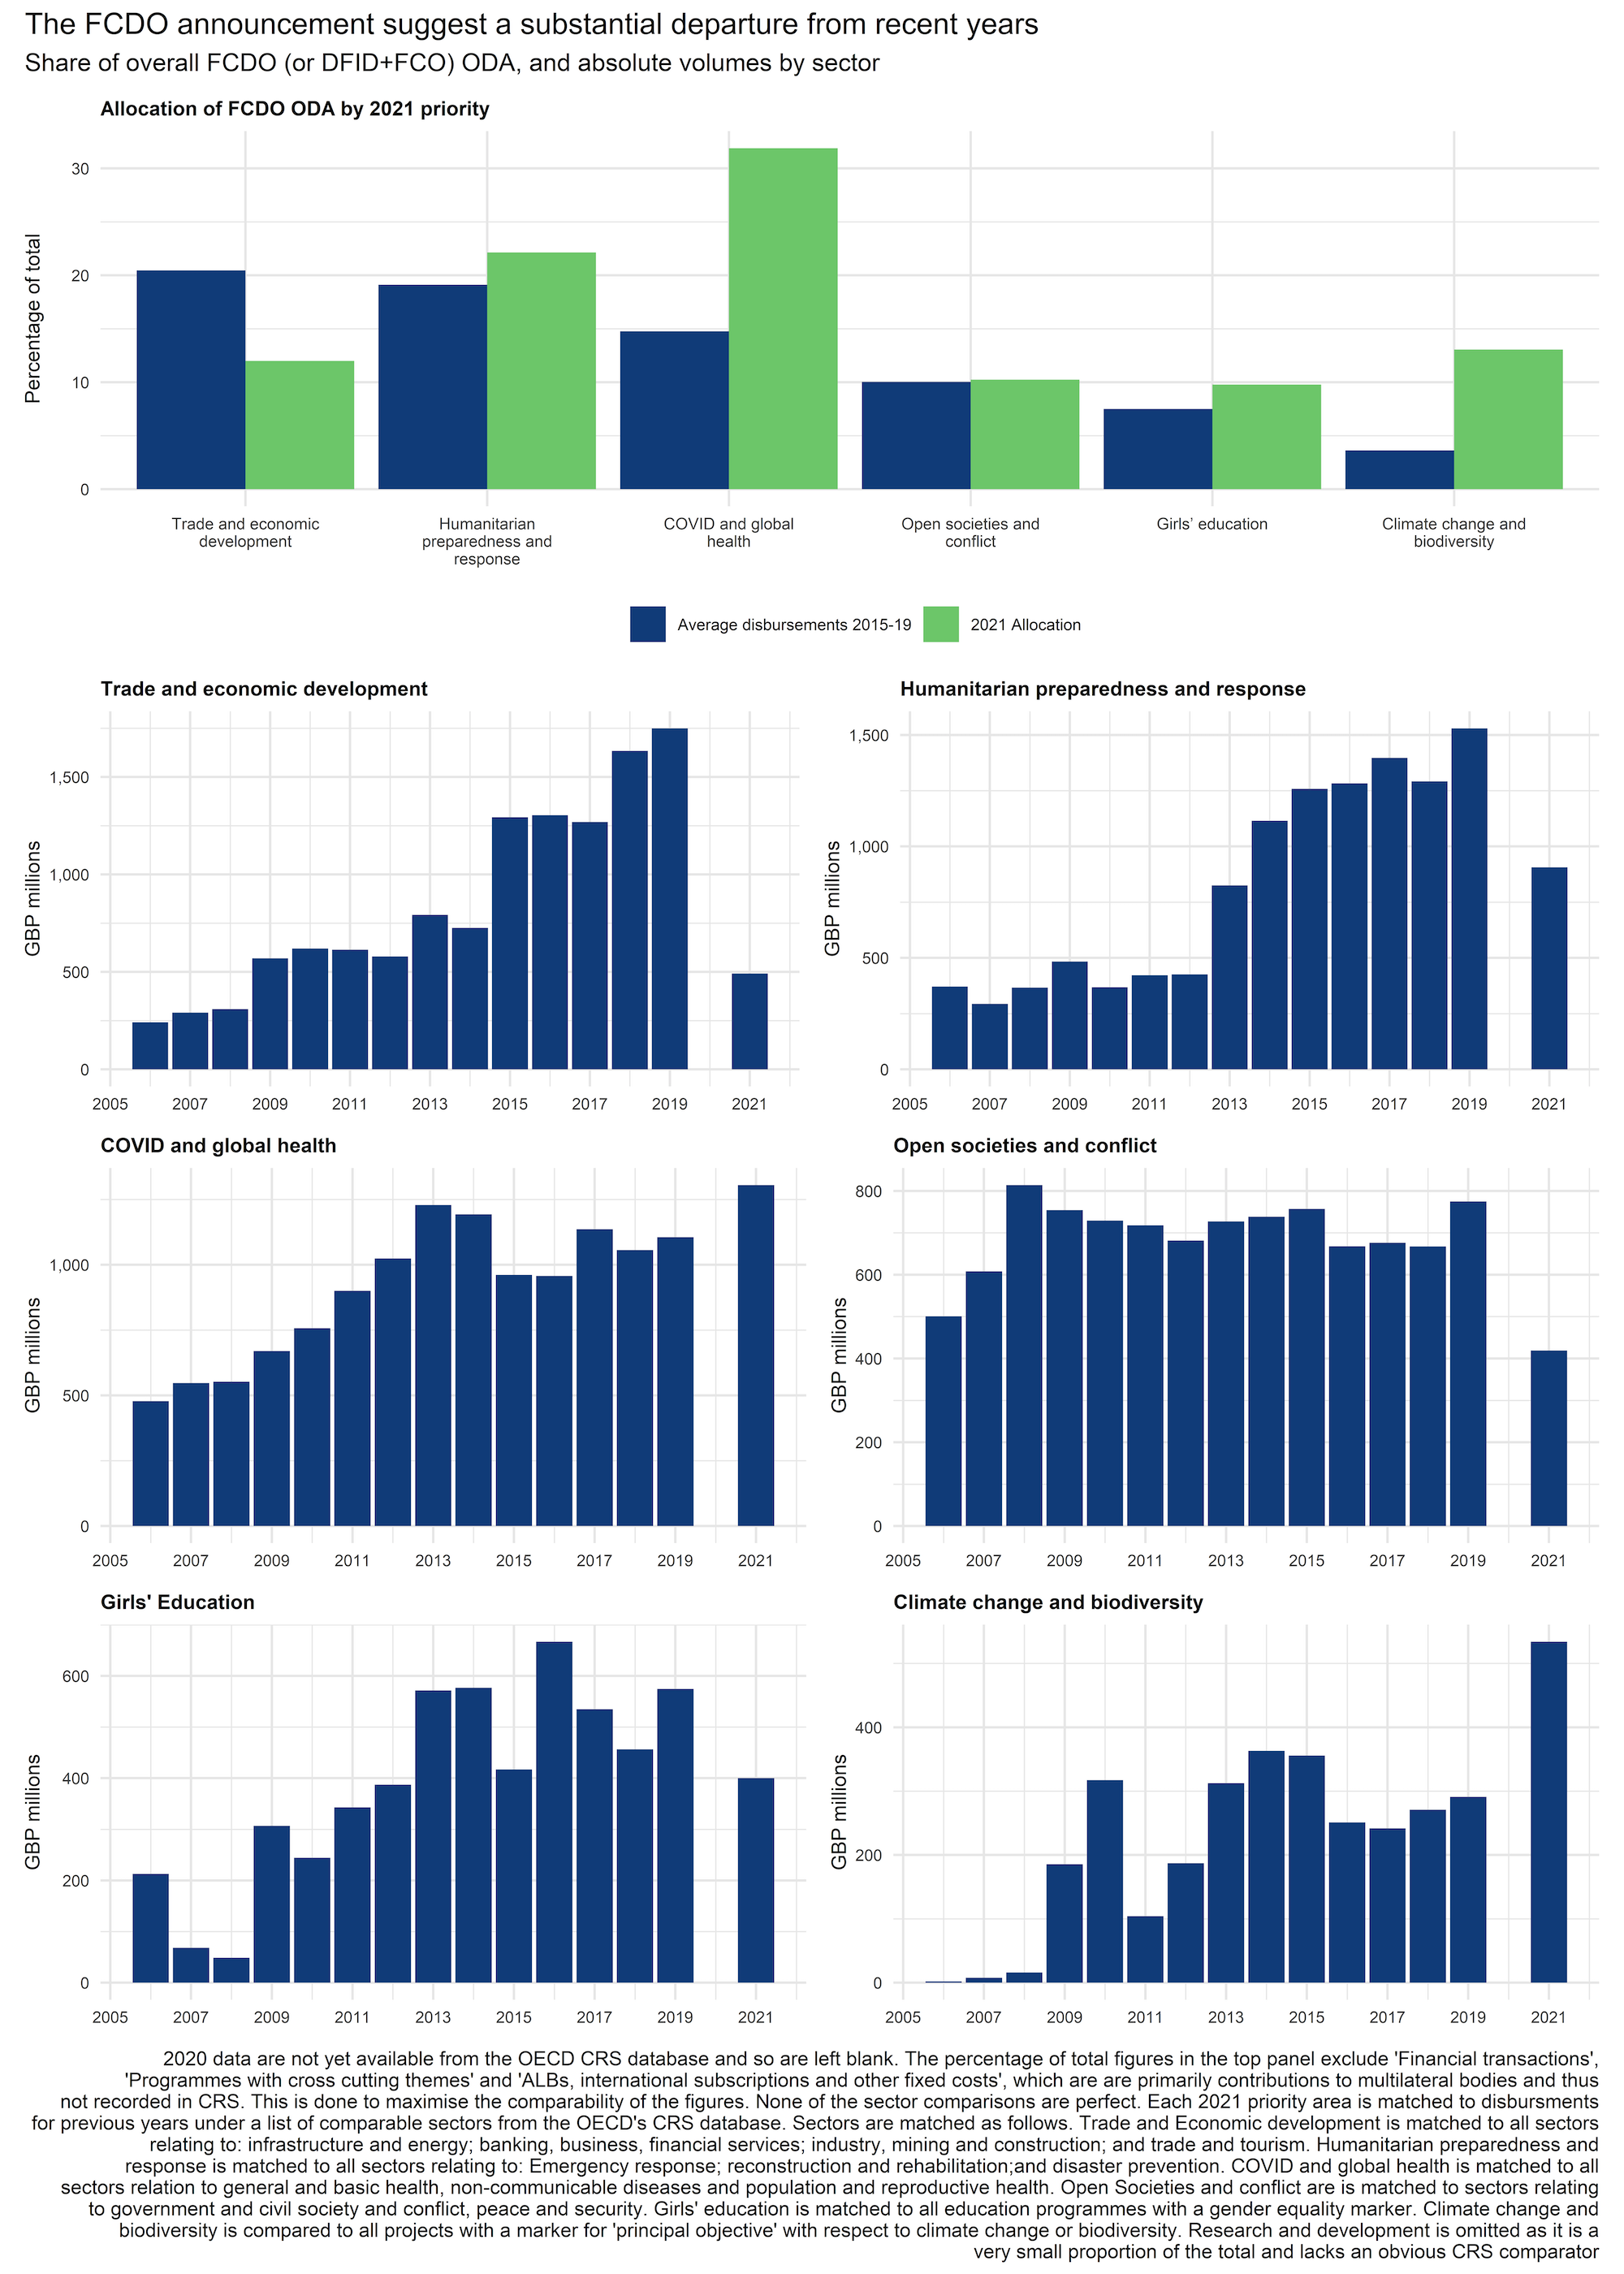
But taking the cuts as given, two questions remain: Does what remains make some strategic sense? And have the cuts been made in a rational manner? Ranil addressed the first question previously. We look at the second here. Broadly speaking, in implementing Rishi Sunak’s cuts, the Foreign, Commonwealth & Development Office (FCDO) had two choices: it could protect the best projects and cut the weakest, or it could, like Thanos snapping his fingers, just pick at random. The media coverage suggests the latter: we argue that the data shows an intention for the former, but one thwarted by the sheer brutality of the cuts demanded.
The FCDO routinely collect data that should help direct cuts
When DFID was folded into the FCDO, many observers emphasized the need to protect DFID’s commitment to results and evidence-based approach to its work in the new organisation. Part of this commitment took the form of scored annual reviews of every programme in the DFID portfolio. These reviews provide information on the extent to which programmes are meeting their objectives and detail the risks they face in the remainder of their implementation period. This information is summarised in a programme score ranging from C to A++, which reflects the level of performance relative to expectations, and a risk rating, ranging from minor to severe, reflecting the overall risk to achievement of programme objectives. These assessments carry real weight: for example, if a project scores sufficiently poorly on performance, a Project Improvement Plan must be produced (as set out in the FCDO operating rules governing project management).
If the cuts are proceeding in an evidence-based and rational fashion, we would expect that they would be targeted at the worst-performing programmes first, and that beyond them, additional cuts would be targeted at non-priority sectors. We scraped all of the latest annual review scores available on the DevTracker platform—covering to 1,458 programmes, accounting for around 75 percent of DFID spend in 2020, and 82 percent of 2021/22’s budget as of February—and then tracked the budget data uploaded to DevTracker from February to August. This allowed us to observe which programmes were first in line for cuts after the announcement by Rishi Sunak in November 2020, and track the evolution of the shape of the cuts. Setting aside discussion of whether cuts really are necessary (they are not), then using DFID’s own evaluations to decide where they fall should be a relatively uncontroversial approach to implementing them. And while it appears that there was an initial attempt to cut the riskiest or most underperforming programmes, this effort was overwhelmed by the sheer scale of cuts necessary: they quickly ran out of underperformers to cut and were forced to slash high-performing programmes too. If some MPs supported cuts in the expectation that it would reduce waste, they should be sorely disappointed—the cost of removing a relatively small cohort of poor programmes has been the end of many more good ones.
Judged by annual reviews, there was not a lot of fat to trim
The most common score in the Annual Reviews is “A,” which indicates that the programme is meeting its objectives. The risk of a programme is rated as minor, moderate, major, or severe, but because the last category has only a handful of observations, we lump it together with major. Very few projects are judged to have minor risk; “medium” appears to be the norm. Table 1 and Figure 1 show the full scoring system and the co-distribution of ratings and risk.
Table 1. Annual Review programme scores and their meaning
| Score | Meaning |
|---|---|
| A+++ | Outputs substantially exceeding expectation |
| A+ | Outputs moderately exceeding expectation |
| A | Outputs meeting expectation |
| B | Outputs moderately not meeting expectation |
| C | Outputs substantially not meeting expectation |
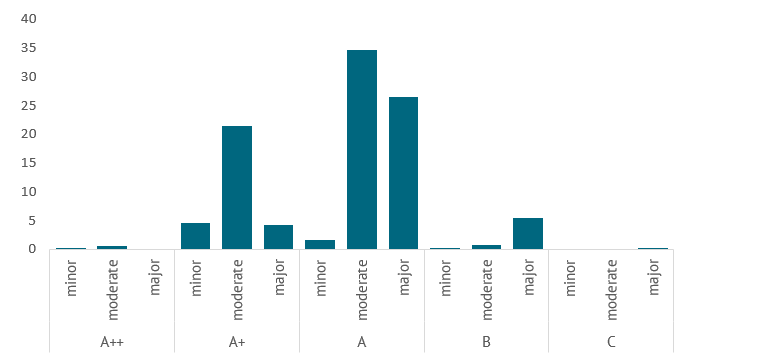
Figure 1. Allocation of FY2021 budget across Annual Review scores as of February 2021
Source: Annual Reviews of DFID projects, collated by authors from https://devtracker.fcdo.gov.uk/
Notes: This covers 82 percent of the total budget of £6.8 billion. Those without scores are not included and are worth £1.2 billion.
As figure 1 shows, taken at face value, the ratings suggest that there was simply not a lot of dead wood to cut: only 6 percent of the 2021/22 budget as of February was for programmes that were not meeting expectations (moderately or substantially). Only a single project with an initial budget of £3.5 million was “substantially not meeting expectations,” and even this was partly blamed on COVID-19. As you would expect of a well-run department, failure was not common, an impression largely upheld by independent evaluation.
FCDO may have protected the best projects – but many good ones were cut
It is hard to obtain a clear picture of the cuts, as many projects have simply been delayed, several were brought forward to complete activities in 2020 before the cuts took hold, and others were spread out over multiple years. So here we focus solely on projects that have had their budgets reduced between the February and August vintages of the data, and exclude projects that have merely been delayed (i.e., for which cuts were matched with identical increases in 2022—these will no doubt now face a further round of cuts thanks to the Treasury’s new rules that suggest that cuts will last several years).
Despite the lack of variation in scores, the evidence suggests the FCDO did try and focus the initial round of cuts on the weakest projects. In both April and May data, there was a clear correlation between annual review score and size of cut: in May, the budget for all projects rated below A was 6 percent lower than in February; the comparable figure for projects scoring an A was 4 percent, and the figure for projects scoring above A, only 2 percent.
This, however, was just fiddling at the margins of the cuts expected: they were worth £210 million (again, excluding projects that were delayed), compared to total cuts worth £1.5 billion in June and £2.0 billion in August—just 11 percent of the total cut to date. Once the easy decision to cut the weakest projects was made, it became apparent that the bulk of the cuts would have to fall on projects that were at least performing to expectations: by August, programmes scoring “A” were the hardest hit, although some evidence of protecting the best performers is still observed. Projects with recent scores above A fared better than those below. The core issue the FCDO faced was that it simply doesn’t have very many poor performing projects on which to target the damage.
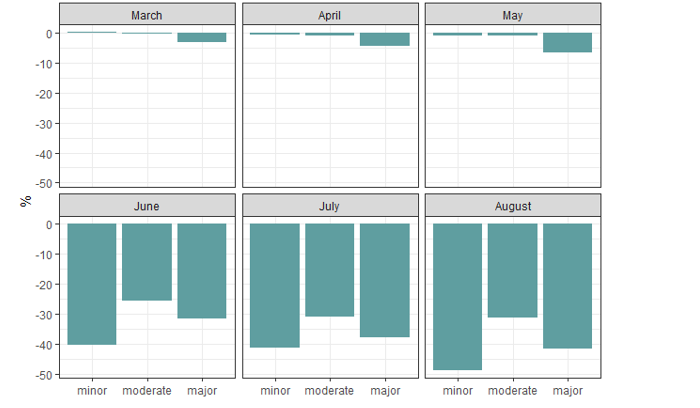
Figure 2. Cuts by Annual Review programme score, % change relative to February
Source: Annual Reviews of DFID projects, collated by authors from https://devtracker.fcdo.gov.uk/
Tracking the cuts by risk score tells a similar story. In the initial, smaller rounds, there was a clear preference for cutting riskier projects, with major-risk projects receiving the biggest cuts. In May, programmes with major risk ratings took a 7 percent cut, whereas for the other two categories the cut was only around 1 percent. But by August, when the bloodbath was really hitting its stride, the relative gap between major and moderately risky projects narrowed, and both took deep cuts: 41 percent and 31 percent respectively. Minor-risk projects were cut the most, but this should be interpreted with care, since the budget in February for this group was only £61 million, and the removal of a handful of projects changes this.
Figure 3. Cuts by Annual Review risk rating, % change relative to February
Source: Annual Reviews of DFID projects, collated by authors from https://devtracker.fcdo.gov.uk/
These figures only show one side of the story. As well as cuts, FCDO have been announcing new programmes and increases in the budgets for old ones. It may be that well-performing, low-risk projects are receiving the biggest increases. But the primary task that the Treasury has set for FCDO is dramatically decreasing the budget, and the evidence suggests that the FCDO were at least trying to make cuts rationally. High risk or underperforming projects were disproportionately targeted in the initial rounds of cuts, but eventually the sheer size of the reductions the Treasury asked for meant that the bulk of the cuts focused on well performing and less-risky projects.
This experience should change how the FCDO evaluates itself
To date, the FCDO has used its evaluations to assess the quality of its work relative to the expectations of each individual project. That is, an A means that a project is doing well relative to what it was set up to do, not relative to what other projects are capable of. This is useful information in times of plenty: prioritisation can take place a priori, through the selection of projects, or at portfolio level. This allows the construction of portfolios to take risks, and to generate new information on the relative merits of different uses of aid. There is always some uncertainty about which projects will be “best buys,” and so funding projects through to their expiration can be useful in generating more evidence/knowledge about what works in practice. Once projects are selected, the remaining question is whether or not projects are doing what they were set up to achieve.
But these are no longer times of plenty for UK aid. FCDO does not have the luxury of seeing all projects through to the end: not only are cuts required today, but the tighter envelope going forward has raised the opportunity cost of any funded project. Given this, it makes sense to rely on the best evidence on what each project could achieve, as well as how well it is being executed. For the FCDO, the opportunity cost of a programme is no longer an abstract idea to help sharpen their analysis but a real choice about whether to save project A or project B.
That means using the annual reviews differently. The existing structure allowed them to target cuts at the very worst-run or most unfortunate projects. That was insufficient with over £2 billion in cuts to make, and only £320 million worth of such projects. A different evaluation process could instead ask “what is the total value of what has been achieved by this project so far? And what does this mean for the value it still has left to achieve?” This is a more difficult kind of evaluation, but in a world where there is less money to go around, it becomes even more important to try. It would probably lead to a focus on fewer, better intervention types, perhaps with a pot set aside for high-risk experimentation.
DFID was rightly praised for its transparency and the scrutiny it put itself under. For the FCDO to do the best it can under its newly straitened circumstances, it should lean in much harder on these old virtues, as uncomfortable as that might be.
Disclaimer
CGD blog posts reflect the views of the authors, drawing on prior research and experience in their areas of expertise. CGD is a nonpartisan, independent organization and does not take institutional positions.


