Recommended
Blog Post
In December, PASEC released its new results on the quality of schooling in 14 francophone African countries. PASEC data offer a unique perspective on what the 50 million primary school students of these countries are learning (report in French here, not yet available in English).
PASEC has collected data on the quality of education in African and Asian countries since 1995. The methodology changed in 2014 to make the tests more accurate and to provide for better comparison across countries and over time. Data are collected at the beginning and the end of primary school, in Grades 2 and 6, except for Gabon where end-of-primary data is collected in Grade 5. The latest report, based on data collected in 2019, allows analysis of changes five years apart in the 10 countries that participated in both rounds, as well as better estimates for the four remaining countries.
Here are five takeaways.
1. Students in PASEC countries still have low levels of learning
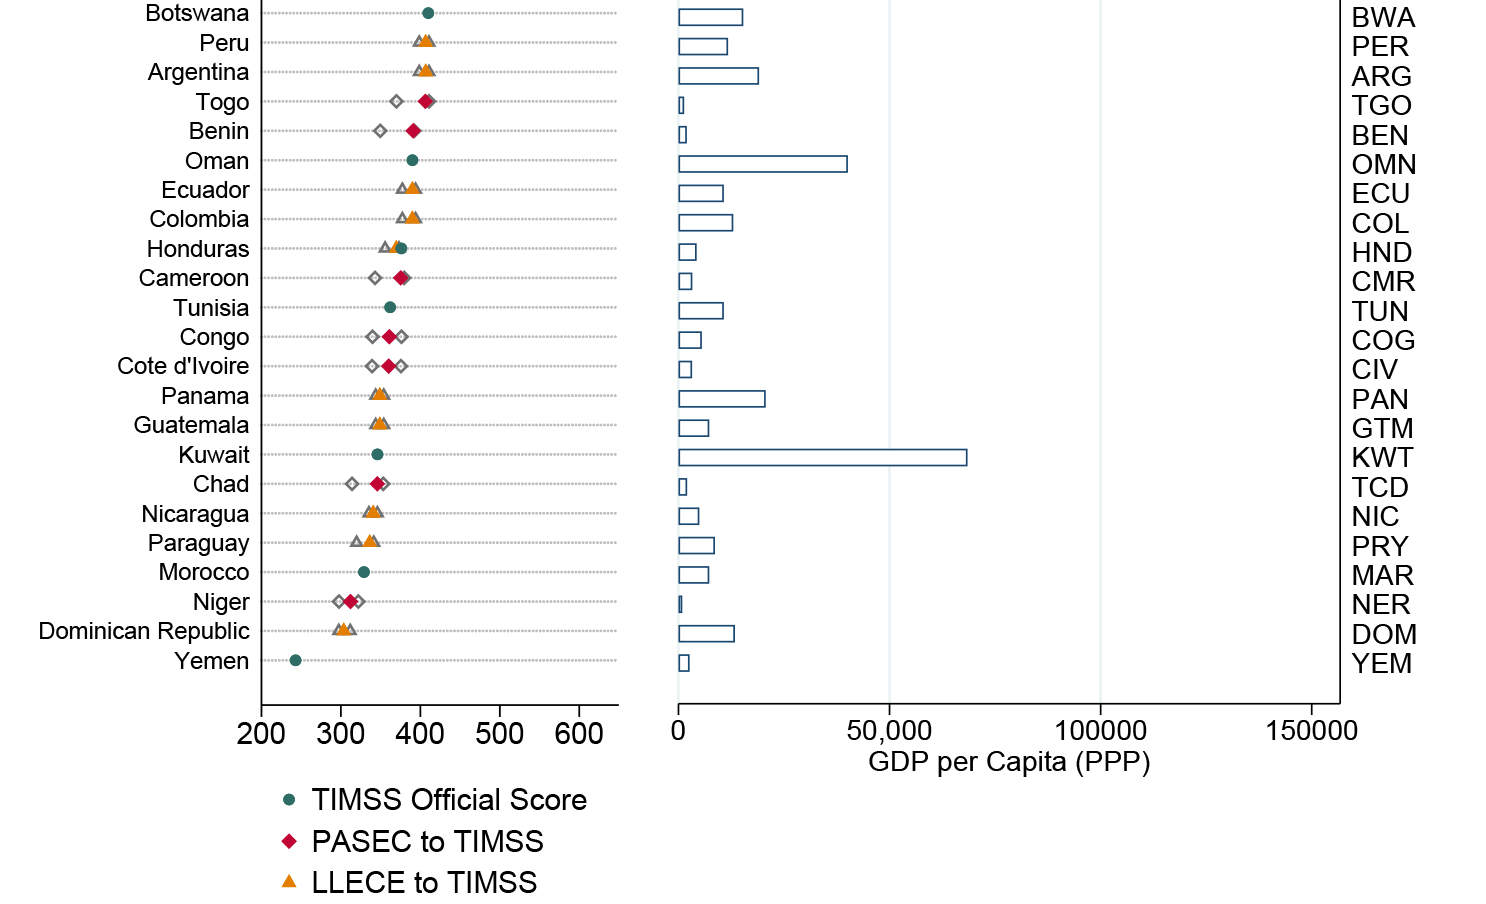
In order to situate the performance of PASEC countries vis-à-vis the rest of the world, it is useful to convert them to a global scale. The Harmonized Learning Outcome (HLO) scale (Patrinos & Angrist, 2018) allows us to convert PASEC scores into a common metric so that they can be compared to scores of other international learning assessments (like PISA, PIRLS, TIMSS, etc.). Doing so, we can see that PASEC countries have relatively low scores, but actually not below what we would expect considering their level of development (see Figure 1). With HLO scores over 410, Gabon, Senegal, Benin, and Burkina Faso are just above the median of HLO scores at the global level. The worst PASEC performers, Chad, Madagascar, Niger, DRC, and Côte d’Ivoire, have a HLO score under 360 and are among the bottom 30 countries at the global level.
Figure 1. GDP per capita and HLO score including new PASEC results

What do these scores mean? PASEC defines levels of competencies based on scores (4 in reading and 3 in maths) and considers that level 3 or above in reading and 2 and above in maths are “sufficient.” These levels roughly correspond to what PIRLS (for reading) and TIMSS (for maths) label as the “low international benchmark.” PASEC also defines a “highest level of competency,” which, at 450 on the harmonized scale, is a bit below the PIRLS/TIMSS intermediate international benchmark (475). PASEC finds that only 48 and 38 percent of students in reading and maths respectively reach this sufficient competency level at the end of primary school. This is quite low and means that a majority of students fails to reach the lowest PIRLS/TIMSS competency level. In some countries, such as Chad, DRC, Madagascar, or Niger, less than 1 student out of 3 reach this sufficient level of competency at the end of grade 6 and almost no students reach the highest competency level (see Figure 2).
Figure 2. Share of students above the PASEC “sufficient” and “highest competency” levels at the end of primary in reading and maths.

Data at the beginning of primary also show that students are struggling. For instance, at the end of second grade, 72 percent of students cannot read more than 20 letters in one minute and 24 percent cannot read six. In maths, half of students manage to find the answer to “13 - 7 = ?” and only 1 in 5 can solve “50 - 18 = ?”. These are concerning results after two full years of primary schooling and show the extent of the learning crisis in these countries.
2. Quality has improved a little bit since 2014
But the report also includes some good news. Across the 10 countries with data from 2014 and 2019, reading skills at the end of primary have improved by 15 points on the HLO scale. If this rate of progress is sustained, PASEC countries will need another 45 years to catch up with the current level of performance of European countries. The improved test scores mean an increase from 43 to 49 percent of students reach the “sufficient level of competency” in reading but there has been a slight decrease in those reaching the maths benchmark, from 41 to 39 percent. At the end of grade 2, reading and math scores have improved by 24 and 28 points on the harmonized scale respectively, showing a better preparedness at the beginning of primary school, which may translate into future progress at the end of primary.
Results by country show an uneven picture (see Figure 3). The most striking results are the significant progress in Niger and Benin, followed closely by Senegal and the Republic of Congo. For the other six countries with data from both 2014 and 2019, results are mixed: there has been little progress in Burkina Faso and Chad, no progress in Cameroon, and a decline in maths skill in Togo. Côte d’Ivoire is puzzling: results show a decline in maths at the end of primary but progress at the beginning of primary. Finally, Burundi, often viewed as a strong performer, has experienced a large decline at the end of primary but has managed to maintain its good performance at the beginning of primary. The large difference in reading skill performance in Burundi between the beginning and end of primary might be due to the fact that students are tested in their native language in grade 2 (Kirundi) but tested in French in grade 6.
Figure 3. Student performance in 2019 and changes compared to 2014

The PASEC report includes an analysis of the policies undertaken by countries between 2014 and 2019 that can help shed some light on the results. Niger reacted to its bad performance in 2014 by evaluating all its contract teachers and sacking the ones who did not have the required level of proficiency. It also started a program of remedial education in maths, reformed curriculum and teacher training, and improved the accountability of school directors. The good results from Benin could be linked to a better dialog with teacher unions that led to a decrease in strikes and a large school feeding program. PASEC suggests the insecurity in Burundi and Burkina Faso could explain their relatively disappointing results.
3. Inequalities between schools have strongly increased between 2014 and 2019
Progress in reading in Benin, Niger, Burkina Faso, and Cameroon has not been shared by all students. Students at the top of the distribution have seen scores rise, while those at the bottom have not: for instance, the students at the bottom 10 percent of the score distribution in Burkina Faso, saw their scores drop 45 points on the harmonized scale despite the country’s overall increase in reading progress. Thus, at the beginning and end of primary, while students have made some progress in reading, inequalities in performance have increased.
PASEC rules out an increase in rural/urban, gender or wealth inequalities between 2014 and 2019 as the driver for this increased educational inequality. However, a striking result is that inequalities between schools have strongly increased between 2014 and 2019 in all countries and at all levels. Good students tend to be more and more concentrated in the same schools.
Disparities between schools is measured by the intraclass cluster correlation (ICC), with a value of 0 meaning no disparities between schools and a value of 1 meaning that all the variance in score is explained by differences between schools. Figure 4 shows how the ICC has changed from 2014 to 2019 at the end of primary. Niger and Togo have experienced the largest increase and are now the two countries where schools explain the greatest share of the variance in scores, while disparities between schools in Burundi has almost caught up with other countries. Inequalities between schools in PASEC countries were already high but this trend is concerning as the success of students may rely more and more on the quality of their local school or the ability of their parents to enrol them in a better school.
Figure 4. Intraclass cluster correlation in 2014 and 2019 at the end of primary

4. New data on teacher skills!
PASEC 2019 has tested all teachers at selected primary schools for academic and pedagogical knowledge of reading and maths. The evaluation shows that teachers have relatively weak academic knowledge, with only half of them reaching the highest level of proficiency in reading and a third of them in maths. Their pedagogical skills also appear to be weak, with a third to half of teachers able to correctly diagnose simple reading comprehension mistakes of students and only a quarter to half of teachers able to diagnose or choose the right pedagogical tool in maths.
Teacher performance varies widely between countries, with a clear group of 7 countries with relatively good teacher performance. The average teacher performance in Senegal, Côte d’Ivoire, Benin, Togo, Burkina Faso and Gabon is about one standard deviation above DRC, Congo, Madagascar, Chad, and Guinea.
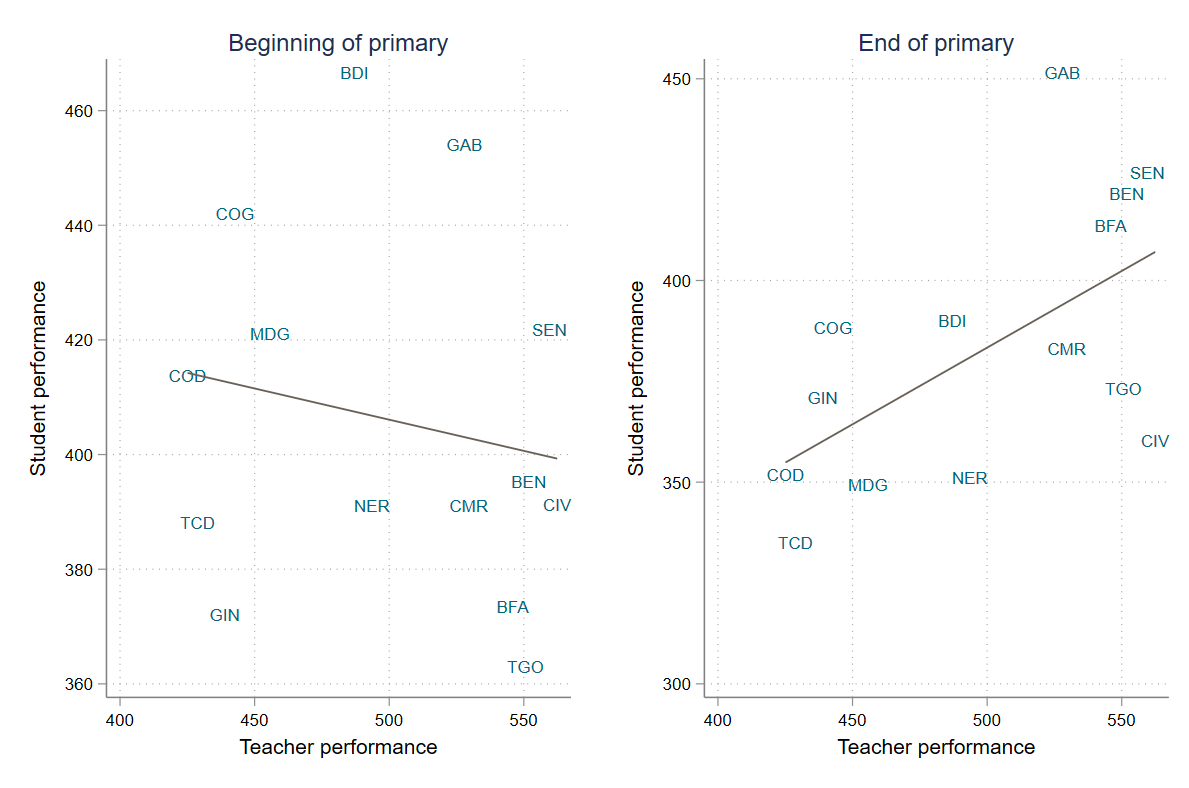
Interestingly, teacher performance correlates with student performance at the end of primary but not at the beginning (see Figure 5). The report doesn’t explore the correlation between teacher and student performance at the school level, which will be something for researchers to investigate when microdata are available. More research is probably needed to understand the relationship between teacher and student performance and it’s exciting that these new PASEC data could help in this regard.
Figure 5. Correlation between teacher and student performance at the beginning and end of primary
The report also explores the characteristics associated with better teacher performance within countries. Being a man, having more years of experience, having a university degree rather than a secondary degree, and in some countries having benefited from continuous training are all associated with better teacher performance. However, the report is limited to bivariate analysis and it would be worth checking if some of these associations still hold when controlling for multiple variables (for instance men could have an advantage because they have more experience and are more likely to have been to university).
5. New insights on student environment and performance
A strength of PASEC evaluations is the large amount of data on contexts collected alongside data on student performance. This makes it possible to know more about groups of students performing better and it also contains important information on the schooling context. Here are some of the striking results that shed light on the schooling experience in these countries:
40 percent of children complain of being often or always hungry at school and their performance is lower than children who do not experience hunger. (Maybe it’s time to consider spending more on school feeding?)
A large number of children are involved in child labour (39 percent in business, 58 percent in agriculture, and 25 percent in manual work) and involvement correlates negatively with student performance.
20 percent of teachers report that there is bullying in their school and 2.4 percent report the presence of sexual harassment. Chad and DRC are the two countries with the highest prevalence of sexual harassment with 5.4 and 4.1 percent respectively.
Girls are doing better than boys in reading at the end of primary but boys are doing better in maths at both levels, which is similar to findings from OECD countries.
Despite numerous reforms to reduce grade repetition, 54 percent of children have repeated at least one grade by the end of primary. Finding alternative ways to help children who are struggling is an area where those countries could make huge progress as repetitions are costly and may lead to dropouts while not being particularly effective (read more on the subject here).
About 25 percent of students are enrolled in a private school and those students perform 22 points better in maths and reading even after controlling for location characteristics. This is a relatively small difference in performance, in line with other findings.
Average class size has decreased in almost all countries compared to 2014 (see Figure 5), suggesting that countries have recruited more teachers. Interestingly, average class size has not changed in Niger, which is the country that experienced the biggest improvement in PASEC scores.
Figure 6. Average class size (grade 6) in 2014 and 2019

There is much more in the report, notably on inequalities or factors associated with performance, but these have not changed dramatically compared to the 2014 report. PASEC data will help inform education policies in these 14 countries for years to come and it is heartening to see that PASEC managed to expand the scope and coverage of its evaluations while keeping high quality standards. Hopefully, more countries will be able to join PASEC in the long run as data on school quality are still missing in too many places.
Thanks to Susannah Hares, Lee Crawfurd, Maryam Akmal, and Jack Rossiter for their comments on an earlier version of this blog post.
Disclaimer
CGD blog posts reflect the views of the authors, drawing on prior research and experience in their areas of expertise. CGD is a nonpartisan, independent organization and does not take institutional positions.