Recommended
POLICY PAPERS
The level and composition of taxes and expenditures vary considerably across low-income countries, which means their effects on countries’ growth, economic stability, redistribution, and welfare also differ. Understanding these effects requires a simultaneous and consolidated examination of the many dimensions of revenue mobilization and expenditure. A new CGD policy paper proposes a methodology that does just that. Our “fiscal dashboard” assesses the multiple dimensions of revenues and expenditures in a low-income country. It comprises selected economic and fiscal indicators, reproducible for different low-income countries and for several years, organized to give policymakers and others an easy read out of the main features of a country’s fiscal policy.
As explained in the paper—and illustrated in this blog post with the examples of Mozambique and Cambodia—the analysis presented by the fiscal dashboard can also be useful to foreign investors, international institutions, and civil society organizations who assess a country's policies from time to time. The dashboard can be especially useful in benchmarking a country against comparable economies. Its design is sufficiently flexible to allow a focus on issues that are more pressing and adaptable to data constraints facing low-income countries.
What does the fiscal dashboard cover?
The dashboard includes:
macroeconomic aspects of fiscal policy, such as government size and sustainability of budget imbalances;
revenue composition, efficiency of tax collection, and their burden on economic agents;
composition of expenditure by function of government and nature; and
some incidence and redistributive effects of fiscal policy.
While national statistics are the primary source of most indicators, to maximize comparability, the dashboard exploits various databases of international organizations. A number of original indicators are included by combining data from different sources. To guide the interpretation of the snapshot of fiscal policy provided by quantitative indicators, the dashboard includes an indication of whether they have been consistently rising or falling in the recent past, and of whether they should be considered as low, high or average, relative to what is observed in comparable countries.
Who might use the dashboard?
Broadly, we anticipate three categories of users:
First and foremost, national authorities should find the fiscal dashboard useful in policy design, formulation, and implementation. The assessments made possible by the dashboard approach should be of particular interest in comparing countries. Derivative indicators, such as efficiency ratios or implicit tax rates, not readily available elsewhere, will provide policymakers with additional insight.
International organizations can use the dashboard to identify issues of concern (or satisfaction) that may go beyond what they are used to examining under their own mandate. Level and trend assessments should help to spot variables that may be spiralling out of control or on their way back toward normality.
For investors, donors and civil society organisations, the dashboard constitutes a synoptic source of simple quantitative and qualitative fiscal information, allowing to direct investment or technical assistance towards areas where they are most useful or profitable.
Constructing dashboards for Mozambique and Cambodia
We constructed dashboards for Mozambique and Cambodia to illustrate the approach (the accompanying paper also contains a dashboard for Ethiopia). Mozambique belongs to the low-income country (LIC) group as defined by the World Bank and its performance is compared to that of other LICs, whereas Cambodia is compared with the lower-middle-income country (LMIC) group.
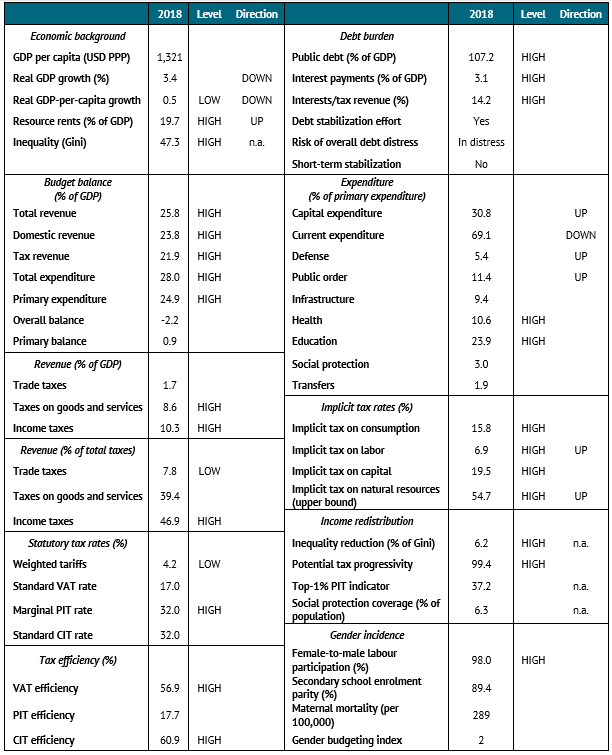
Mozambique
The 2018 dashboard for Mozambique shows a number of worrying indicators: low and diminishing GDP-per-capita growth, high income inequality, and a high public debt whose service absorbs a large share of tax revenue, leaving no scope for short-term fiscal stabilization. This is a combination that often leads to political and economic uncertainty, to which the high share of natural resources in GDP may further contribute. This points to the need for a coordinated approach between international financial institutions, so as to reduce the debt burden while promoting structural reforms and focusing aid programs on poverty reduction.
Beyond the worrying growth and inequality indicators, national authorities may also find in the dashboard some grounds for satisfaction. Domestic revenue mobilization is high, thanks to efficient taxation of consumption, income, and increasing natural resource rents, while keeping the economy open through low border taxes. In spite of the debt burden, public expenditure is strongly oriented toward health and education and increasingly geared toward investment. This suggests that the government is right to focus on debt reduction, but also that, instead of further increasing taxes, whose effective rates may already have reached levels that could deter investors, efforts should focus on curbing primary expenditures.
The dashboard may help donors to prioritize their interventions, highlighting that some objectives, such as tax administration efficiency, health and education spending, or gender inequality reduction, may be less in need of external support in Mozambique than in most low-income economies. Instead, aid would be best directed to poverty relief programs, in order to complement the effort of the authorities to reduce inequality.
These general insights from the dashboard (most of which date back to 2018) must be considered in the context of the external shocks experienced by Mozambique since then: devastating tropical cyclones in early 2019, intensifying terrorist attacks, the COVID-19 pandemic, and falling commodity prices in 2020.
Fiscal dashboard for Mozambique
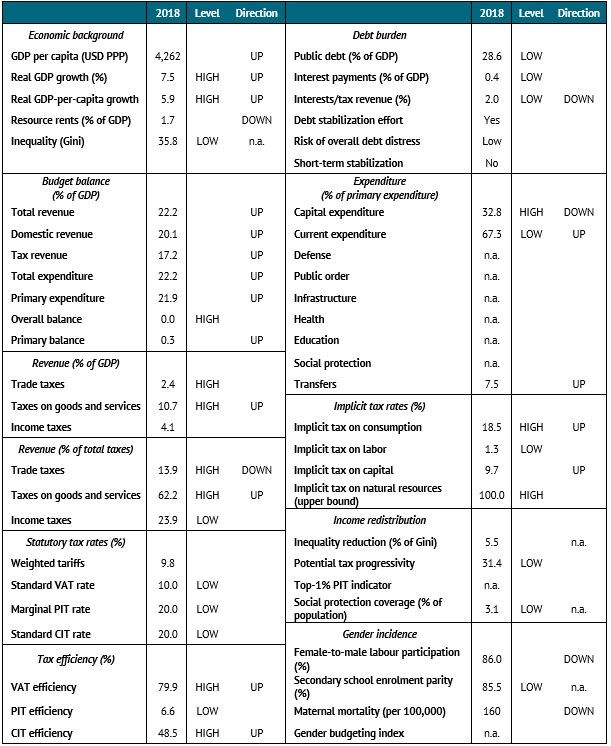
Cambodia
In Cambodia, international organizations are likely to be pleased by much of the dashboard. Growth has been high and increasing, domestic revenue mobilization is up, the budget is balanced, public debt is low, public spending is highly and increasingly oriented toward the accumulation of public capital, and income inequality is low. This suggests that Cambodia does not need extensive international assistance.
Still, several other issues deserve attention from national authorities. Direct taxes are low. This may be appropriate for corporate income taxes to foster investment, since the efficiency of the tax is high and increasing, but it is less appropriate for personal income taxes, where the low rate and low efficiency leave labor largely untaxed. More generally, by relying strongly on consumption, the tax system has little capacity to contribute to income redistribution. On the expenditure side, social protection coverage is low, leaving little means to deal with a crisis or merely with the increase in inequality observed in many economies as they grow. Whether due to the design of personal income tax, to the lack of social protection, or to other factors, the fall in female participation in the labor market should worry the authorities.
Donors can contribute to establishing effective social protection programs and to improving the design and administration of personal income taxation. Noting the lack of data on the distribution of public expenditure, they may also provide assistance to enhance budget statistics and set up a proper expenditure classification system.
Fiscal dashboard for Cambodia
Further extensions of the dashboard
The dashboard is designed so that it is not too costly to extend to a large set of countries and to maintain over time. This would provide the historical depth to identify trends at work in each country beyond the snapshot of short-term developments recorded in each vintage of indicators.
The dashboard’s design reflects the challenges and constraints faced when the indicators were collected. Over time, some indicators may turn obsolete, whereas others may become relevant and available. For example, starting in 2020, the COVID-19 crisis will interact heavily with fiscal policy in most countries, through tax receipts, tax reliefs, health and social security spending, and in other areas. An indicator of the national incidence of the pandemic, such as a background variable describing the excess mortality rate, would help to place fiscal developments in perspective in coming years.
Disclaimer
CGD blog posts reflect the views of the authors, drawing on prior research and experience in their areas of expertise. CGD is a nonpartisan, independent organization and does not take institutional positions.