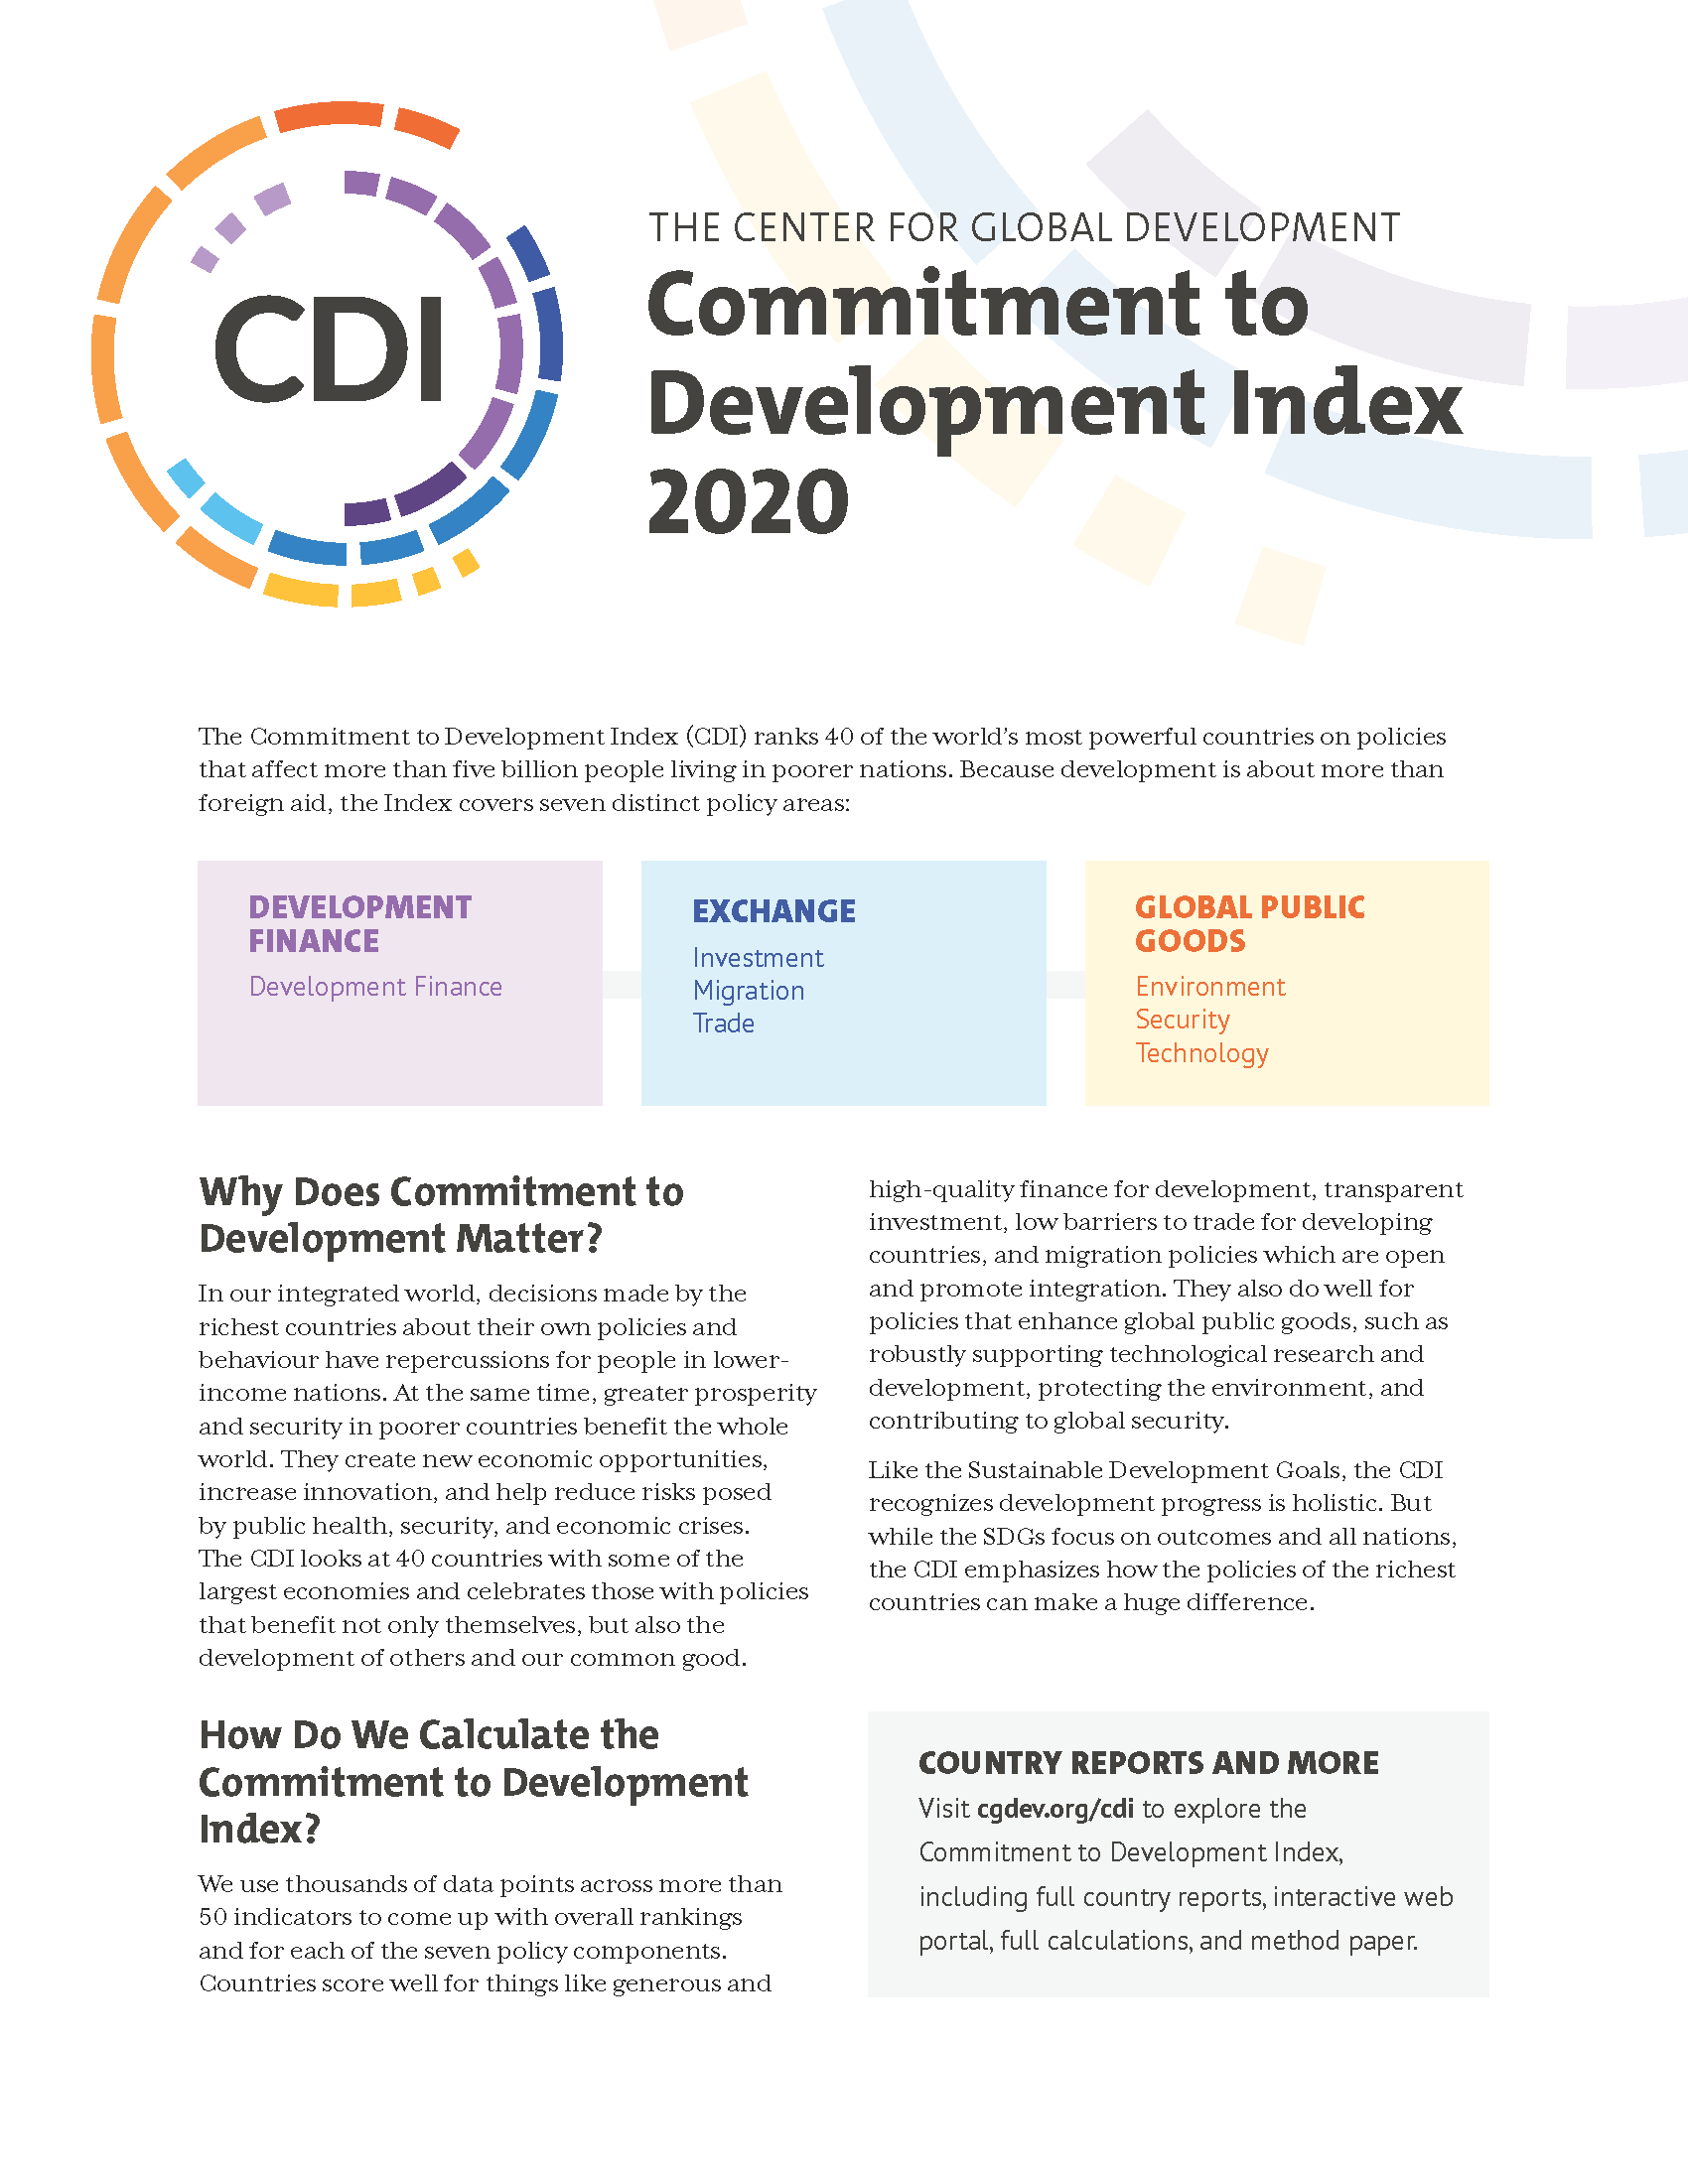
Today we publish the 17th edition of the Commitment to Development Index (CDI). The CDI measures the policy effort of countries—relative to their size to enable comparisons—in how they support development in other countries. It emphasises the importance of policies “beyond aid” in seven areas: development finance, investment, migration, trade, environment, security, and technology.
This blog explains what’s new in the CDI and highlights four findings. The full rankings and scores are available here, along with a brief summarizing the results. In two accompanying blog posts, we look at what the 2020 CDI tells us about how countries are performing in global health and what the CDI reveals about China’s development commitment.

What and whose policies matter to development?
For the first time, and following an extensive review, the CDI includes results for all G20 countries and other major economies. Adding a further 13 countries, we have extended the CDI’s coverage to a total of 40 countries. Altogether, these countries' policies have a major bearing on development progress and our progress towards reaching the Sustainable Development Goals. Because several of the countries have a much lower income than others, we have also developed “income-adjusted” results, to demonstrate that we would expect to see more support for development from the wealthier countries.
In a blog post earlier this year, we outlined several new measures in the CDI, and we’ve added indictors on gender, global health, conflict potential of arms, research collaboration, and technology in trade—as well as a more comprehensive approach on climate. We have used universal data sources wherever possible, but there are some data gaps, and we note below where these are material for country scores.
So, what did we learn from the CDI 2020?
1. Sweden and Europe are the global leaders on development
Sweden leads the way on its commitment to development. It scores well across six out of seven components we assess and ranks first on migration thanks to its high migrant inflows, the large number of refugees it hosts, and its excellent domestic migrant integration policies. Sweden also comes third on development finance and in the top 10 on trade, investment, environment, and security. Still, it has room for improvement on technology, where it ranks 21st, with a lower than average level of foreign students and low scores on research collaboration.
European countries tend to do most for development relative to their size and take nine of the top ten positions. France comes second overall, ranking second on environment and third on investment but with mid-table scores on development finance and migration. Norway takes third place with strong scores on development finance, migration, and new gender indicators (see below) but room for improvement on trade and environment. The UK and Germany complete the top five. While the UK tops the security component, it has room for improvement on migration and technology, and while Germany is strong on investment, migration, and trade, it scores less well on environment, security, and technology.
The US ranks 18th on the CDI. While it is the world’s largest economy and absolute provider of development finance, its contribution relative to its size is much more limited. It scores well on security and trade but is 34th out of 40 on the environment. This is largely because its combined direct and imported emissions per head total 23.8 tonnes carbon equivalent per capita annually, significantly above the CDI average of 15.0 tonnes.
2. G20 “middle-income” leaders
Nine of the G20 countries in the 2020 CDI have income levels under $12,375, the threshold over which countries are classified as “high income.” (The average income of the other 31 countries we assess is over $40,000.) Within this “middle-income” group, South Africa ranks highest on its commitment to development, with a top-five score on technology. This includes a joint top score on avoiding intellectual property right restrictions in its trade agreements. It also comes top on research collaboration, and in the top five on foreign students. It has room for improvement on environment, producing high emissions from fossil fuels and subsidising their use.
Turkey has the next highest score in the middle-income group. Its major contribution to supporting refugees puts it second on the migration component; and, given the high share of GNI spent on development, it ranks fourth on development finance, but earns weaker scores in trade and investment.
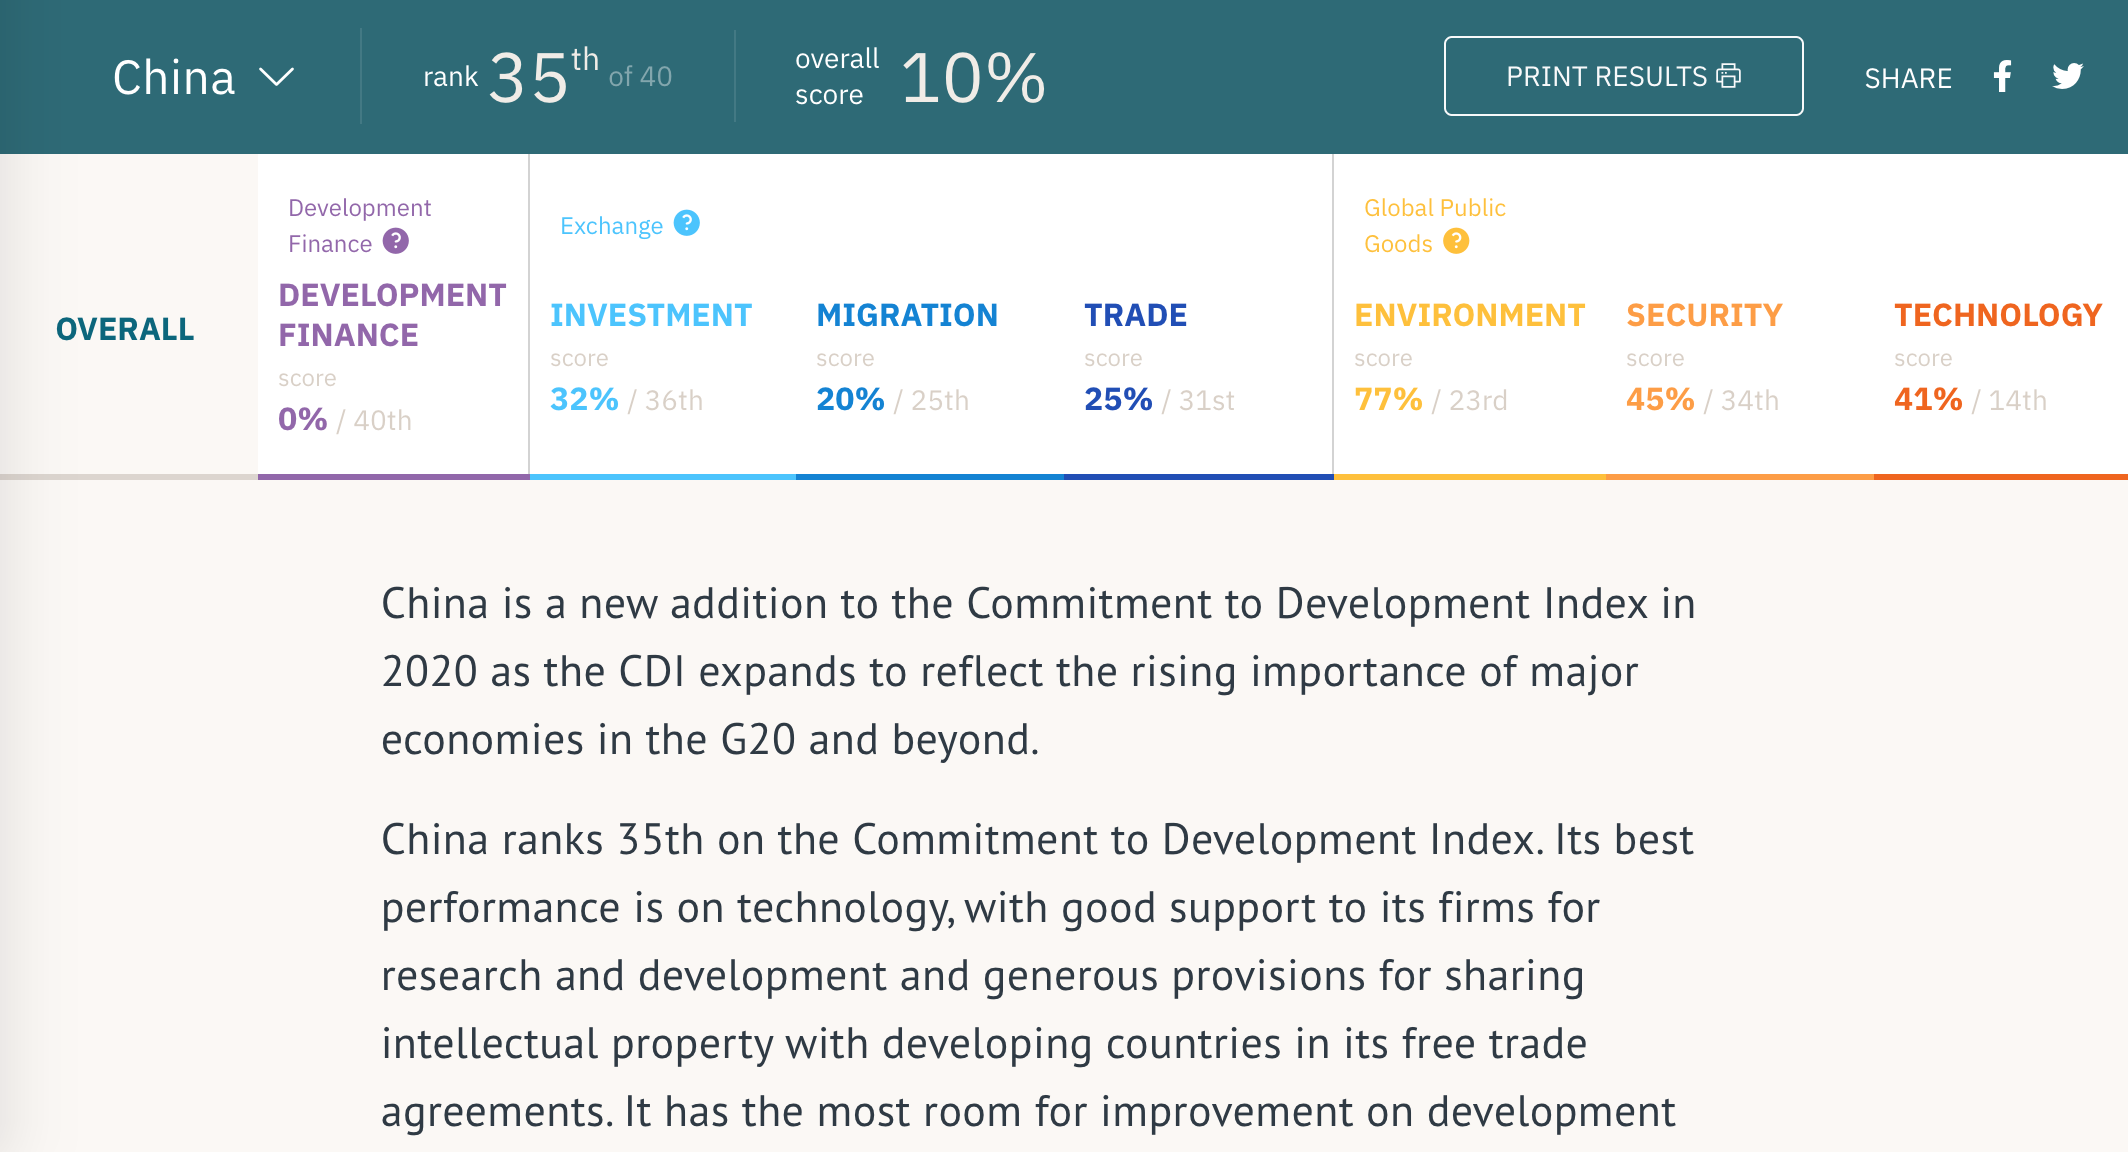
China ranks 7th in this group. We look at China’s performance in more detail [here]. While China is undoubtedly a major player in development financing, its significant absolute level of development finance lending to poorer countries is less heavily subsidised than others and is small relative to its vast economy. It performs most strongly on technology, with good support to its firms for R&D. It scores poorly on security, and on investment has not signed up to OECD and other international standards on corruption or business and human rights.
In our income-adjusted results, we look at whether a country's performance exceeds an “expected level” based on the relationship between scores and income level (see figure 1). Under this method, four countries—Portugal, South Africa, Chile, and Hungary—improve their rank by more than 10 places to 4th, 6th, 12th, and 13th, respectively, while high-income countries Norway, Luxembourg, and Switzerland fall back. Still, Sweden is the country that exceeds income-based expectations the most, and it also tops the income-adjusted rankings.
Figure 1. Commitment to Development and country income-level

Notes: The red line is a line of best fit—an “expected score.” Countries above this line are doing more than might be expected for their income level.
3. Middle Eastern countries lag behind
At the bottom of this year’s CDI are the UAE (40th), Saudi Arabia, and Israel. The three countries also score poorly on the environment, with Saudi Arabia and UAE in particular having very high greenhouse gas emissions and neither reporting their subsidies for fossil fuels.
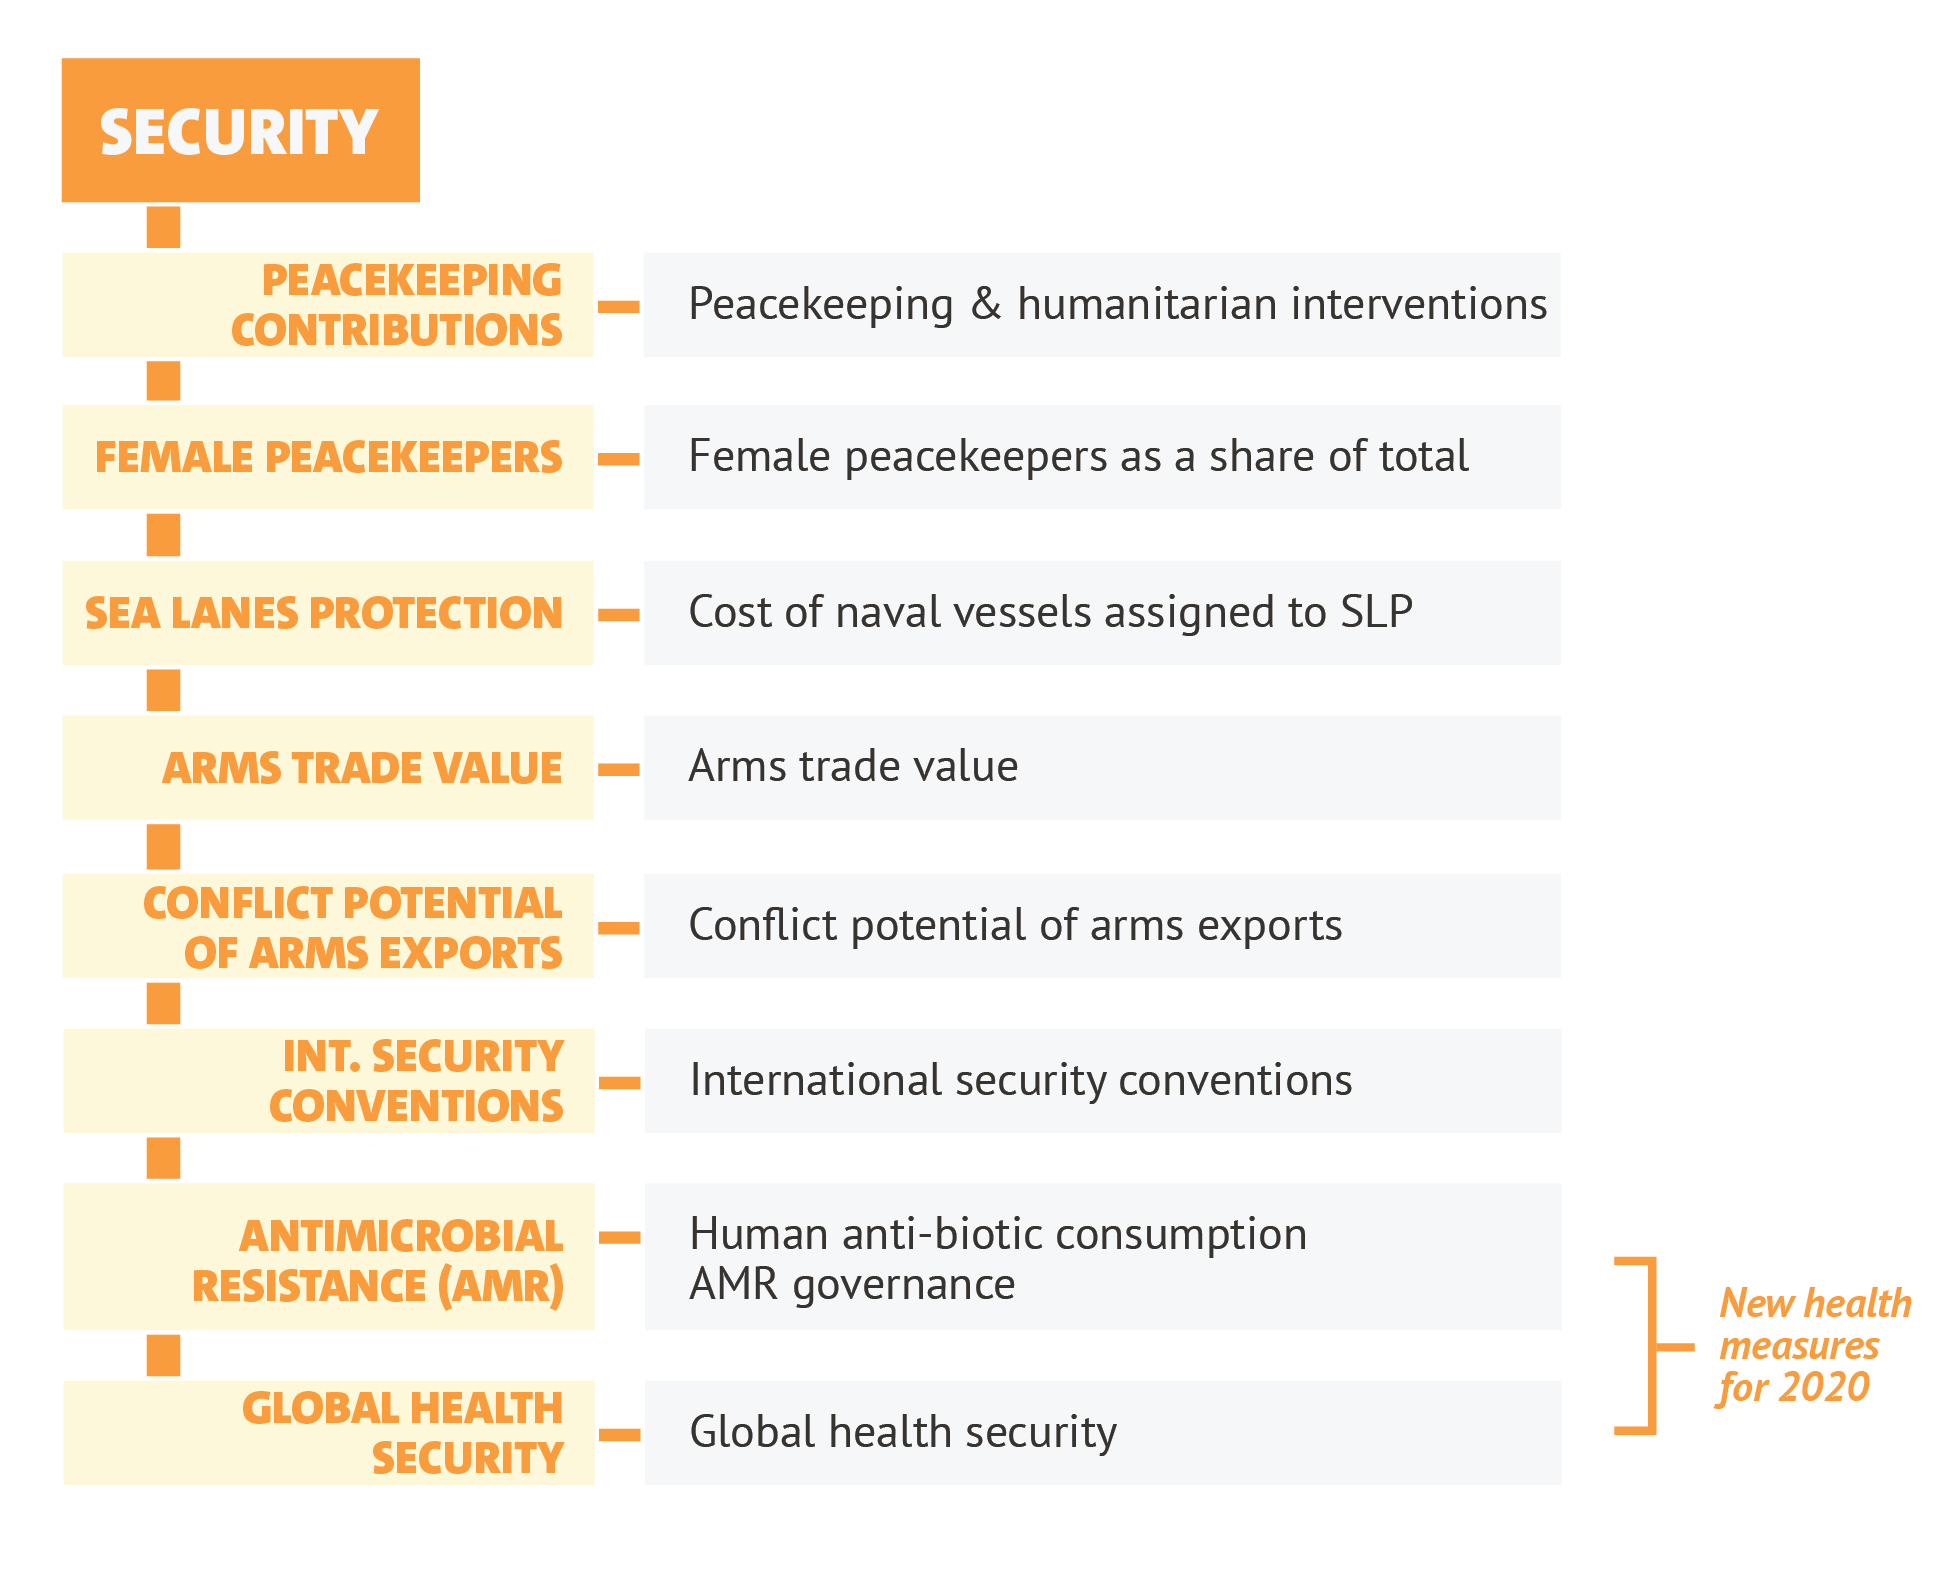
These three countries also score poorly on security—each commits to less than half of the 10 international conventions we assess (including on mine bans, cluster munitions, and arms trade treaty). They provide the least support to international peacekeeping and either provide no data on arms sales (Saudi Arabia) or have arms sales with high “conflict potential.” This new measure penalises arms exports to countries which are undemocratic, poorer, and more militaristic
For a number of indicators, Saudi Arabia and UAE do not report their data publicly (11 and 12 out of 52, respectively). In around half of these indicators, where we would expect data to be reported—on arms exports; data from UN sources; and data on agricultural, fisheries, and fossil fuel subsidies—we record the lowest score. An increase in transparency could substantially improve our assessment and, more importantly, enable scrutiny of their policy approach.
4. Australia and Norway show leadership on gender
For the first time, we incorporate measures of how countries promote gender equality in their international approach. Because our focus is beyond aid, and data is in any case lacking on development finance and gender, we look at four indicators: the share of female migrants, international students, and peacekeepers (where evidence suggests women provide a distinct and particular contribution), and whether a country has ratified UN Resolution 1325 on Women, Peace, and Security (we reward the 28 that have).
Across these four indicators, Australia does best (including the highest level of female UN peacekeepers at 18 percent), with Norway second. The United States has the highest share of female migrants, at 54 percent, while Argentina accepts the highest proportion of female international students, at 60 percent.
We remain interested in whether there are other measures—especially beyond aid—where countries can be assessed on promoting equality internationally to incorporate in future iterations of the CDI.
Development leadership in the 21st Century
The CDI provides a framework and measures for considering how policies accelerate or inhibit development. The countries at the top are doing things well but all still have room for improvement, while those at the bottom are not supporting their fellow countries in the way they could or should. Across the components, there are surely policy areas where political progress is possible (if not migration, then technology; if not security, then investment)—and in many areas policy changes are mutually beneficial (R&D, trade, migration, and financial secrecy).
We encourage users to take the CDI “seriously but not literally”—and we always welcome feedback on our approach. We hope you will use the results to encourage your politicians and policymakers to do more in their domain to support development. Explore the full results of the 2020 CDI and read the brief here.
Disclaimer
CGD blog posts reflect the views of the authors, drawing on prior research and experience in their areas of expertise. CGD is a nonpartisan, independent organization and does not take institutional positions.