Recommended
Blog Post
A slightly edited version of this piece will appear in the Business Standard.
On November 14, India’s Business Standard revealed startling results from a leaked report from India’s National Sample Survey (NSS) that the government has withheld for months: despite official figures showing robust economic growth over this period, the survey showed that per capita consumption had fallen in real terms by 3.7% from 2011/12 to 2017/18. The same day, the government announced the entire survey would be permanently shelved, provoking a storm of debate.
Some argue that these consumption numbers from the NSS Consumer Expenditure Survey reveal the truth about the economy, while others claim the numbers are seriously misleading. Where do we stand? In our view, both arguments are extreme.
Commentators on one side have claimed that the new numbers—showing that real per capita consumption declined between 2011-12 and 2017-18—prove that the economy did not grow at 7 percent, as the GDP numbers for the period proclaim. And the fact that the survey was taken in 2017-18, the year after demonetization and the first year of India’s new, nationwide General Services Tax, is invoked as evidence that these policies severely affected consumption.
On the other side are those who believe the official GDP numbers are correct, and the consumption numbers are implausible. Some argue that the NSS numbers suffer from survey-related problems, such as false reporting to the enumerators (Swaminathan Aiyar). Others point out that the NSS numbers account for only a fraction of consumption—and a rapidly declining one—in the national income accounts (Surjit Bhalla).
All of these arguments have merit. But none are fully convincing. Consider first the defenders of the official national accounts. Without doubt, survey respondents are not entirely truthful, but unless it can be shown that this problem has worsened over time, then comparisons between periods—i.e., the consumption growth rate—should still be reasonably accurate. And to use the latest national income accounts as a benchmark to make assessments about the NSS numbers is problematic given that the CSO has difficulty estimating consumption, and there are known problems with the post-2011-12 national income accounts (NIA).
What, then, of the arguments on the other side, that the NSS numbers reveal the truth about growth? We have argued elsewhere that the official figures have indeed been overstating GDP growth. But that does not automatically imply that the NSS numbers are reasonable. We need to consider the evidence carefully.
Start by considering the broad direction suggested by the NSS estimates, namely that consumption growth has slowed. This indeed seems likely. Figure 1 compares various consumption growth estimates for the latest rounds (2011/12 to 2017/18) with those of the previous rounds (2004/5 to 2001/12). Most of the estimates slow sharply, in line with the deceleration in the macro-indicators, such as the Index of Industrial Production (IIP), exports, and imports. Note, however, that the NIA estimate moves in the “wrong direction”—another piece of evidence that NIA methodologies are problematic.
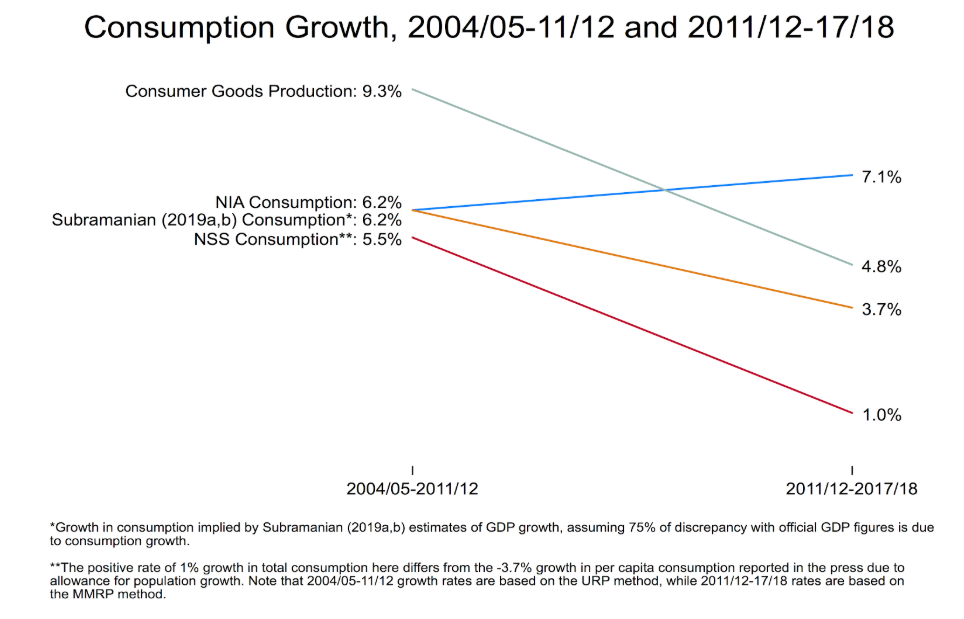
But does this mean the NSS figures are reasonable? Consider Figure 1 again, focusing on the indicators for the latest period. At the high end is the consumption from the NIA, showing real consumption growth of over 7 percent per year. At the other extreme is the NSS number of just 1 percent real growth per annum, once corrections are made for deflators, per capita numbers are converted into total numbers, and rural and urban data are aggregated into an economy-wide number.
In between the NIA and the NSS estimates is the growth in the IIP for consumer goods, which averaged 4.8 percent. The IIP doesn’t quite measure consumption, because it captures production, excludes consumer services, and is a volume number. But it is typically a good proxy, since consumer goods production and consumption tend to increase at similar rates.
We can derive another consumption growth estimate, which attempts to take into account the Central Statistics Office’s methodological problems. To do this, we first replace the official GDP growth rate every year by 4.5 percent, the average growth estimated by Subramanian (2019a and 2019b). We then allocate the implied reduction in GDP to private consumption and investment, assuming that other components of GDP such as exports, imports, and government consumption are well measured.
It turns out that even if we attribute 75 percent of the reduced GDP growth to (reduced) consumption, annual consumption growth in the national accounts would still be 3.7 percent, well above the NSS estimate. (Even if we shaved this figure further, in line with the World Bank’s assumption that about 2/3rds of the consumption growth from the national income is passed on to NSS consumption growth, the implied numbers would still be well above the latest NSS estimate).
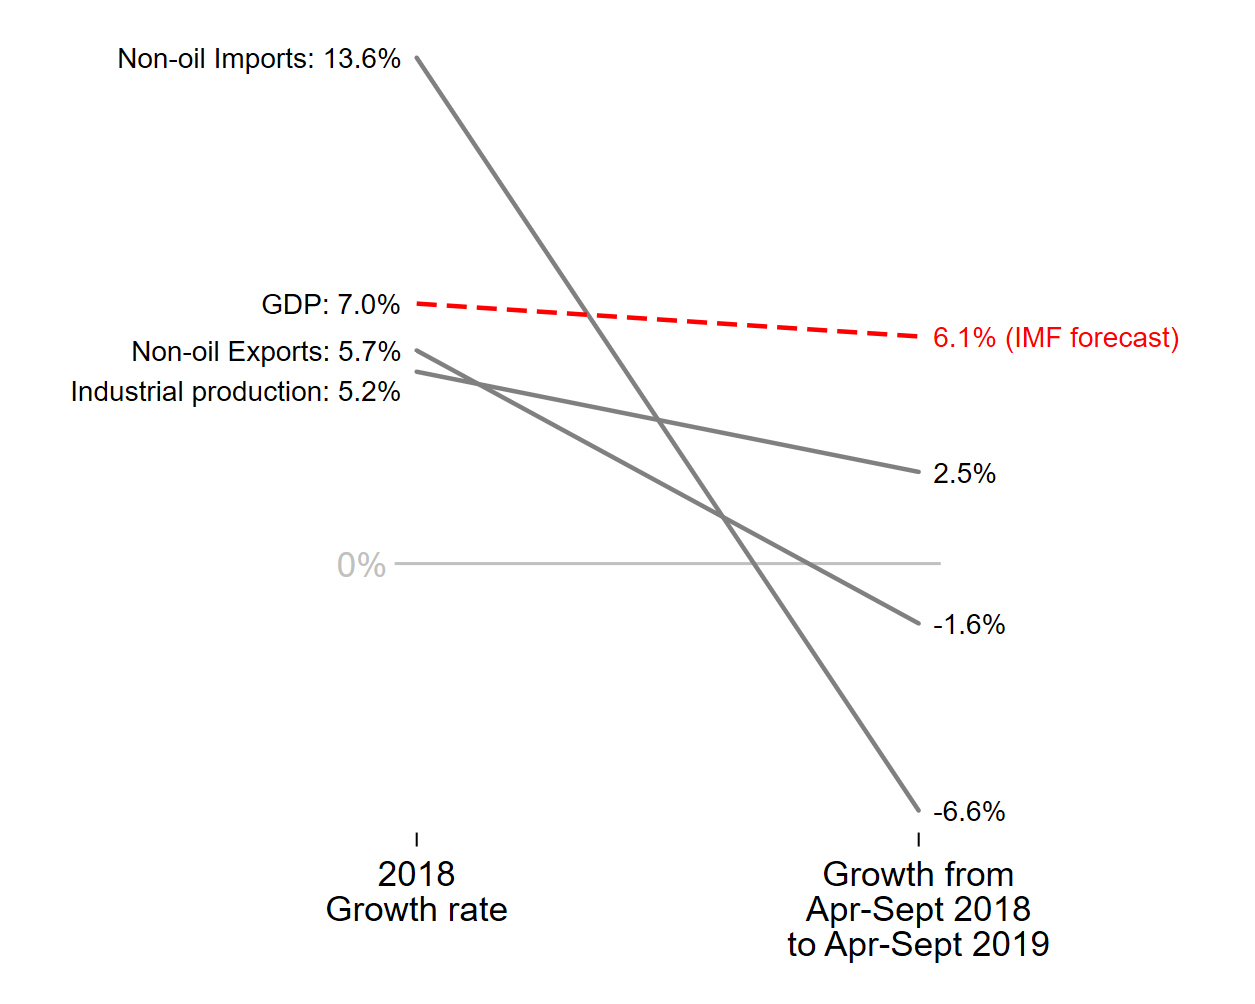
Furthermore, consider the timing of the NSS Survey. Far from being a bad year, 2017-18 was one of the few years when the economy did well, reflected in almost every indicator of economic activity. Growth in non-oil exports and non-oil imports surged; the IIP of consumer and capital goods rebounded sharply, as did capacity utilization in manufacturing. This was not just confined to the urban, formal sector: agricultural output and a rough measure of agricultural income show that 2017-18 was a year of recovery for rural India, as well. So it stands to reason that consumption growth would be reasonable, not feeble, as the NSS figures imply.
In sum, the NSS figure for consumption growth appears implausible when judged against other indicators. But so does the NIA figure. The reality probably lies somewhere in between: consumption was better than implied by the NSS figures, but not quite as good as that implied by the NIA.
There are some broad lessons here. To begin with, one should be careful about making strong statements about consumption based on the NSS or the NIA figures. Neither the dire conclusions on poverty developments drawn by the critics nor optimism about the earlier state of the economy promoted by the cheerleaders seems warranted.
All that said, the new data should be released. Of that there should be no doubt. There is surely much to be learned from the details revealed by the Survey, and all of us should be open to revising our priors depending on what they reveal. At a minimum, analysis of the underlying data could help us to identify the deficiencies in the surveys so that measurement can be improved going forward. And improving the measurement of the economy—to provide a more reliable basis for policy formulation—is the one thing that should be beyond debate.
Josh Felman is former IMF resident representative to India, Justin Sandefur and Julian Duggan are with the Center for Global Development, and Arvind Subramanian was former chief economic adviser to the Government of India.
The full data and code to replicate the analyses in Figures 1 and 2 can be found here.
Disclaimer
CGD blog posts reflect the views of the authors, drawing on prior research and experience in their areas of expertise. CGD is a nonpartisan, independent organization and does not take institutional positions.