More from the series


CGD NOTES
With the allocation of $650 billion of IMF special drawing rights (SDRs), the global economy has, in the words of the IMF’s Managing Director, been given a financial shot in the arm. One question that naturally follows is whether the injection has done any good?
The first step will be to see how SDRs are circulating through the global economy—transparency and accountability are the watchwords of the G7, the G20, and the IMFC, the IMF’s advisory committee. And at a recent event co-hosted by CGD and some distinguished institutions, the panelists all agreed that the IMF, other international financial institutions, governments, civil society, and journalists all have an interest in watching how SDRs open the monetary and fiscal space that is so badly needed by many vulnerable countries.
But this blog argues that will be hard to do unless the IMF lives up to its recent pledge to make more information on SDRs available to the public. I describe below what information is available now, what can be deduced from it, and what additional data might be needed from the IMF to fully understand the impact of SDRs. And we will suggest some of the ways the IMF could be more transparent in the months to come (click here to skip to the end for these recommendations).
One word of caution: the IMF gave the initial shot in the arm and tracing that shot’s circulation through the global economy is just the first step in assessing impact. Each government will have to be transparent about its own usage—a subject we will come back to in another blog.
Where can you find information about countries’ current SDR holdings?
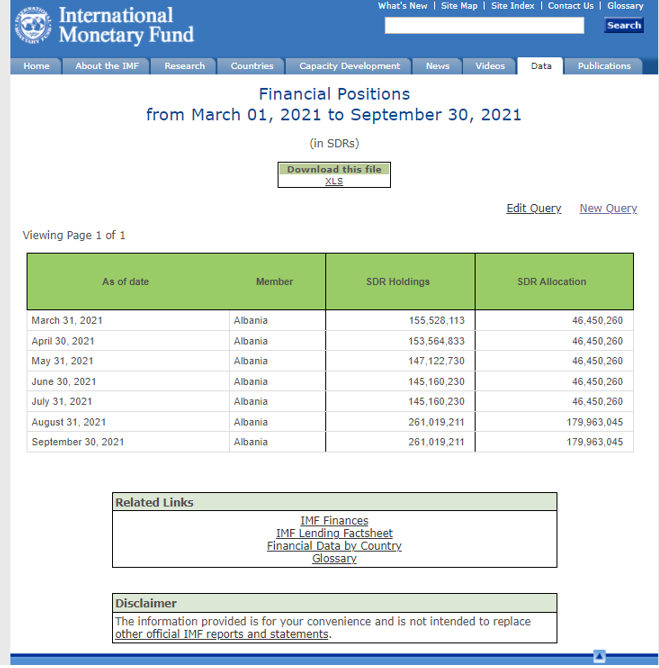
The best place to start to figure how SDRs are moving through the financial system is to look at countries’ SDR holdings and allocations by starting here, then clicking on the year, then the month of interest—you’ll get a list of countries, like this:
“SDR holdings” are how many SDRs the country has in its account at the IMF. “SDR allocations” are the total number of SDRs the country has been given over the years by the IMF, in this and past disbursements. When holdings are less than allocations, then the country pays interest (now at a rate of 0.05 percent per year). When holdings are great than the allocation the country receives interest.
In the screenshot above you see that as of September 30, 2021, Algeria (third row) was holding just under SDR 2.8 billion, while its allocation is just under SDR 3.1 billion. So, it is paying interest on the SDR 0.3 billion deficit. By contrast, Bangladesh (third from the bottom) has holdings (SDR 1.7 billion), which exceed its allocation (SDR 1.5 billion) and is thus earning interest.
Where can you find information about how SDR holdings change over time?
So holdings in a given month is interesting, but what we really want to know is how SDR holdings are changing. For example, when did Algeria deplete its SDR account and when did Bangladesh increase its holdings? Or perhaps more interesting, what has happened in the first month since the new SDR allocation took place? You can download the time series of SDR holdings and allocations for all countries or any group of countries here. The query page looks like this:
Tap on “Submit” at the bottom of the page, and you get the results (see below) in tabular form, which you can download as an Excel spreadsheet:
Remember that the new SDR allocation took place on August 23, 2021. So to get some idea of what countries did with their new allocation, I looked at the change in holdings between August 31, 2021, and September 30, 2021. Here’s the list of countries whose holdings went up and down that month:
The biggest decline in SDR holdings was Argentina, followed by Ukraine, Lebanon, and Ecuador. And the biggest increase in SDR holdings was China, followed by Japan and the United Kingdom.
How can we tell what the countries were doing with their SDRs?
Individual SDR transaction are not published by the IMF for reasons of confidentiality. Why did Argentina’s holdings go down? From whom China acquired SDRs? We don’t know, at least from the IMF database
There are basically three things a country can do now to effect a decline in SDRs holdings—pay off debt in SDRs, lend SDRs to the Poverty Reduction and Growth Trust (PRGT, an IMF trust that can redistribute them to poor countries, an option I have explored in detail), or exchange its SDRs for a hard currency with another member country or prescribed holder of SDRs. And a country acquires SDRs by being on the other end of one of those transactions.
Figuring out exactly what happened requires some detective work. We know from press reports that Argentina paid its debt service to the IMF in September and the Argentina country page shows a payment the equivalent of SDR 1.326 billion on September 20, 2021, which is the same amount of the depletion of Argentina’s SDR account. So, it appears Argentina paid its debt to the IMF from its SDR holdings. Looking at China’s country page all we can tell is that there were no transactions with the IMF, so we can deduce that it bought SDRs from another IMF member country though we don’t know which one.
Does the IMF tell us anything about SDR transactions?
While the IMF guards the confidentiality of individual SDR transactions, it does publish a quarterly accounting of gross flows of SDRs in its quarterly financial reports (before May 2021 and after May 2021) and annual reports. Interested readers should look at the section of the financial reports called “SDR Department.”
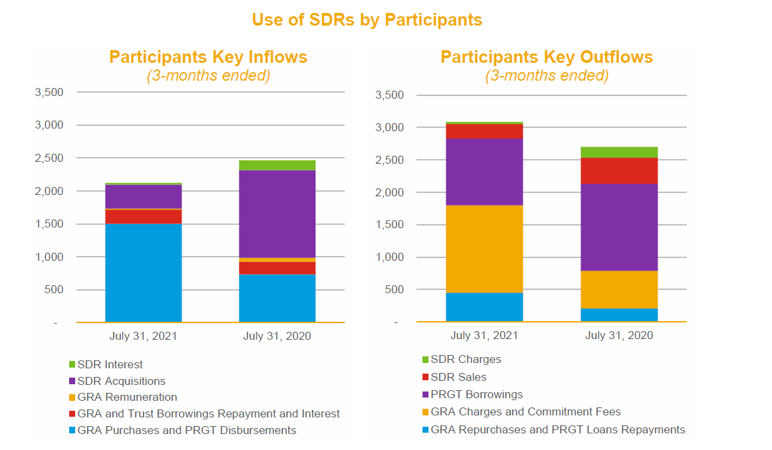
In the July 2021 report, the IMF provided this instructive graphic showing quarterly inflows and outflows of SDRs to member countries from transactions with the IMF as well as from sales and purchases of SDRs.
To analyze these charts, knowing a bit of IMF terminology helps: loans from the IMF’s balance sheet (the GRA) are called “purchases” and repayment of those loans are called “repurchases.” Interest on GRA loans is called “charges”. For transactions from the Poverty Reduction and Growth Facility (PRGT), more standard vocabulary is used—disbursements, repayments, and interest.
Note: The green boxes indicate interest received (left panel) or paid (right panel) when SDR holdings are not equal to SDR allocations. The red and yellow boxes in the left panel are remuneration due to countries that lend to the PRGT or other trust funds and the General Revenue Account).
From these charts the main things we can track:
-
Lending from the IMF in SDRs (blue box left panel, up in May-July 2021 compared to 2020);
-
Repayments to the IMF in SDRs (blue box right panel, up in 2021);
-
Debt service to the IMF in SDRs (yellow box right panel, up in 2021);
-
Country purchases of SDRs (purple box left panel, down in 2021);
-
Country sales of SDRs (red box right panel, down in 2021);
-
Contributions to the PRGT (purple box right panel, down in 2021).
Tracking these aggregate net flows will give us important clues to the impact of the recent SDR allocation. The first thing to note is that overall flows of SDRs are rather small—under SDR 3 billion out of a total SDR stock of SDR 220 billion in existence before August 23, 2021. It will be interesting to see if these flows go up later this year with the new allocation in place.
Note also, that in both years SDR outflows from all countries exceeded SDR inflow to all countries (the bars on the right panel are higher than those on the left). Where did they go as in theory SDRs are exchanged between countries? The likely answer is to the 15 prescribed holders of SDRs other than the IMF’s member countries: the IMF can hold SDRs in its own accounts as can various multilateral development banks and international financial institutions. (These 15 holders include the General Resource Account (GRA), the Poverty Reduction and Growth Trust (PRGT) and the Special Contingent Account (SCA1). The first two feed the lending operations of the IMF and the latter is a pool of precautionary balances to guard against any loan repayment arrears. As of the time of publication of this blog only 6 of the 15 prescribed holders actually hold any SDRs.) The data given in the quarterly financial tables shows the holdings of the GRA and lumps all other prescribed holders together.
Is there any more data on SDRs published by the IMF?
On an irregular basis, the IMF publishes a document called IMF Financial Operations. The latest edition, published in 2018, has detailed explanations of the mechanics of SDR allocations and exchanges and includes some summary information on use of voluntary trading arrangements (VTAs).
Some information on SDR usage can also be gleaned from individual country pages, as we did with China and Argentina above. But compiling all these data for all 190 member countries will be a bit of a chore and not all the elements needed to reconstruct a figure like the one above can be found online.
What more might we want to see from the IMF on SDRs?
As noted at the outset, the IMF has promised to be more transparent about countries’ use of SDRs (see question 8 here). In particular:
-
Changes in countries’ holdings of SDRs will be broken down into two components: transactions with the IMF and trading with other members or entities. This will give more clarity on whether SDRs are being used, for example, to service debt to the IMF or being exchanged for liquid currency.
-
The information on the overall use of VTAs and trends in SDR exchanges will be published will be published on an annual basis, rather than in the intermittent IMF Financial Operations book.
This information will allow us to confirm, for example, that Argentina did indeed pay its debt service to the IMF from its SDR account. But it won’t allow us to see where China got its SDRs from.
Understanding the importance of keeping individual transactions confidential, I have a few ideas to further enhance reporting on SDRs:
-
Quarterly reporting on VTAs and SDR exchanges would be useful in tracking impact as the new SDR allocation permeates the financial system.
-
The list of VTAs should be updated on an ongoing basis and be publicly available.
-
Separating out trends not just geographically but by income or geopolitical classification (e.g., low-income countries, G20 countries) would help track international commitments to reallocate SDRs and the impact of such reallocations on country financial operations. Thus, for example, we could see total SDR lending by the G20 to the PRGT and how much of this reduction in their SDR holdings was offset by purchases of SDRs from low-income countries and others.
-
A breakdown of gross flows for non-country designated holders, like that for individual countries, would aid in seeing whether and how other international financial institutions react to the substantial new allocation of SDRs.
-
Data on all the elements contained in the quarterly financial report table on SDR flows by country in an easily downloadable form. This should include data that separate PRGT from GRA flows, which are now merged.
And I hope that the IMF maintains an active dialogue with researchers, journalists, and advocacy organizations in the coming months about what additional information would be useful as we collectively try to understand the impact of the new allocation on the international financial system and member countries economic health and social well-being.
One last note—to get a full picture of the use of SDRs we will need to look at how each country uses the increased financial space its new allocation of SDRs gives to it. This cannot be discerned from IMF data, but I hope IMF country reports, both Article IV reports and program documents, will discuss this as a matter of course.
Lucas Sala provided research assistance on this blog. Helpful comments were received from David Andrews
Disclaimer
CGD blog posts reflect the views of the authors, drawing on prior research and experience in their areas of expertise. CGD is a nonpartisan, independent organization and does not take institutional positions.


