Recommended
Blog Post
There is a lot of money being spent on official development assistance (ODA). The Organisation for Economic Co-operation and Development (OECD) confirmed recently that countries provided over $160 billion in ODA in 2020. But ten years on from the global agreement reached in Busan, South Korea to improve the quality of how development cooperation is delivered, what do we know about how well provider countries and multilateral agencies spend that money?
Next month, we will publish the 5th edition of our tool that addresses just that question. The Quality of ODA “QuODA” measure brings together 17 indicators of aid quality, measuring 49 main aid-spending countries and agencies, in order to enable comparisons and drive up performance. How do we assess aid quality? This blog sets out our approach, explains our choices of what to include and exclude and shares new analysis which shows the relationship between recipients’ fragility, and the levels of ownership they report over development projects.
Aid effectiveness principles and scrutiny
The original idea of QuODA (first launched by CGD in partnership with the Brookings Institution in 2010) was to assess providers of development cooperation against principles they agreed in a series of international meetings on aid effectiveness beginning in the early 2000s in Rome, Paris, and Accra, and culminating in the Busan Agreement adopted by 161 countries a decade ago. Those principles still exist but our conversations with senior policymakers suggest they do not influence aid practices as much as initially hoped.
QuODA can encourage improvements which will ultimately improve the quality of aid.
Still, the goal of these principles—to maximise the effectiveness of development cooperation—remains as relevant today as ever. By analysing and comparing measures relevant to these principles, QuODA can encourage improvements which will ultimately improve the quality of aid.
Of course, the impact of aid on peoples’ lives will depend on the individual projects funded and how they are implemented, but indicators at the portfolio level are also relevant to impact.
QuODA 2021
The new edition of QuODA follows an extensive review process over the last two years that reflects the latest evidence on what matters to aid effectiveness, adjusts coverage for available data, and responds to policymakers’ feedback. QuODA assess 29 countries and the 20 multilateral agencies that spend the most aid, across four dimensions:
- Prioritisation: Is aid targeted where it is needed most?
- Ownership: Do recipients have ownership of projects?
- Transparency and un-tying: Is aid transparent, and untied from providers’ contractors?
- Evaluation: Do agencies evaluate and learn?
What’s new?
QuODA 2021 includes a new approach to assessing agencies on their evaluation and learning. As we explained in a blog last year, we draw on systematic assessments by the Multilateral Organisation Performance Assessment Network (MOPAN) and the Development Assistance Committee (DAC) peer reviews to provide what we think is the first quantitative comparative assessment of learning capabilities.
On ownership, we draw exclusively on the Global Partnership for Effective Development’s survey of recipients, which assesses the largest six projects for provider-recipient pairs. This survey provides crucial information, but isn’t assessed comparatively, so again, this will be new. We also include an indicator on response rates, to reward providers whose recipients feedback on them. This is clearly not in a provider's control, but we think the best providers encourage recipients to give feedback, and that the response rates are not random.
The transparency and tying measures are largely unchanged from prior editions of QuODA. They measure whether providers are transparent, comprehensive and timely about their aid spend. But alongside the traditional measure of providers’ declared share of aid that is not ‘tied’ to national providers, we assess ‘de-facto’ whether aid is untied: more specifically, we look at how much of a providers aid is spent with a national contractor over and above the share of the global contracts held.
Our prioritisation component has also changed significantly. It assesses whether aid money is spent in recipient countries, the extent to which it goes to poorer recipients, and—in a new indicator we outlined in the autumn—rewards providers who support those under-supported by others. Bilateral agencies are also rewarded for working through the multilateral system. Another indicator rewards agencies and providers that support fragile states or global public goods, including climate.
Table 1. QuODA 2021 indicators
| Prioratisation | Ownership | Transparency & Tying | Evaluation |
|---|---|---|---|
| P1: Aid spent in partner countries | O1: Alignment of objectives | T1: Aid reported in IATI | L1: Evaluation systems |
| P2: Poverty focus | O2: Use of country financial systems | T2: Comprehensiveness of data (OECD) | L2: Institutional learning systems ) |
| P3: Support to under-aided countries | O3: Reliability and predictability | T3: Timeliness (International Aid Transparency Initiative (IATI) and OECD) | L3: Results-based management systems |
| P4: Core support to multilaterals | O4: Partner feedback | T4: Untied aid | |
| P5: Supporting fragile states and global public goods | T5: Untied aid (contracts) |
What we left out
We chose to leave out some measures of aid quality from this edition of QuODA. In particular, while we think pursuing gender equality and climate sustainability is important in development projects, the evidence and available data markers were not sufficient to clearly signal what made some aid higher quality than other in this regard. Both these indicators are included in our soon-to-be-released web interface for information but do not affect the scores: we’d be glad to hear feedback on this before the next edition.
Issues regarding state fragility and country capability
Since the last edition of QuODA in 2018, we’ve received lots of feedback recognising that poverty will increasingly be concentrated in fragile states. Previous QuODAs included an indicator premised on the idea that aid has more impact in well-governed countries, but our review of the evidence suggested this was no longer clear, so we’ve removed that indicator.
A related issue is on ownership. Can we expect providers working in the most fragile states to achieve ownership from governments with limited capacity? We had planned to adjust ownership measures accordingly (i.e. to expect a lower level of ownership in more fragile partners) but surprisingly, we did not find a negative relationship between fragility and any of the GPEDC indicators that correspond to ownership (see figure 1). In fact, in several cases (not shown) the limited relationship in the data saw higher ownership scores for donors with more fragile partners. Similarly, countries with a stronger focus on donating to fragile states, like Denmark and Ireland, also achieve above good ownership scores.
Figure 1. Reported use of country systems (Ownership) compared to fragility level
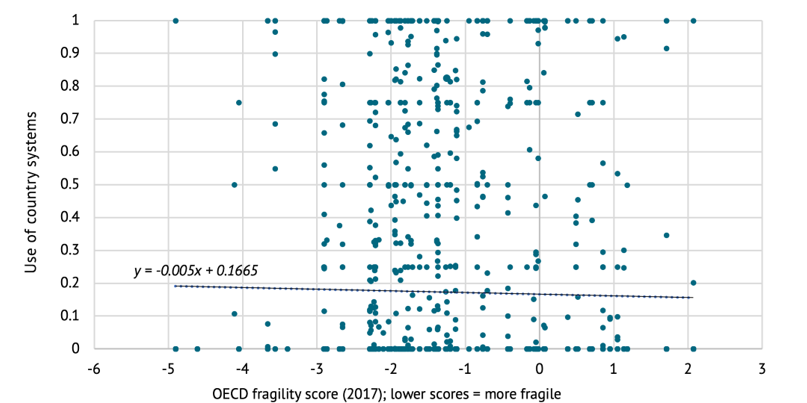
Notes: Each point on the chart represents the score provided for a dyadic pair (i.e. score assigned by a recipient for a given provider) on GPEDC indicator 9b, which measures the proportion of development cooperation disbursed to a country that is managed using partner country systems. OECD fragility score is the Aggregate PC1 indicator from their states of fragility data. All 2017 data.
This may merit further research, and could perhaps reflect that fragile respondents were less likely to respond, but for our purposes, it suggests ownership scores would not benefit from being adjusted for fragility.
Conclusion
As with any index or set of measures, QuODA paints a partial picture. Still, we think these are the most important available measures of aid quality, though we welcome feedback on how they can be improved.
As ever, we hope policy officials and advocates will use them to challenge, explore, and improve performance, and we look forward to discussing the results in the coming months.
Table 2: Countries and agencies assessed in QuODA and ODA disbursed (2019)
| Development agency or provider country | Gross ODA Disbursements 2019 (US millions, current prices) |
|---|---|
| African Development Fund | 1944 |
| Arab Fund (AFESD) | 722 |
| Asian Development Bank | 3205 |
| Australia | 2898 |
| Austria | 1237 |
| Belgium | 2220 |
| Canada | 4741 |
| Climate Investment Funds | 270* |
| Czechia | 309 |
| Denmark | 2601 |
| EU Institutions | 18073 |
| Finland | 1152 |
| Food and Agriculture Organisation | 455 |
| France | 14544 |
| Germany | 26901 |
| Global Alliance for Vaccines and Immunisation | 2081 |
| Global Environment Facility | 281 |
| Global Fund | 3583 |
| Greece | 368 |
| Green Climate Fund | 257 |
| Hungary | 312 |
| Iceland | 61 |
| IFAD | 731 |
| IMF (Concessional Trust Funds) | 1473 |
| Inter-American Development Bank | 826 |
| International Development Association) | 18389 |
| International Labour Organisation | 281 |
| Ireland | 973 |
| Islamic Development Bank | 307 |
| Italy | 4404 |
| Japan | 18920 |
| Korea | 2652 |
| Luxembourg | 476 |
| Netherlands | 5307 |
| New Zealand | 555 |
| Norway | 4334 |
| OPEC Fund for International Development | 364 |
| Poland | 787 |
| Portugal | 442 |
| Slovakia | 116 |
| Slovenia | 88 |
| Spain | 2987 |
| Sweden | 5278 |
| Switzerland | 3214 |
| UNDP | 372 |
| UNICEF | 1023 |
| United Kingdom | 19620 |
| United States | 33711 |
| World Health Organisation | 548 |
Source: Data for DAC members (including the EU) is sourced from the OECD’s DAC 1 table and includes both bilateral and multilateral spending. Data for the multilateral institutions is sourced from the OECD’s Creditor Reporting System. Data downloaded April 30, 2021.
*QuODA uses 2019 ODA disbursement data recorded by the CRS/ OECD of $67m, though over 2017-19 CIF disbursements averaged $270m.
Disclaimer
CGD blog posts reflect the views of the authors, drawing on prior research and experience in their areas of expertise. CGD is a nonpartisan, independent organization and does not take institutional positions.