Recently I wrote an offhand comment about the “stagnation of foreign aid” in a draft introduction. On reflection, that didn’t sound quite right. So after some investigation with my research assistant, Albert Alwang, I came to the conclusion that the answer to the question posed in the title is actually “all of the above!” How can that be?
My sense that foreign aid has been stagnating is primarily due to the way it has been eclipsed by the rapid growth in foreign direct investment (FDI). In the post-World War II era, official development assistance (ODA) was justified as a way to make up for insufficient capital in developing countries, a concept which was discredited but survives as a ghost. When compared to FDI, ODA has indeed been SHRINKING. In 1970, ODA was 3 times larger than net (FDI) to low- and middle-income countries. By 2012, ODA was a mere fraction of net FDI (about 14 percent).
But development is not a simple function of capital flows and foreign direct investment doesn’t tend to finance public goods like infrastructure, social services, humanitarian assistance and improved public administration. ODA addresses these latter categories and as long as countries still face these kinds of challenges, foreign aid will remain relevant. So, Albert and I did some further digging.
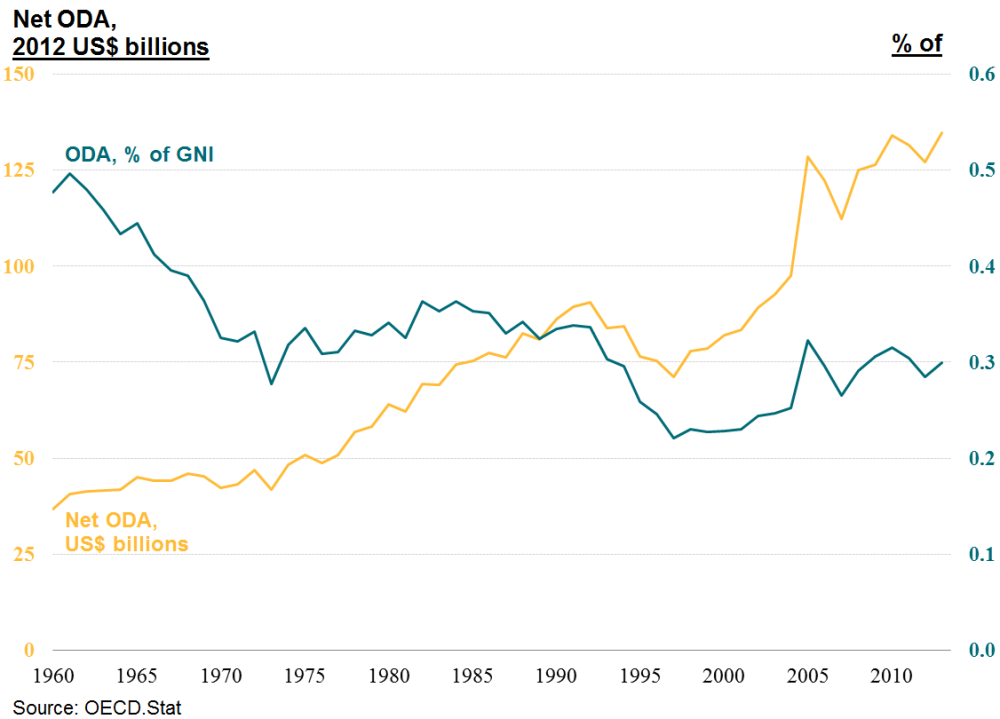
Despite last year’s headlines (e.g., “Aid to poor countries slips further as governments tighten budgets”), ODA is indeed GROWING as Chart 1 shows. In 1960, ODA was around US$28 billion. In the early 1990s it peaked around US$85 billion, surged to above US$125 billion in 2005, and now exceeds US$130 billion. Part of the recent boost is due to the United Kingdom’s fulfillment of its pledge to reach 0.7% of GNI. That’s a lot of money and represents substantial real growth in ODA. We know that some of this is number-fudging (see for example Kharas 2007 and Roodman 2014), but without more detailed analysis, my offhand statement about stagnating aid doesn’t have face validity.
Is absolute funding the right measure? Donor country incomes have also been rising over this period and donor generosity may not have kept pace with income growth. Chart 1 shows that, indeed, ODA has been SHRINKING as a share of donor country GNI since the 1960s. Despite the absolute growth in real funding, the share of national income dedicated to ODA has fallen from a little under 0.5% to around 0.3%.
Official Development Assistance, 1960 to 2012

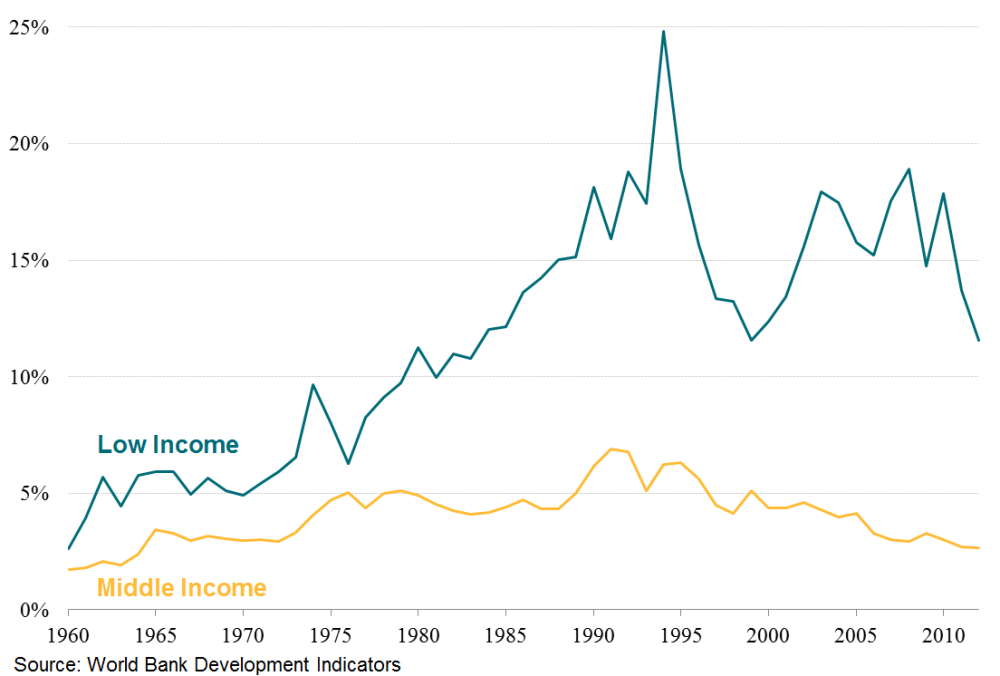
But that only says whether donor countries are more or less generous. Wouldn’t it be better to compare ODA to the need for foreign aid? Income in many low- and middle-income countries has grown quickly in the last two decades. Chart 2 gives two answers here, splitting the recipients into low- and middle-income countries. ODA to middle-income countries has been SHRINKING as a share of the recipient’s GNI, from a high of around 6% in 1990 to less than 3% today; but ODA to low-income countries has been STAGNATING, exceeding 15% of GNI in 1990 and fluctuating as high as 25% and as low as 12% before returning to 12% today. (Note, we calculated this by giving each recipient country equal weight, so China and India have the same influence on the resulting average as Nicaragua and Liberia.)
Official Development Assistance as share of recipient country GNI (%)

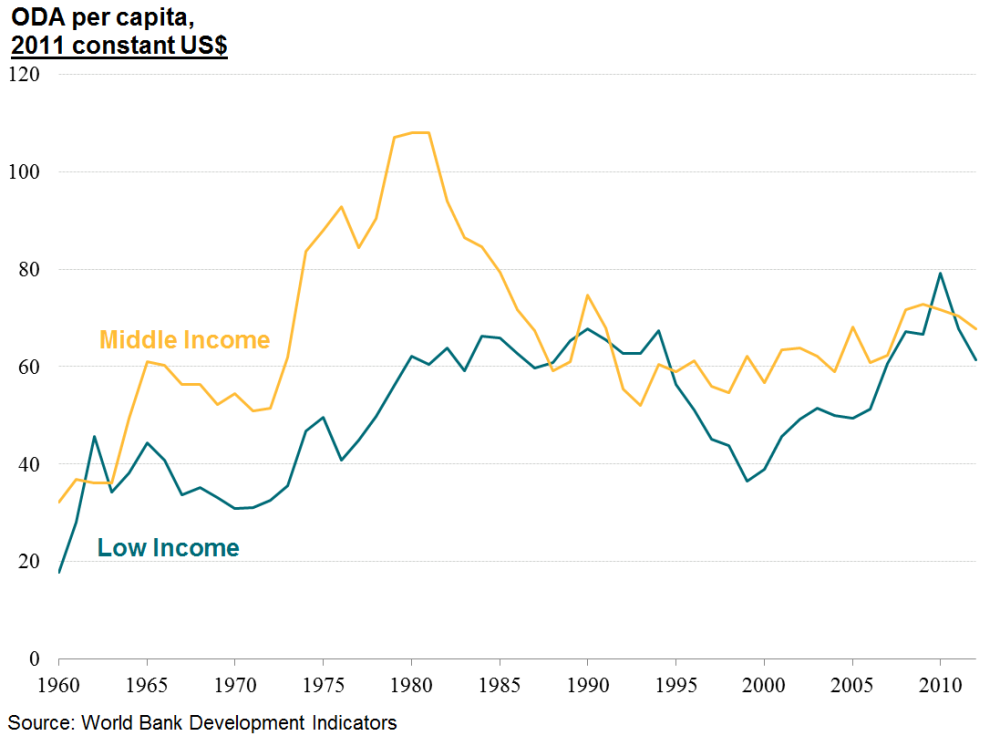
But then we asked: “Why should we count need in terms of income? What about population?” So Albert dug into the figures a little further and gave me Chart 3. The story for middle-income countries looks like a story of ODA STAGNATION; donors have provided a relatively steady US$60 to US$70 per capita since the late 1980s. But the picture looks different for ODA to low-income countries which was SHRINKING in per capita terms from the 1990s and then started GROWING again after 2000 – from US$40 to about US$60 today.
Average per capita Official Development Assistance received by income group

So now what do we do? The introduction to my draft still needs some motivation related to historical patterns of ODA. My intended starting point was that ODA is growing less relevant over time but I’m not sure I can really say that. Projections assembled by the DAC suggest that country programmable aid is going to be stable over the next few years while Simon Maxwell has outlined four significant trends that might undermine support for ODA. The figures also don’t address who receives the benefits of the aid – is most of it directed toward people in poverty or not? Nor do the aggregate figures address the all-important question of the benefits generated by this aid. In fact, a recent paper makes a bold proposal that donating countries should not be able to count disbursements as ODA unless the funded programs have demonstrated impact!
So which measure is important to the relevance of aid – the relation to foreign direct investment, donor country generosity (stinginess), recipient income, populations? Or should we give up the bean-counting and focus on outcomes? Advice welcome!
Special thanks to Albert Alwang for data and ideas, along with feedback from several CGD colleagues.
Disclaimer
CGD blog posts reflect the views of the authors, drawing on prior research and experience in their areas of expertise. CGD is a nonpartisan, independent organization and does not take institutional positions.


