In a recent blog, Kenneth Lay and I suggested a doing business survey for the World Bank and other multilateral development banks to get greater insight into the biggest bureaucratic costs associated with their lending. If the World Bank is going to take a greater role in financing mitigation projects in middle-income countries using IBRD finance, those costs have to come down.
To take one example, a dated estimate by the Independent Evaluation Group is that costs incurred by World Bank clients on safeguards average about 5 percent of World Bank financing and 3 percent of total project cost. The average costs of safeguards exercises on a Category A project in 2010 were estimated at $19.2 million; for Category B the figure was $ 5.2 million. (Category A projects are expected to have significant environmental impact and require full environmental assessment. Category B projects expect site-specific impacts and require only partial assessment.) That’s far from insignificant when the average project size of the sample on which this calculation was based was around $120 million. The financial burden is on top of considerable delays, and safeguards are far from the only source of costs—fiduciary, project management, and procurement requirements can add considerably more time and money. It is why clients often see infrastructure finance from the World Bank as a last resort option.
But beyond these transactions costs is another problem: World Bank staff see themselves as part of a “Knowledge Bank,” dispensing cutting-edge policy advice and project design expertise. That’s a positive disincentive against lending for a plain vanilla power plant or rail project because stripped of policy reform or design innovation, there’s little knowledge to impart. To be fair, in surveys, clients suggest value in that knowledge—if not as much as in the financing. But it surely adds to supply constraints: staff unwilling to sponsor projects that don’t “add value” with policy reform or demonstration impact.
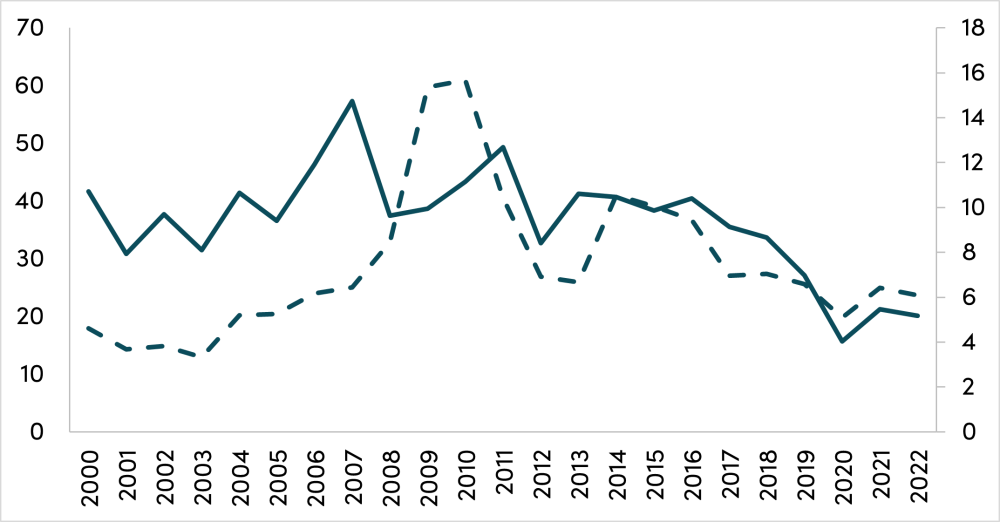
The extent of the challenges that the IBRD faces in infrastructure finance is made clear by looking at lending trends. IBRD finance for infrastructure has been on a downward path as a percentage of total IBRD lending for considerably more than a decade, from around 40 percent to about 20 percent in 2022. In terms of total dollar commitments, the trend has been downward since 2010, from $15 billion reaching about $6 billion in 2022.
If the IBRD is going to do more on mitigation, those trends have to reverse. “Embrace mediocrity and accept the unoriginal” may not sound like a great rallying cry for World Bank staff, but if we really want the institution to ramp up lending for renewable power and low-carbon transport, it might be the call we need.
IBRD infrastructure lending, 2000-2022 (solid line, left axis, percent of commitments, dashed line, right axis, $bn)
Infrastructure includes all projects where first sector is Energy Transmission and Distribution, ICT Infrastructure, Irrigation and Drainage, Non-Renewable Energy Generation, Oil and Gas, Other Energy and Extractives, Other Transportation, Other Water Supply, Sanitation and Waste Management, Ports/Waterways, Power, Railways, Renewable Energy Biomass, Renewable Energy Geothermal, Renewable Energy Hydro, Renewable Energy Solar, Renewable Energy Wind, Roads and highways, Rural and Inter-Urban Roads, Sanitation, Urban Transport, Waste Management, Water Supply. Data from here: https://datacatalog.worldbank.org/search/dataset/0037800/World-Bank-Projects---Operations
CGD blog posts reflect the views of the authors, drawing on prior research and experience in their areas of expertise.
CGD is a nonpartisan, independent organization and does not take institutional positions.


