Recommended
POLICY PAPERS
Last month we released a paper on the probabilities of success of different COVID-19 vaccine portfolios. A lot has happened since then, with many high-income countries entering second lockdowns, the World Bank announcing $12 billion for vaccine procurement and distribution (albeit mainly not via Covax, as we would have hoped), and most importantly, Pfizer and Moderna releasing promising results from their trials, with each product showing over 90 percent efficacy. Just today, the AstraZeneca candidate announced 70 percent efficacy on average; other companies such as Johnson & Johnson are close behind. Pfizer has now submitted its vaccine for emergency use authorisation with the US FDA and has signalled its intent to produce tens of millions of doses in 2020 and 1.3 billion in 2021. (In early blog posts, we discuss the relevance of the Pfizer vaccine for low- and middle-income countries and what "90 percent efficacy" means for establishing effectiveness and safety.)
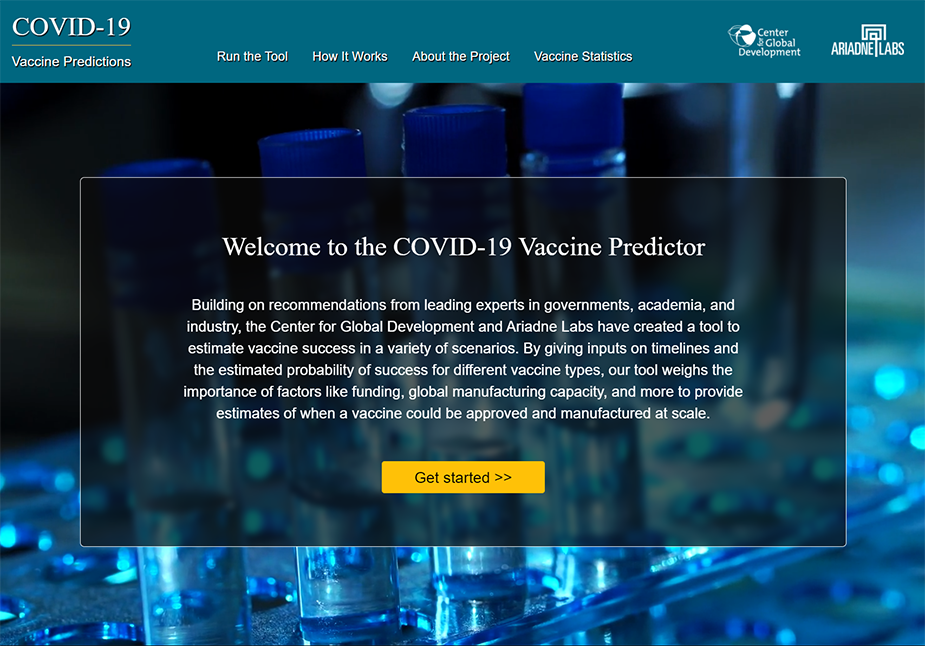
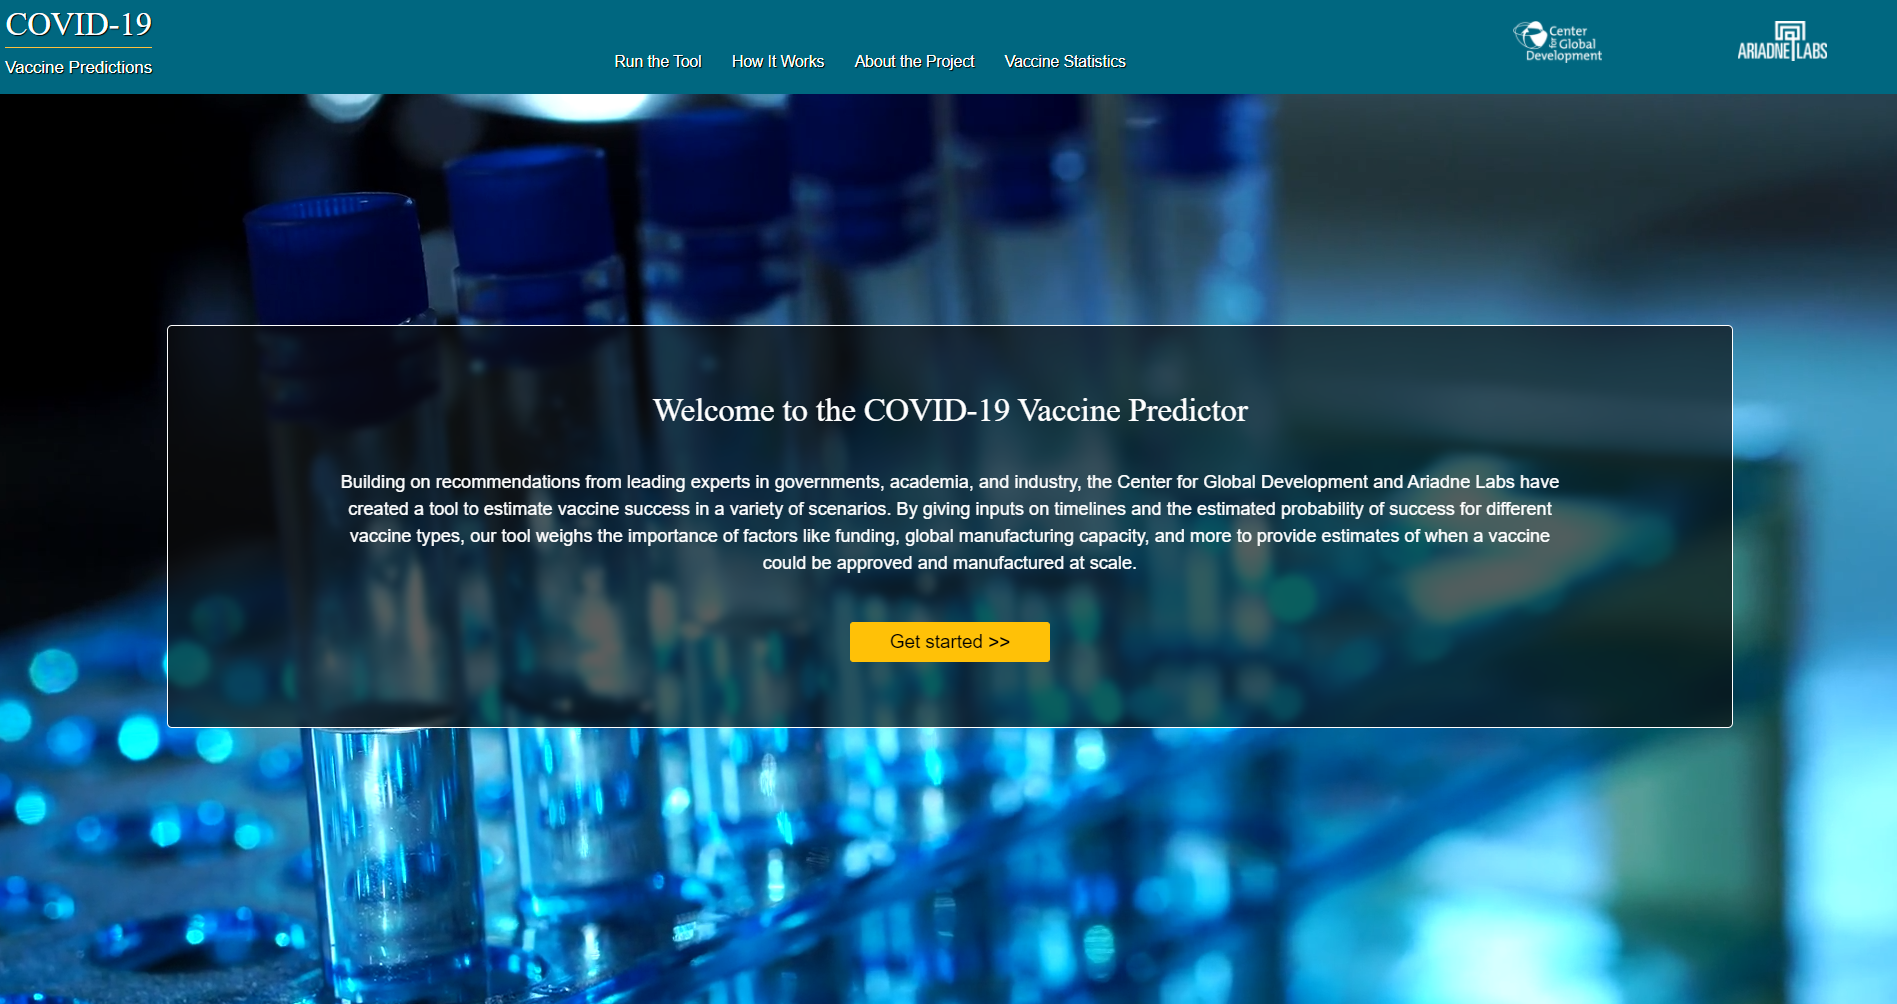
Amidst these developments, we release today the COVID-19 Vaccine Predictor—a web version of the model that underpins our earlier paper. As we describe below, the webtool allows users to analyse the most up-to-date COVID-19 vaccine portfolio and generate estimates of the timelines for both R&D and manufacturing for specific vaccines. We also explain in this blog what recent vaccine development news means for the structure and outputs of our model; how we have amended the model to reflect what we now know; what our new results show; and how we plan to build on this in the coming weeks and months.
Use our model
When we launched our paper in October, we committed to making the model behind it available in an easy to use tool—which we do today with the launch of our online webtool. The tool enables users to analyse the portfolio themselves—taking into account both the R&D and manufacturing process. We’ve built our tool so that users who have different views or assumptions than we do are able to answer questions about how diversified the portfolio is, and how long it might take before vaccines are approved and manufactured. The model uses a mix of objective information on the portfolio (based on desk research); subjective information on which types of vaccines are likely to succeed; and our manufacturing model’s inputs (based on a mixture of desk research, interviews, and our internal expertise.)
While we have plugged default assumptions into the model, we encourage users to change these parameters and make all R&D inputs more optimistic or pessimistic.
Our tool also enables users to:
- Understand what is currently in the COVID-19 vaccine portfolio
- Change the average trial times and the probability of success of a vaccine reaching the next phase of the trial
- Indicate the importance of funding and platform type
- Moderate according to the total number of clinical trials that can be run
- Incorporate the odds that an unforeseen event will slow down all clinical trials
- Include scale up time for manufacturing
- Take into account global manufacturing capacity
- Add or remove vaccines from the portfolio, allowing you to study a subset of candidates
We encourage you to try the tool, help us refine the assumptions, share your comments and critique with us. See below for a handy overview of how to use the tool, and here for a guide.
As we welcome the news from Pfizer, Moderna, and AstraZeneca, is the notion of portfolio optimisation still relevant?
Yes, very much so. Given most countries, country coalitions, and Covax are still operating on the basis of vaccine portfolios through their advance purchase commitments (APCs), we must remember that no product has yet received conditional or full authorisation by a Stringent Regulatory Authority or WHO prequalification. With this in mind, revisiting the vaccine portfolios using the new information is certain to offer valuable guidance on financing and roll out plans. Second generation vaccines are still in play, and given the unpredictability of the virus, the fact that it is still hard to control through nonpharmaceutical interventions, and the variance in infrastructure, epidemiology, and demographics around the world, it’s important to make sure a robust marketplace and clinical trial capacity for testing their effectiveness and safety continue to exist long after the first emergency use authorizations have been granted. We have also not yet seen independent assessments of Phase III results or safety signals (beyond the short-term results in small selected populations described so far). So, uncertainty remains, and the journey is far from over.
Second generation vaccines are still in play, and given the unpredictability of the virus, the fact that it is still hard to control through nonpharmaceutical interventions, and the variance in infrastructure, epidemiology, and demographics around the world, it’s important to make sure a robust marketplace and clinical trial capacity for testing their effectiveness and safety continue to exist long after the first emergency use authorizations have been granted.
But the time will come in the next 12 to 18 months (we hope!) that portfolio optimisation will become increasingly about product selection, price negotiations, and roll out. Paradoxically, the advance market commitments, not informed by such considerations, have effectively made such decisions for governments without evidence of what works, for whom, and at what price. This is understandable to an extent but will inevitably change as more data on vaccine characteristics and contract details become known and get matched for country populations, epidemic stage (including population immunity levels), budgets and infrastructure for manufacture and distribution. We have called for early health technology assessments for vaccines to inform APCs and, upon launch, to inform selection and purchasing decisions, moving us from a suboptimal situation to one that is more accountable, predictable, and balanced in terms of risk sharing between developers and buyers going forward. With new products being launched and high-income countries having to choose between several options whilst also trying (one would hope) to avoid hoarding and sharing across the globe as optimally as is possible, our analysis will feed into, we hope country, regional and global HTA analyses, leveraging existing decision making processes to ensure accountability and build trust. Trust and accountability matter terribly because in the end, “vaccines don’t save lives, vaccinations save lives.”
Updates to the R&D model
Amid the excitement about the vaccines furthest ahead in the process, there are also exciting developments throughout the pipeline. Since we published our paper in October, the number of candidates in phase I trials has grown from 38 to 44, from 17 to 21 in phase II trials, and from seven up to nine in phase II trials. We keep our tool up to date by regularly updating our data sheet that tracks vaccines in the portfolio.
In the original model we had a category for each vaccine based on the phase of clinical development it was in, pre-clinical, phase I, phase II, and phase III, and submitted for approval. Because of recent announcements we have also created a new category to account for vaccines that have released positive phase III results. These vaccines are probably a few months away from receiving full or conditional approval (the end point our model uses) but look much more likely to do so given their positive results. They are also likely to seek FDA emergency use authorisation and are in the process of manufacturing millions of doses from as early as 2020 and hundreds of millions/billions more in 2021. Vaccines classed as “phase III preliminary results,” will see their odds of succeeding through phase III increase to 90 percent. After phase III such a product would still have a 74 percent chance of being approved (conditionally or fully) once phase III is complete, giving it a 66 percent chance of overall success. Timelines remain the same.
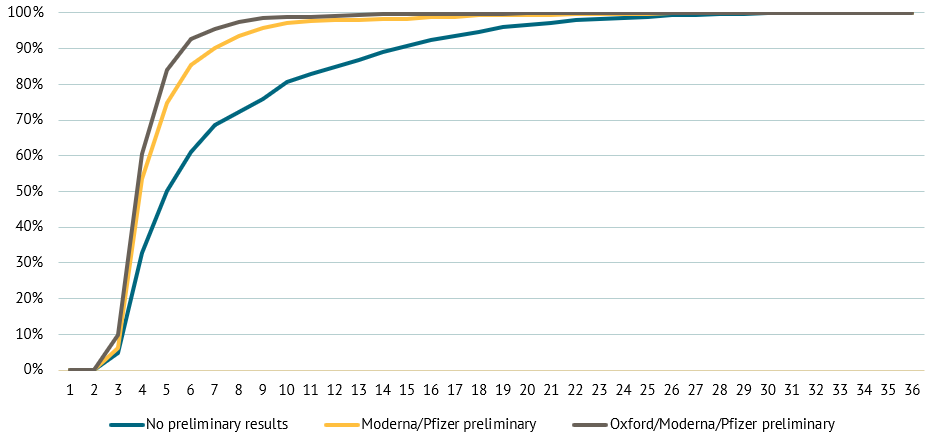
With these changes, the median point when the model predicts we will have a fully approved vaccine moves from April 2021 to March 2021. The bigger change, however, is that the model now estimates shorter periods until a vaccine is available at scale especially for high-income countries (HICs). The number of simulations where a vaccine is approved by October 2021 go from 81 percent to 97 percent of simulations. Our model is dynamic, and when one type of vaccine succeeds, similar vaccines are also more likely to succeed. As a result, the model is now generating results that show other RNA vaccines, not just Moderna and Pfizer, are more viable too. The experts we spoke with predicted that it will become harder for late entrant vaccines to win approval if the first entrant have high efficacy, setting the comparator bar too high. Our model accounts for this dynamic by making it more difficult for future vaccines once three have been approved, but given the high efficacy figures for Moderna and Pfizer and today’s results from AstraZeneca, the obstacles to second entrants might be greater than we have modelled.
The graph below shows the timelines to vaccine approval before the recent announcements, after we adapted the model and finally how the model would interpret positive results from the AstraZeneca Oxford candidate, alongside the other two announcements. As you’ll see the possibility that we’re waiting a long time for a vaccine has dropped, and it would drop more with another similar announcement but not by as much. *Please note, this graph was generated prior to the announcement from AstraZeneca.
Figure 1. Chance of approving a vaccine by month with different preliminary results
Updates to the manufacturing model
We have also made some changes to the manufacturing model. Firstly, it now allows for random variation in the inputs, meaning that it can better account for uncertainty. Secondly, we have created the option to start manufacturing vaccines prior to full licensure. If the user selects this option, the model will ramp up manufacturing once the candidate is in phase III, and has completed all the pre-manufacturing steps required to scale up production. This is more in line with the current practice we’ve seen from leading candidates which are manufacturing or plan to manufacture significant numbers of vaccine doses prior to full approval. For example, Pfizer/ BioNTech expect to have 50 million doses by the end of 2020, and more than a billion by the end of 2021.
Finally, we have changed assumptions around technology transfer. Under normal circumstances, some time can be invested in making a process robust and efficient at scale (scale up and process development) before being transferred to the final manufacturing facility (technology transfer). In the current emergency, these activities have been combined: if the “simultaneous” option is selected then the two activities happen in tandem, instead of sequentially, meaning that manufacturing in our model now starts a little quicker.
The new set of results suggests we will be able to produce enough vaccines to reach each medical staff and the over 65’s in HICs faster than before, while other targets remain similar. More detail on the precise workings of the model can be found in the methodology.
However, what we have not accounted for explicitly is the dramatic impact on manufacturing and scale up EUAs in high-income countries are likely to have. Both Pfizer and AstraZeneca are gearing up to enter full production mode upon EUA granted by FDA or Medicines and Healthcare products Regulatory Agency (MRHA) respectively. Our adjustments above including the optimistic scenario are meant to account for this. In the next iteration of the model we would like more formally to account for EUA—including perhaps EUA by a stringent regulatory authority being the equivalent of success which would have even more dramatic implications on manufacturing scale up timelines. However, given uncertainty remains we have not made this adjustment yet.
As before, this model uses default global capacity, from a survey undertaken by CEPI, but the user can now adapt these inputs. Capacity is allocated by platforms, so when a vaccine of a particular platform succeeds in the R&D model, the model looks for global capacity for manufacturing that type of vaccine, and gives a portion of it to the candidate. While this is not fully reflective of what will happen in the real world, when we have over 200 candidates—many of which have not made their manufacturing plans public and global capacity is tied up under bilateral contracts so not available to the vaccine candidate which succeeds—this was a reasonable assumption for brevity and tractability in the model.
Secondly, the model does not explicitly account for uncertainty and risk around batch failures. Which is plausible as consistency of materials, process, and practices is not always straightforward to establish. This become even harder when there is a secondary site of manufacturing, and the shorter time horizons for process checks might make batch failure more likely. Users can however adjust the minimum world manufacturing capacity input down, which would lead the model to on some runs really reducing global manufacturing capacity as is consistent with a batch failure.
We encourage users who have used their own inputs, to get in touch and share your results with us.
Finally, when we talk about more than a billion doses of capacity per month. It is unclear if there is available/secured supply of raw materials, lipids, adjuvants, consumables etc. for all of the vaccine sponsors. More work is needed.
Conclusion
We are excited to share our web tool and hope you will find it useful. We encourage users to play around with the parameters and explore the possibilities. Please do get in touch if you have any questions or suggestions for improvement. We also encourage users who have used their own inputs, to get in touch and share your results with us. It’s really helpful for us to see a broad range of assumptions and results and believe it will be interesting for our work moving forwards. We will also be launching a new survey to collect default inputs soon and if you’d like to be included please let us know.
Disclaimer
CGD blog posts reflect the views of the authors, drawing on prior research and experience in their areas of expertise. CGD is a nonpartisan, independent organization and does not take institutional positions.