Recommended
Blog Post
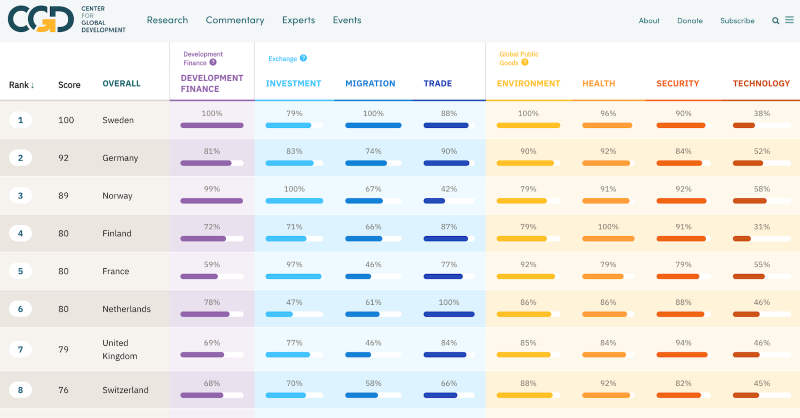
Commitment to Development Index 2023: Development Under Attack
The Commitment to Development Index (CDI) ranks 40 of the world’s most powerful countries on policies that affect global development. In an increasingly interconnected world, decisions made by the richest countries have impacts far beyond their borders, and often disproportionately affect the world’s poorest and most vulnerable. Yet greater global prosperity is in the common interest of all, creating new economic and trade opportunities, increasing innovation, and reducing risks posed by global health, security, and climate crises.
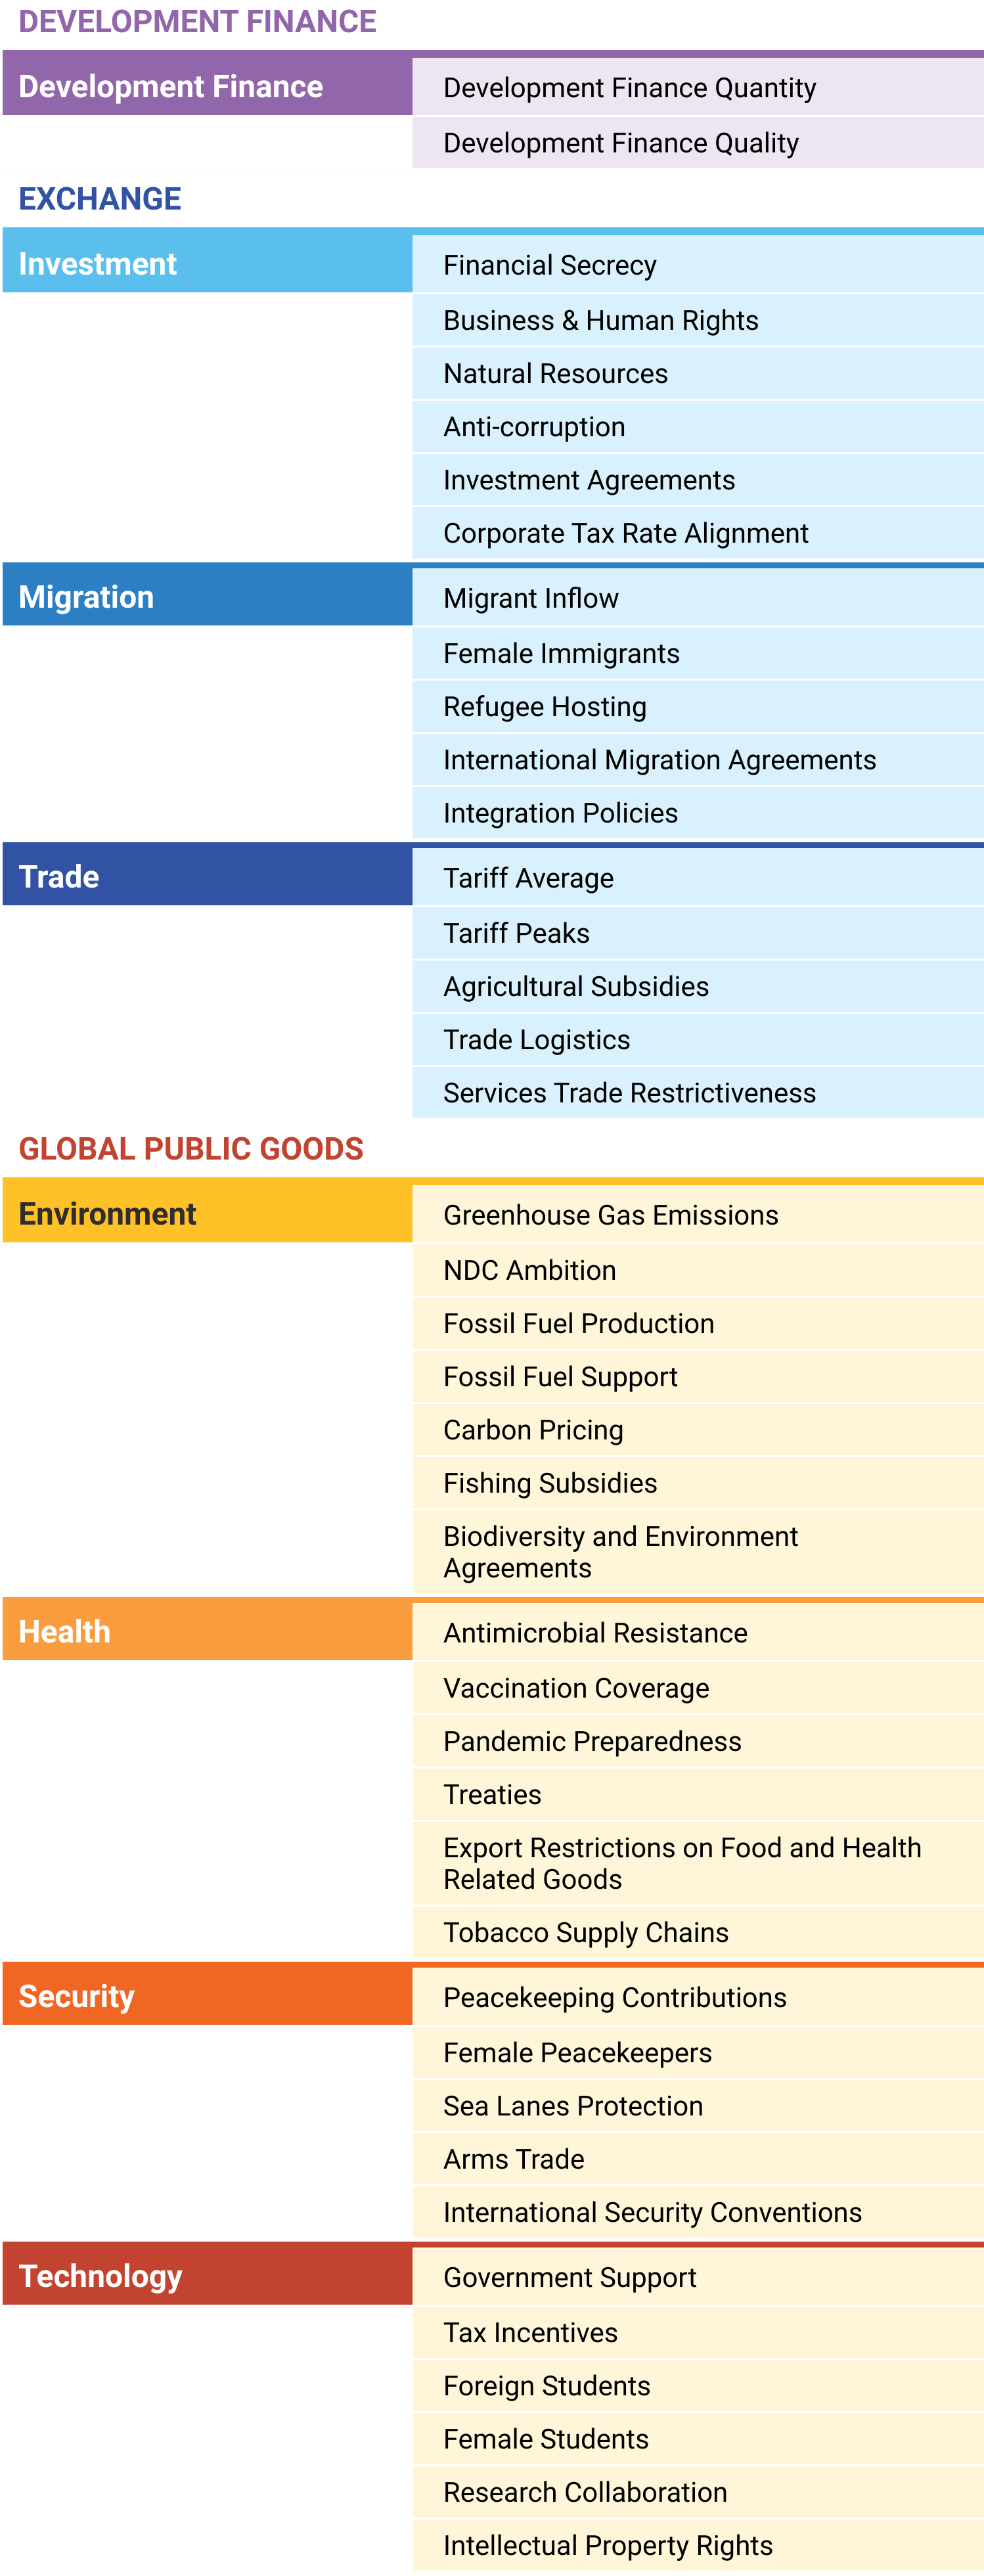
Because development depends on much more than just how foreign aid budgets are spent, the CDI covers eight distinct policy areas:
- Development finance
- Investment
- Migration
- Trade
- Environment
- Health
- Security
- Technology
What does the CDI measure?
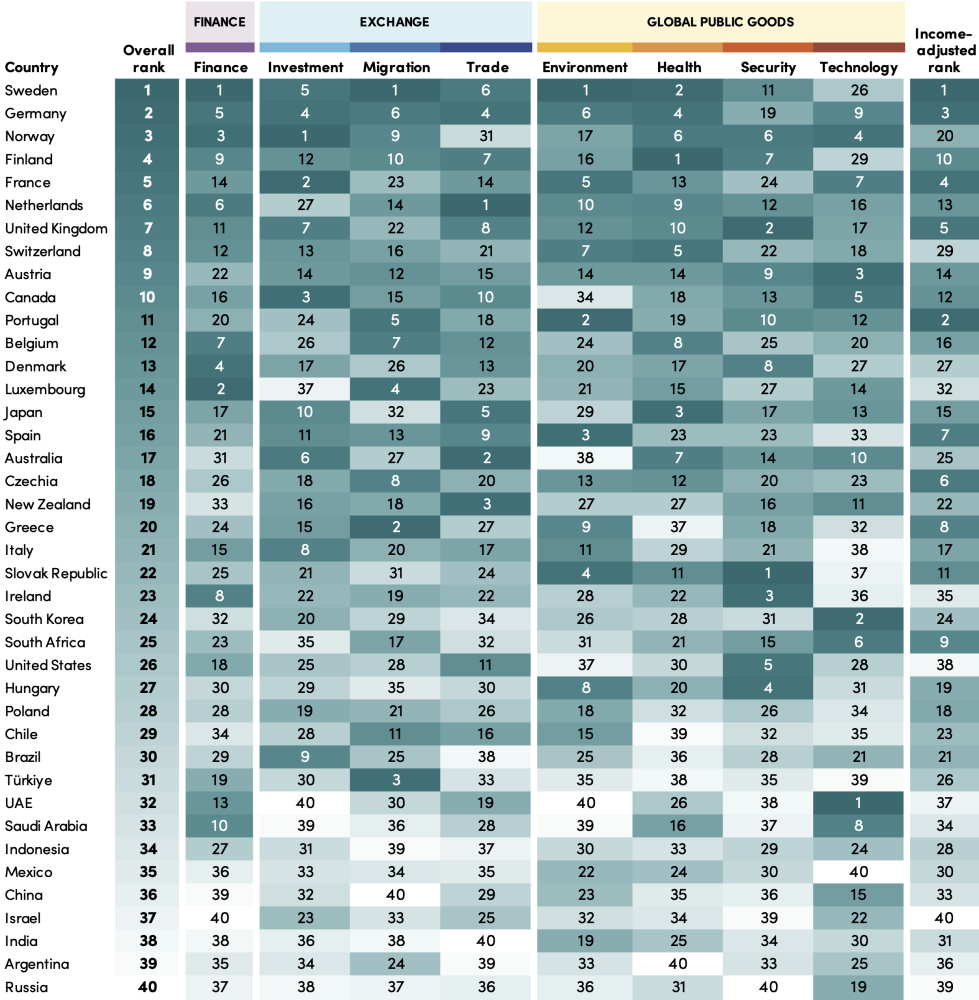
We assess countries across more than 40 indicators to come up with rankings for each of the eight policy components, as well as each country’s overall commitment to development. Countries score well for things like generous and high-quality finance for development, transparent investment, low barriers to trade for developing countries, and migration policies which are open and promote integration. Policies that enhance global public goods—such as fostering global health through disease prevention, supporting technological research, protecting biodiversity and the climate, and contributing to global security—also contribute to high scores.
How are countries doing?
Sweden tops this year’s CDI, followed by Germany coming in second and Norway in third place. Sweden ranks first in development finance, migration, and environment, and second in health. Its performance in technology, however, remains relatively weak with low levels of research collaboration. Though Sweden also finished top in the previous CDI, its lead over the next-best-performing countries has shortened.
Germany comes second overall, improving five places since the previous CDI. This is thanks in part to a substantial increase in its Finance for International Development, which rose from 0.46 percent to 0.61 percent of its Gross National Income (GNI). Norway ranks third, performing well in development finance and technology—and ranking first for investment—but underperforming on trade and environment due to high agricultural subsidies and fossil fuel production.
Finland and France complete the top five; the former also comes first on health, while the latter scores strongly on its policies supporting investment in developing countries.
The United Kingdom has dropped two places overall, in part due to a series of cuts to its aid budget—with Finance for International Development falling from 0.63 percent to 0.41 percent of GNI—but also because that aid is now less focused on poorer recipients.
Given the economic importance of countries in the G20, we include nine middle-income countries in the ranking. Among this group, South Africa ranks highest, in 25th place, with above average contributions in technology, security, and migration. Brazil and Türkiye were next highest with relative strengths on investment and migration respectively.
Changes in rank can reflect policy changes or improvements in data. The United Arab Emirates has risen seven ranks to 32nd overall but comes top on technology. With the publication of new data, we see that it hosts the highest number of foreign tertiary students relative to its domestic student population, while average incomes of the countries of origin of these students is the sixth lowest among CDI countries. Greece and Switzerland also rose by five or more places.
Collective progress or decline?
While the rankings highlight how individual countries are doing relative to other powerful economies, looking across the indicators can shine a spotlight on areas of collective progress or decline.
Across all components, most indicators measuring countries’ spending saw upward movement, with mixed results for development. In line with the post-COVID-19 fiscal expansion, over half of CDI countries increased their climate-harming fossil fuel subsidies, trade-distorting agricultural subsidies, and fishing subsidies encouraging stock depletion. On the upside, however, a similar proportion of CDI country governments also increased spending on technological research, with substantial efforts especially on tax incentives for private companies.
On development finance, we see a mixed picture. Although a majority of CDI countries increased spending relative to the size of their economies, including to meet the challenges of the continuing fall-out of the COVID-19 crisis, at the same time, several players with larger development budgets on an absolute scale—such as the UK, Norway, and China—have cut back.
Notably, more than three-quarters of CDI countries reduced migrant inflows, with movement restrictions implemented during COVID-19 disproportionately affecting immigration from lower-income countries.
Half of CDI countries also saw declining domestic vaccination rates for non-COVID-19 vaccines, marking a reversal of long-term gains in expanding coverage.
Development trends and insights
The 20th anniversary of the CDI coincides with the mid-way point to achieving Agenda 2030 and the Sustainable Development Goals (SDGs), yet this year’s publication occurs against a backdrop of major challenges, from the fiscal impact of COVID-19 and cost-of-living pressures, to surges of refugees, and the increasing frequency of climate-driven events. In this section, we highlight three major areas where countries’ responses to these challenges are being captured.
1. Countries’ development focus challenged amidst Russia’s disastrous invasion of Ukraine
Russia’s invasion of Ukraine has not only had a devastating impact on Ukraine’s people, but has had major effects worldwide, enabling some countries to step up, but also challenging the development focus of others. Previous editions of the CDI have reflected Russia’s low commitment to development—it scored near the bottom in every year it has been assessed, with particularly low scores on security for the notably high “conflict-potential” of its global arms sales. This year, we’ve adjusted Russia’s score on two indicators so that its peacekeeping contribution is negative, and we do not give it credit for hosting Ukrainian refugees. Along with Russia’s wider scores reflecting its lack of commitment to development, it comes last on the CDI.
In the wake of the invasion, other countries have been forced to step up their commitment to development, most immediately by receiving refugees. Czechia, Poland, Slovakia, and Ireland have each seen at least an eightfold increase in the number of refugees they accept since before the war. Even so, these efforts put into context just how significant Türkiye’s ongoing hosting of Syrian refugees is, as it remains the top-ranking country on this indicator. Still, many of these countries have not scored as well on their migrant integration and protection policies, and it remains to be seen whether recent surges in refugee inflows will ultimately lead to improvements on their integration efforts in the future.
Figure 1. Refugee hosting in 2022
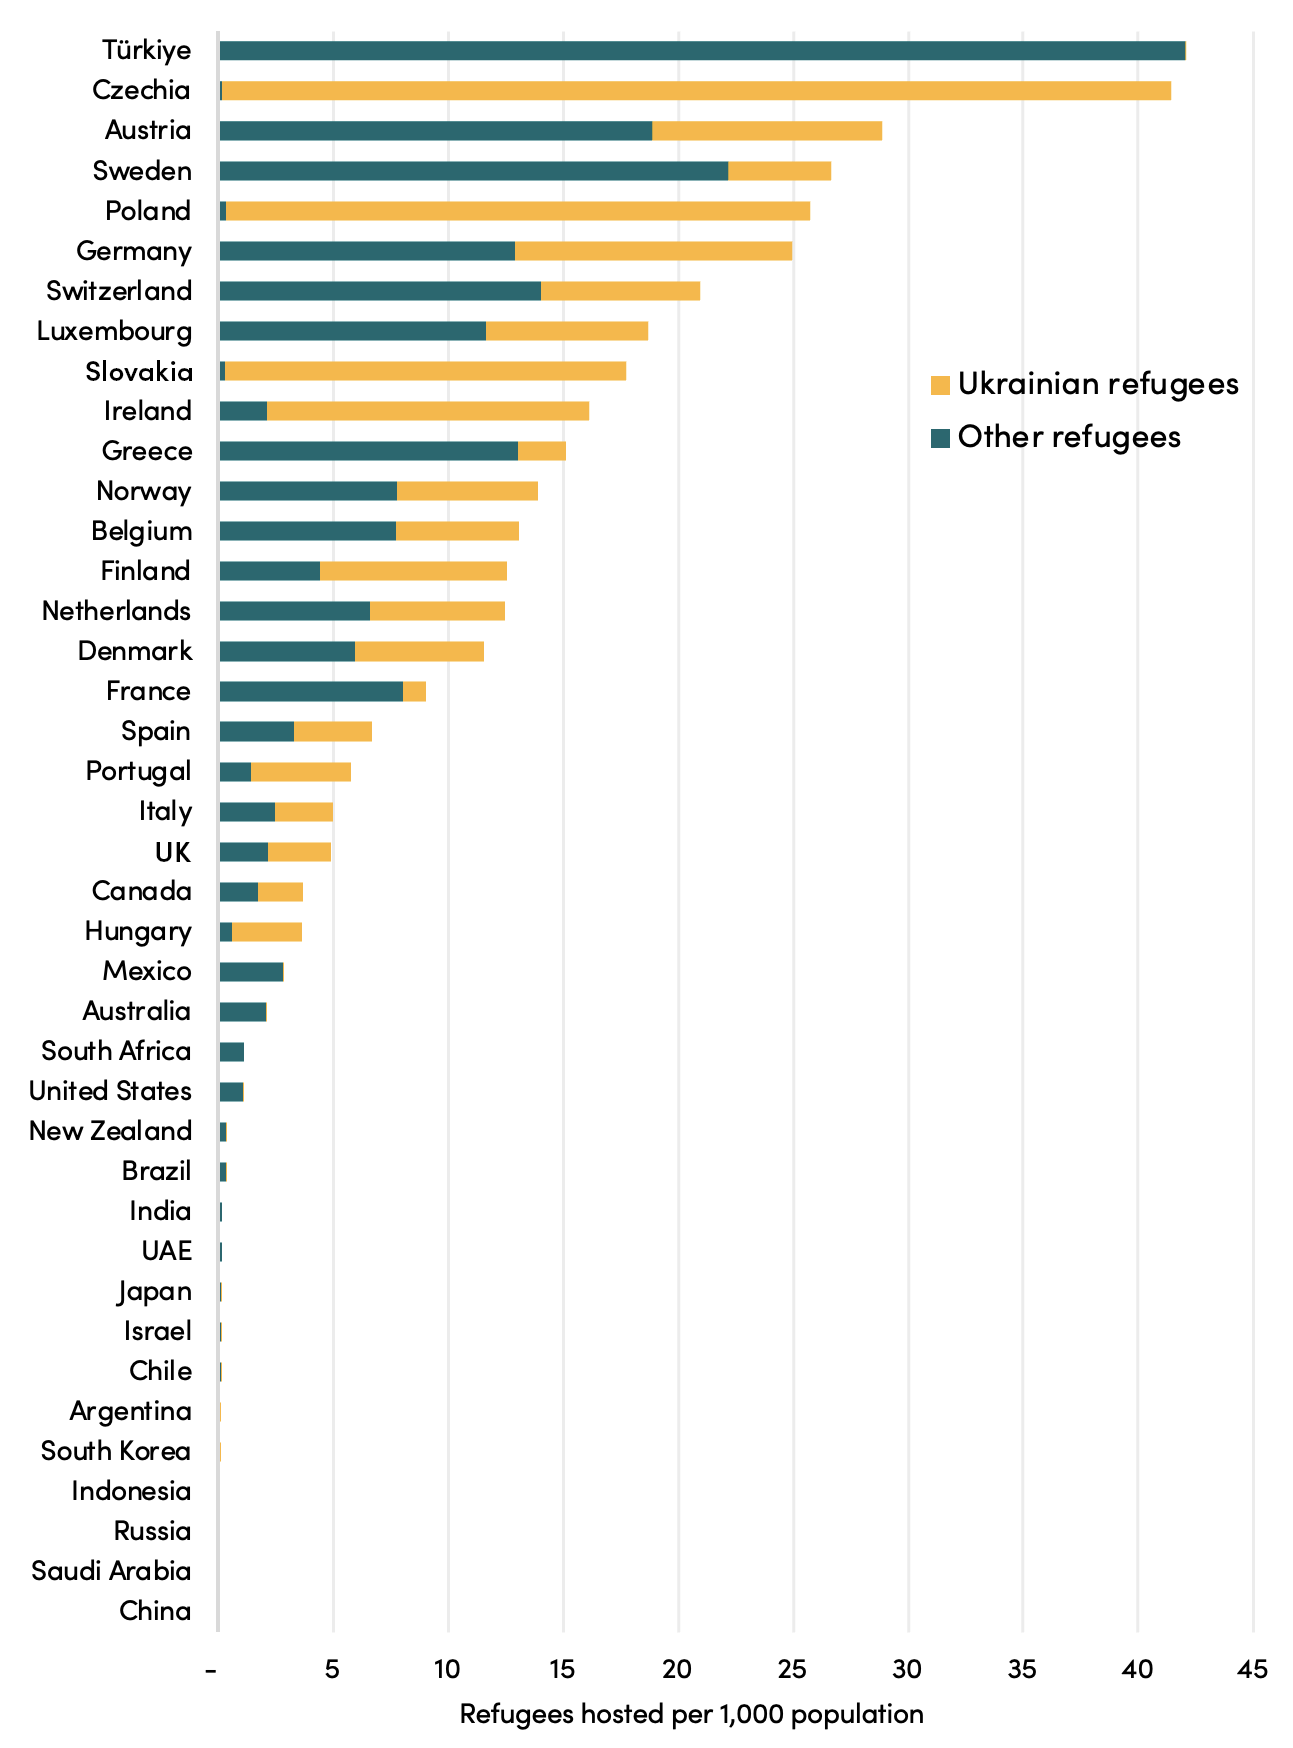
*Note: Ukrainian refugees to Russia are excluded from Russia’s score
Food shortages resulting from the invasion have also led some countries to implement new food-related trade restrictions, exacerbating inflation elsewhere, and impacting the nutrition and health security of lower-income countries. Even with the effect of sanctions targeting Russia excluded, we find that countries such as Argentina, Canada, India, Indonesia, Türkiye, and New Zealand have placed export restrictions on over 10 types of food products, with an impact on developing countries in the last two years.
While much of the knock-on impact of the war is yet to feed into the available data used in the CDI, we expect to see negative effects on cross-border development finance as funding is diverted to hosting refugees and rebuilding Ukraine, as well as growth in fossil fuel subsidies as governments respond to high energy prices.
2. Climate: words versus action
Climate change is increasingly recognized as the most serious threat to development and humanity; climate-related disasters, such as the 2022 floods in Pakistan, are becoming more frequent and severe, and threaten to undo years of hard-won development progress. Though much of the discourse has focused on volumes of climate finance going to developing countries, in the CDI’s environment component we look at how the most powerful countries’ policies at home support (or hinder) global climate goals. The countries we assess have an outsized impact on global climate trends, accounting for some 74 percent of current global greenhouse gas emissions.
We see mixed trends. On the one hand, during COVID-19, emissions (excluding those from land use) generally fell across the CDI countries—in the latest data, 37 countries reduced their emissions per capita. On the other hand, across all CDI countries with available data, government subsidies for fossil fuels increased between 2019 and 2021 to $322 billion (an increase from 0.28 percent to 0.38 percent of GNI), even before accounting for measures taken after the most recent spikes in energy costs.
This year, we also incorporated a new indicator which looks at the level of ambition in emissions reductions plans (Nationally Determined Contributions, or NDCs, submitted by countries to the UNFCCC). It assesses the degree to which these plans represent a reduction in emissions beyond what the countries are projected to be emitting in 2030 given current policies. Though the average CDI country plans to reduce emissions by 17 percent relative to projections, some countries—including Indonesia, Türkiye, Russia, India, and China—show little to no ambition to reduce emissions, and their NDC targets would represent an increase in emissions above current projections.
Figure 2. Planned GHG emissions reductions in 2030
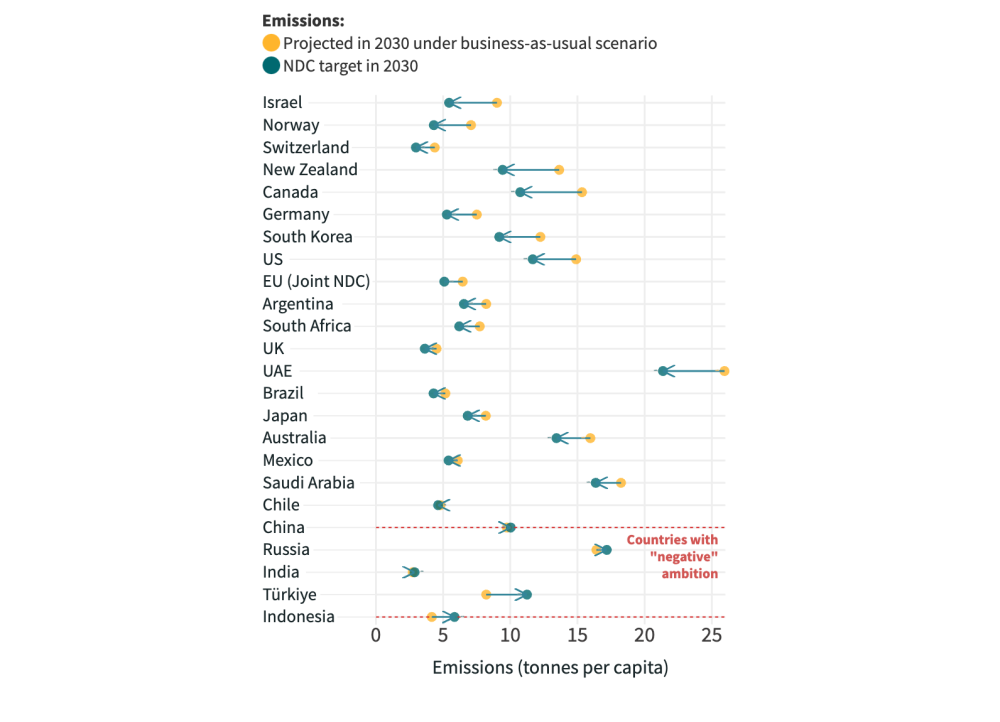
Note: ordered from best to worst, by the % reduction which meeting the NDC target would represent beyond current projections
Even some “ambitious” countries may be unrealistic—Israel and Norway have ambitious climate targets, but they are not backed up by key policies. Israel, for example, is one of just nine CDI countries which does not implement a carbon pricing scheme, and Norway has the highest rate of fossil fuel production of any country in the CDI. This may highlight policy incoherence—challenging lower-income countries to avoid fossil fuels while doing little to reduce them in high-income countries.
3. Technology is everything, and “traditional” development actors are lagging
At one level, the creation and spread of knowledge is everything for development—from basic healthcare practices to keep children and mothers alive, to the underpinnings of manufacturing and skills-based economies, or renewable technologies to achieve sustainable development. But against the backdrop of COVID-19, many countries have expressed concerns that access to vital new technologies, such as vaccines, is not being shared equitably.
This year, the technology component is led by the UAE, South Korea, and Austria. South Africa comes 6th, Saudi Arabia comes 8th, and China comes 15th, while the United States—often seen as the world’s innovation hub—comes in 28th. Sweden, which comes 1st on the CDI overall, also comes in the bottom half on technology. So, what drives these results?
While the technology component assesses policies which support domestic research and development (R&D)—and therefore, in the long-term, policies that expand the global pool of knowledge—the majority of the component assesses policies encouraging the transfer and diffusion of technology, especially with poorer countries. South Korea has the highest R&D expenditure across the CDI, and many “traditional” actors—including Austria, Norway, France, Germany, the Netherlands, and Japan—also spend at least one percent of their GNI on R&D.
But many of the emerging economies lead on technology diffusion. The UAE accepts more foreign students than any other country, with over 70 percent of its tertiary student population coming from abroad, and most of these coming from relatively poorer countries. Saudi Arabia and South Africa are this year’s leaders on research collaboration, with their academics co-authoring research with partners from lower-income countries more so than do other CDI countries. Meanwhile, China and Indonesia are assessed as having the most developmentally friendly provisions on intellectual property rights within their free trade agreements with developing countries, while EU countries and the United States are more restrictive than is the norm under the World Trade Organization. This also reflects a missed opportunity for many CDI countries—economic growth depends on trade and shared technological progress.
20 years of assessing commitment to development
It is 20 years since the CDI was first published. Since 2003, the development landscape has changed, and the CDI has evolved to reflect new understandings of what and who matter most for development.
The first edition of the CDI—published just a few years after the Millenium Development Goals (MDGs) were established—only looked at six components and assessed just 21 countries. Figure 3 shows how those founder countries perform over the entire period. The Netherlands was top in 2003 with strong scores on both aid (now development finance) and trade, but it has since fallen. This year’s top-ranked country, Sweden, was ranked 8th in 2003, with lagging performance on security and investment.
Two decades ago, the Iraq War underscored the importance of security for development. Russia's invasion of Ukraine last year serves as a stark reminder of the harmful impacts of armed conflict, with the resulting surge in oil and food prices undermining development. As in the early 2000s, debt sustainability has become an urgent concern, with the debt burdens of many countries exacerbated by rising interest rates, but on the back of a recovery from a global pandemic rather than the sustained economic growth of the earlier period.
Figure 3. CDI ranks over the years for the original 21 countries
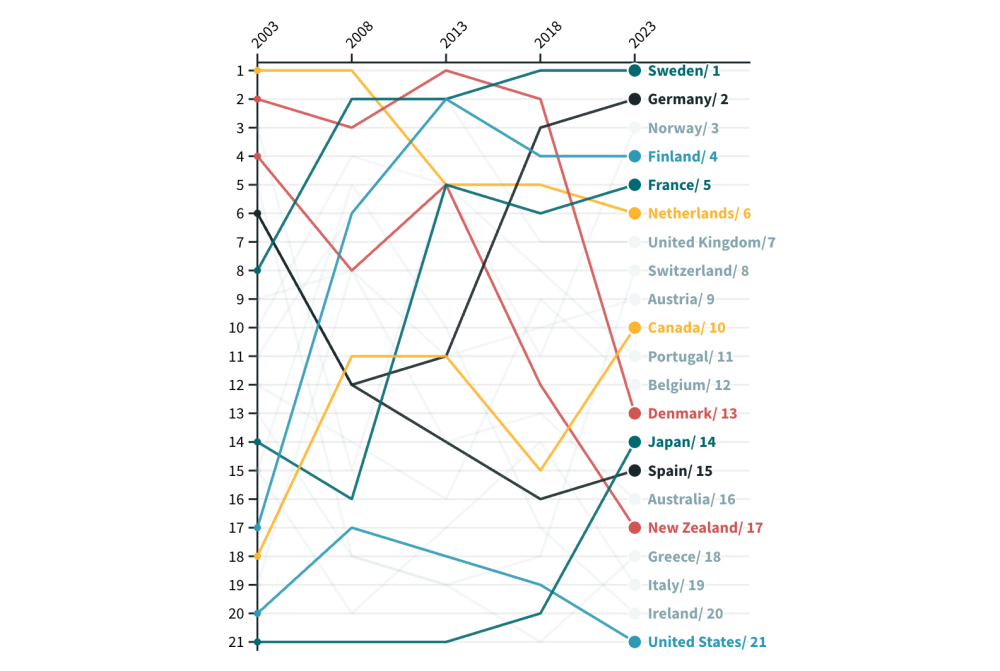
Note: ranks based on rank from original 21 countries only
Other notable movers over the 20 years are Japan, which was regularly last in the first decade, and Finland, France, and Germany who each improved significantly. Denmark, the Netherlands, New Zealand and Spain have waned in their commitment. The US has consistently ranked in the bottom quarter, but Canada has improved.
We’ve been able to assess a handful of key CDI indicators over the full 20 years, and they tell a surprisingly positive story. For example, annual migration to the 40 CDI countries has increased by almost half, from nearly 4 million per year to 5.9 million. Research and development expenditure has risen from 0.66 percent of GNI to 0.75 percent. On trade, 33 out of 40 countries now have lower average tariffs.
On finance for development, the efforts of traditional providers—those in the OECD’s Development Assistance Committee (DAC)—outpaced GNI from 2003 to 2013, rising from 0.24 percent to 0.30 percent, but cross-border finance has flatlined since. Still, China and other middle-income economies had added around a further sixth to total finance by the end of the period. Aggregate greenhouse gas emissions have gone up by 40 percent; but 30 countries (not the largest) have reduced per head emissions.
Over two decades, convergence between “emerging economies”—especially the BRICS—and traditional development actors has prompted us to expand the CDI’s coverage. What’s more, the transition from the MDGs to the SDGs recognised a more holistic development agenda, which has always been a key focus of the CDI. With the growing importance of global public goods, two components were added since 2003: Technology (in 2004), and Health (in 2021). But while the SDGs focus on outcomes and all nations, the CDI emphasizes how the policies of the most powerful economies can have an outsized impact. Today, the 40 CDI countries include all G20 members, and collectively account for 88 percent of the world economy, 74 percent of global greenhouse gas emissions, and 73 percent of world trade.
As the 2030 deadline for achieving the SDGs draws closer, CGD will continue to quantitatively assess powerful countries and their policy effort in supporting development.For Country Reports and Full Results
Visit cgdev.org/cdi to explore the interactive web portal and see how your country is doing on the Commitment to Development Index. More information on the CDI, including the full data model and method paper are available on our project site at cgdev.org/project/commitment-development-index.
About the CDI
The Center for Global Development has compiled the Commitment to Development Index since 2003. CGD works to reduce global poverty and improve lives through innovative economic research that drives better policy and practice by the world’s top decision makers. Ian Mitchell directs the CDI with significant contributions from Beata Cichocka and Edward Wickstead. The 2023 CDI builds on the work in earlier editions by Lee Robinson, Anita Käppeli, Owen Barder, David Roodman and Nancy Birdsall. The CDI is supported by funding for CGD Europe’s development effectiveness programme, including contributions from the governments of Australia, Canada, Germany, Luxembourg, and Sweden. The CDI does not reflect the official opinion of funders. The authors are responsible for all methodological decisions and for the information and views expressed here.
Édition spéciale 20e anniversaire
L’Indice de l’engagement pour le développement (Commitment to Development Index, CDI) classe 40 des pays les plus puissants sur la base des politiques ayant une incidence sur le développement mondial. Dans un monde de plus en plus interconnecté, les décisions des pays les plus riches ont des répercussions qui vont bien au-delà de leurs frontières et affectent souvent de manière disproportionnée les populations des plus pauvres et les plus vulnérables. Pourtant, une prospérité accrue au niveau mondial profiterait à tous, en créant de nouvelles opportunités économiques et commerciales, en stimulant l'innovation et en réduisant les risques liés aux crises sanitaires, sécuritaires et climatiques.
Étant donné que le développement ne se limite pas à l’usage qui est fait de l'aide étrangère, le CDI couvre huit domaines politiques distincts :
- Financement du développement
- Investissements
- Migration
- Commerce
- Environnement
- Santé
- Sécurité
- Technologi
Comment le CDI est-il calculé ?
Nous évaluons les pays en fonction de plus de 40 indicateurs afin d’établir des classements pour chacune des huit composantes politiques, et de mesurer l'engagement global de chaque pays en faveur du développement. Les pays obtiennent de bonnes notes grâce aux pratiques suivantes : financement du développement de bonne qualité, transparence des investissements, faibles barrières commerciales favorisant les échanges avec les pays en développement et politiques migratoires ouvertes et encourageant l’intégration. Les politiques qui améliorent les biens publics mondiaux, telles que la promotion de la santé mondiale par la prévention des maladies, le soutien à la recherche technologique, la protection de la biodiversité et du climat et les contributions à la sécurité mondiale, entraînent également des scores élevés.
Quels sont les résultats des pays évalués ?
La Suède est en tête du CDI cette année, suivie de l’Allemagne en deuxième position, puis de la Norvège, qui complète le podium. La Suède se classe première en matière de financement du développement, de migration et d'environnement, et deuxième en ce qui concerne la santé. Elle dispose toutefois d'une marge de progression en matière de technologie, les niveaux de collaboration dans la recherche étant relativement faibles. Bien que la Suède conserve la tête du classement, son avance sur les autres pays les plus performants s'est réduite.
L’Allemagne se place en deuxième position, gagnant cinq places par rapport au CDI précédent. Elle doit notamment cette progression à une augmentation substantielle de son financement du développement international, qui est passé de 0,46 % à 0,61 % de son revenu national brut (RNB). La Norvège occupe quant à elle la troisième place du podium avec des scores élevés en matière de financement du développement et de technologie - elle est notamment première en ce qui concerne l'investissement - mais ses performances commerciales et environnementales sont faibles en raison de ses fortes subventions agricoles et d’une production élevée de combustibles fossiles.
La Finlande et la France complètent le top cinq, la première se classant première en matière de santé et la deuxième obtenant un score élevé pour ses politiques de soutien à l'investissement dans les pays en développement.
Le Royaume-Uni a perdu deux places au classement général, en partie en raison d'une série de coupes dans son budget consacré aux aides - le financement du développement international étant passé de 0,63 % à 0,41 % du RNB - mais aussi car ces aides sont désormais moins ciblées sur les bénéficiaires les plus pauvres.
Compte tenu de l'importance économique des pays du G20, nous incluons dans le classement neuf pays à revenu intermédiaire. L’Afrique du Sud atteint le rang le plus élevé du groupe, en se classant à la 25e place grâce à des contributions supérieures à la moyenne en matière de technologie, de sécurité et de migration. Le Brésil et la Turquie lui emboîtent le pas avec des scores relativement élevés en matière d'investissement et de migration.
Les évolutions dans le classement peuvent refléter des changements de politique ou des améliorations dans les données. Les Émirats arabes unis ont grimpé de sept places et sont 32es au classement général, mais sont premiers en matière de technologie. Des données récemment publiées ont permis d’observer que ce pays accueille le nombre le plus important d'étudiants étrangers dans le supérieur par rapport à sa population étudiante nationale, les revenus moyens dans les pays d'origine de ces étudiants étant les sixièmes les plus bas parmi les pays du CDI. La Grèce et la Suisse ont également gagné cinq places ou plus.
Progrès ou déclin collectif ?
Tandis que les classements mettent en évidence les performances de chaque pays par rapport aux autres puissances économiques, l'analyse des indicateurs met en lumière les zones de progrès ou de déclin collectifs.
Pour chacune des huit composantes, la plupart des indicateurs mesurant les dépenses des pays enregistrent une tendance à la hausse, avec des résultats mitigés pour le développement. Dans plus de la moitié des pays évalués par le CDI, l’expansion budgétaire à la suite de la pandémie de COVID-19 s’est traduite par une augmentation des subventions aux combustibles fossiles néfastes pour le climat, par des subventions agricoles ayant faussé les échanges et par des aides à la pêche qui précipitent l'épuisement des stocks... Côté positif, un nombre équivalent de pays a également augmenté les dépenses dans la recherche technologique, en consacrant notamment des efforts substantiels aux incitations fiscales pour les entreprises privées.
En ce qui concerne le financement du développement, le bilan est mitigé. Une majorité des pays du CDI ont augmenté les dépenses par rapport à la taille de leurs économies, notamment pour répondre aux répercussions persistantes de la crise de COVID-19. Cependant, plusieurs acteurs disposant de budgets de développement plus importants en termes de valeur absolue - comme le Royaume-Uni, la Norvège et la Chine - ont choisi de réduire leurs dépenses.
Notons également que plus des trois quarts des pays du CDI accueillent moins de migrants, les restrictions de déplacement mises en œuvre pendant la COVID-19 ayant affecté de manière disproportionnée l'immigration en provenance des pays à faible revenu.
La moitié des pays du CDI ont également enregistré une baisse des taux de vaccination nationaux pour les vaccins hors COVID-19, ce qui marque une inversion de la progression à long terme dans la couverture vaccinale.
Tendances et perspectives de développement
Le 20e anniversaire du CDI intervient à mi-parcours de la réalisation de l'Agenda 2030 et des objectifs de développement durable (ODD). La publication de cette année survient également dans un contexte de défis majeurs, tels que l’impact budgétaire de la pandémie de COVID-19, les tensions sur le pouvoir d’achat, les vagues de réfugiés et la fréquence croissante des événements climatiques. Cette section analyse les réponses des pays à ces défis dans trois domaines majeurs.
1. La priorité au développement compromise par la désastreuse invasion de l'Ukraine par la Russie
Outre son impact dévastateur sur le peuple ukrainien, l'invasion russe a eu des conséquences majeures dans le monde entier. Alors que certains pays ont décidé d’intensifier l’aide au développement, d’autres l’ont, au contraire, remise en question. Les éditions précédentes du CDI avaient reflété le faible engagement de la Russie en faveur du développement – elle se classait parmi les derniers chaque année où elle était évaluée, avec des scores particulièrement bas en matière de sécurité en raison du « potentiel conflictuel » élevé lié à ses ventes d'armes au niveau mondial. Cette année, nous avons ajusté le score de la Russie sur deux indicateurs pour faire apparaître comme négative sa contribution au maintien de la paix. Et nous avons décidé de ne pas lui reconnaître l'accueil de réfugiés ukrainiens. Compte tenu des scores reflétant son manque d'engagement envers le développement, la Russie se situe à la dernière place du classement du CDI.
Dans le sillage de l'invasion, d'autres pays ont été contraints d'intensifier leur engagement en faveur du développement, en accueillant des réfugiés dans l’urgence. La Tchéquie, la Pologne, la Slovaquie et l’Irlande ont multiplié par au moins huit les admissions de réfugiés par rapport aux niveaux d’avant-guerre. Ces efforts mettent d’autant plus en évidence l'importance de l'accueil continu de réfugiés syriens par la Turquie, qui reste le pays le mieux classé pour cet indicateur. Pourtant, bon nombre de ces pays n'ont pas obtenu d'aussi bons résultats en matière de politiques d'intégration et de protection des migrants. Il reste à voir si les récents afflux de réfugiés conduiront, à terme, à une amélioration des mesures d'intégration.
Figure 1. Accueil de réfugiés en 2022
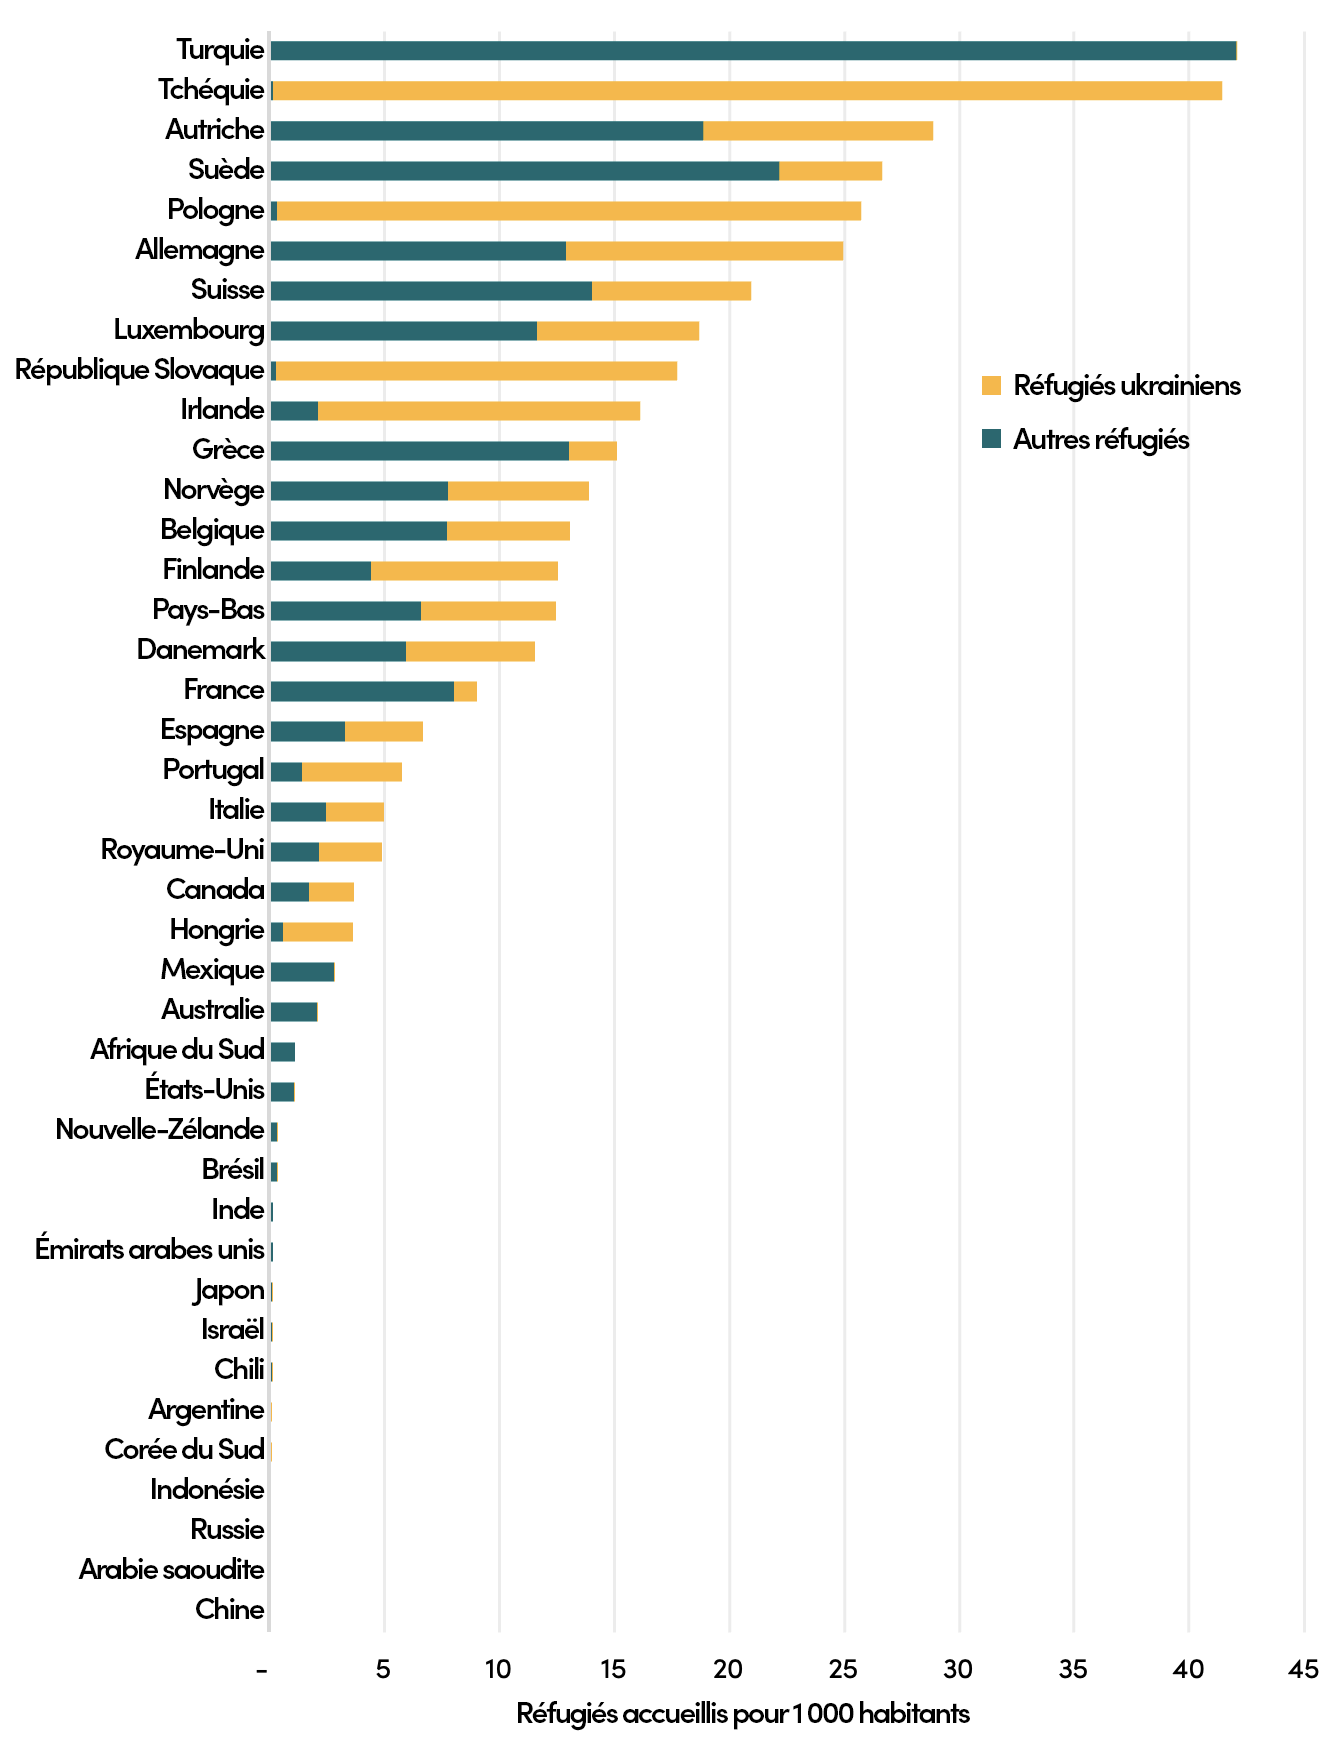
*Note : les réfugiés ukrainiens en Russie ne sont pas comptabilisés dans le score de la Russie
Les pénuries alimentaires résultant de l'invasion ont également conduit certains pays à mettre en œuvre de nouvelles restrictions commerciales sur les produits alimentaires, ce qui a exacerbé l'inflation partout ailleurs et affecté la sécurité nutritionnelle et sanitaire des économies à faible revenu. Même en excluant l'effet des sanctions visant la Russie, nous constatons que des pays comme l'Argentine, le Canada, l’Inde, l’Indonésie, la Turquie et la Nouvelle-Zélande ont imposé des restrictions à l'exportation sur plus de 10 types de produits alimentaires, ce qui a eu un impact négatif sur les pays en développement au cours des deux dernières années.
L'impact de la guerre est encore loin d'apparaître pleinement dans les données disponibles utilisées pour élaborer le CDI. Or des effets négatifs sur le financement du développement transfrontalier sont à prévoir car les fonds sont désormais redirigés en priorité vers l'accueil des réfugiés, la reconstruction de l'Ukraine, ainsi que les subventions aux combustibles fossiles, augmentées par les gouvernements pour contrecarrer la hausse des prix de l'énergie.
2. Climat : passer des paroles aux actes
Le changement climatique est de plus en plus reconnu comme étant la menace la plus grave pour le développement et l'humanité. Les catastrophes liées au climat, telles que les inondations de 2022 au Pakistan, sont plus fréquentes et tragiques, et elles menacent de réduire à néant des années de progrès durement acquis en matière de développement. Au-delà du débat public sur les volumes du financement climatique destinés aux pays en développement, la composante environnementale du CDI examine dans quelle mesure les politiques nationales des pays les plus puissants soutiennent (ou entravent) les objectifs climatiques mondiaux. Les pays que nous évaluons ont un impact démesuré sur les tendances climatiques mondiales : ils représentent environ 74 % des émissions mondiales actuelles de gaz à effet de serre.
Dans ce domaine, les tendances sont mitigées. D'une part, pendant la pandémie de COVID-19, les émissions (à l'exception de celles liées à l'utilisation des terres) ont généralement diminué dans les pays du CDI - selon les dernières données, 37 pays ont réduit leurs émissions par habitant. D'autre part, dans tous les pays du CDI pour lesquels des données sont disponibles, les subventions gouvernementales aux combustibles fossiles ont augmenté entre 2019 et 2021 pour atteindre 322 milliards de dollars (passant de 0,28 % à 0,38 % du RNB), avant même la prise en compte des mesures répondant aux pics des prix de l’énergie les plus récents.
Cette année, nous avons également intégré un nouvel indicateur qui porte sur le niveau d'ambition des plans de réduction des émissions (les Contributions déterminées au niveau national, ou CDN, soumises par les pays à la CCNUCC). Il évalue dans quelle mesure ces plans représentent une réduction des émissions au-delà des objectifs d’émission à l'horizon 2030 sur la base des politiques actuelles. En moyenne, les pays du CDI prévoient de réduire les émissions de 17 % par rapport aux projections. Cependant, certains pays, tels que l’Indonésie, la Turquie, la Russie, l’Inde et la Chine, ne montrent que peu ou pas d'ambition dans ce domaine, au point que les objectifs de leurs CDN représenteraient une augmentation des émissions au-delà des projections actuelles.
Figure 2. Réductions prévues des émissions de GES en 2030
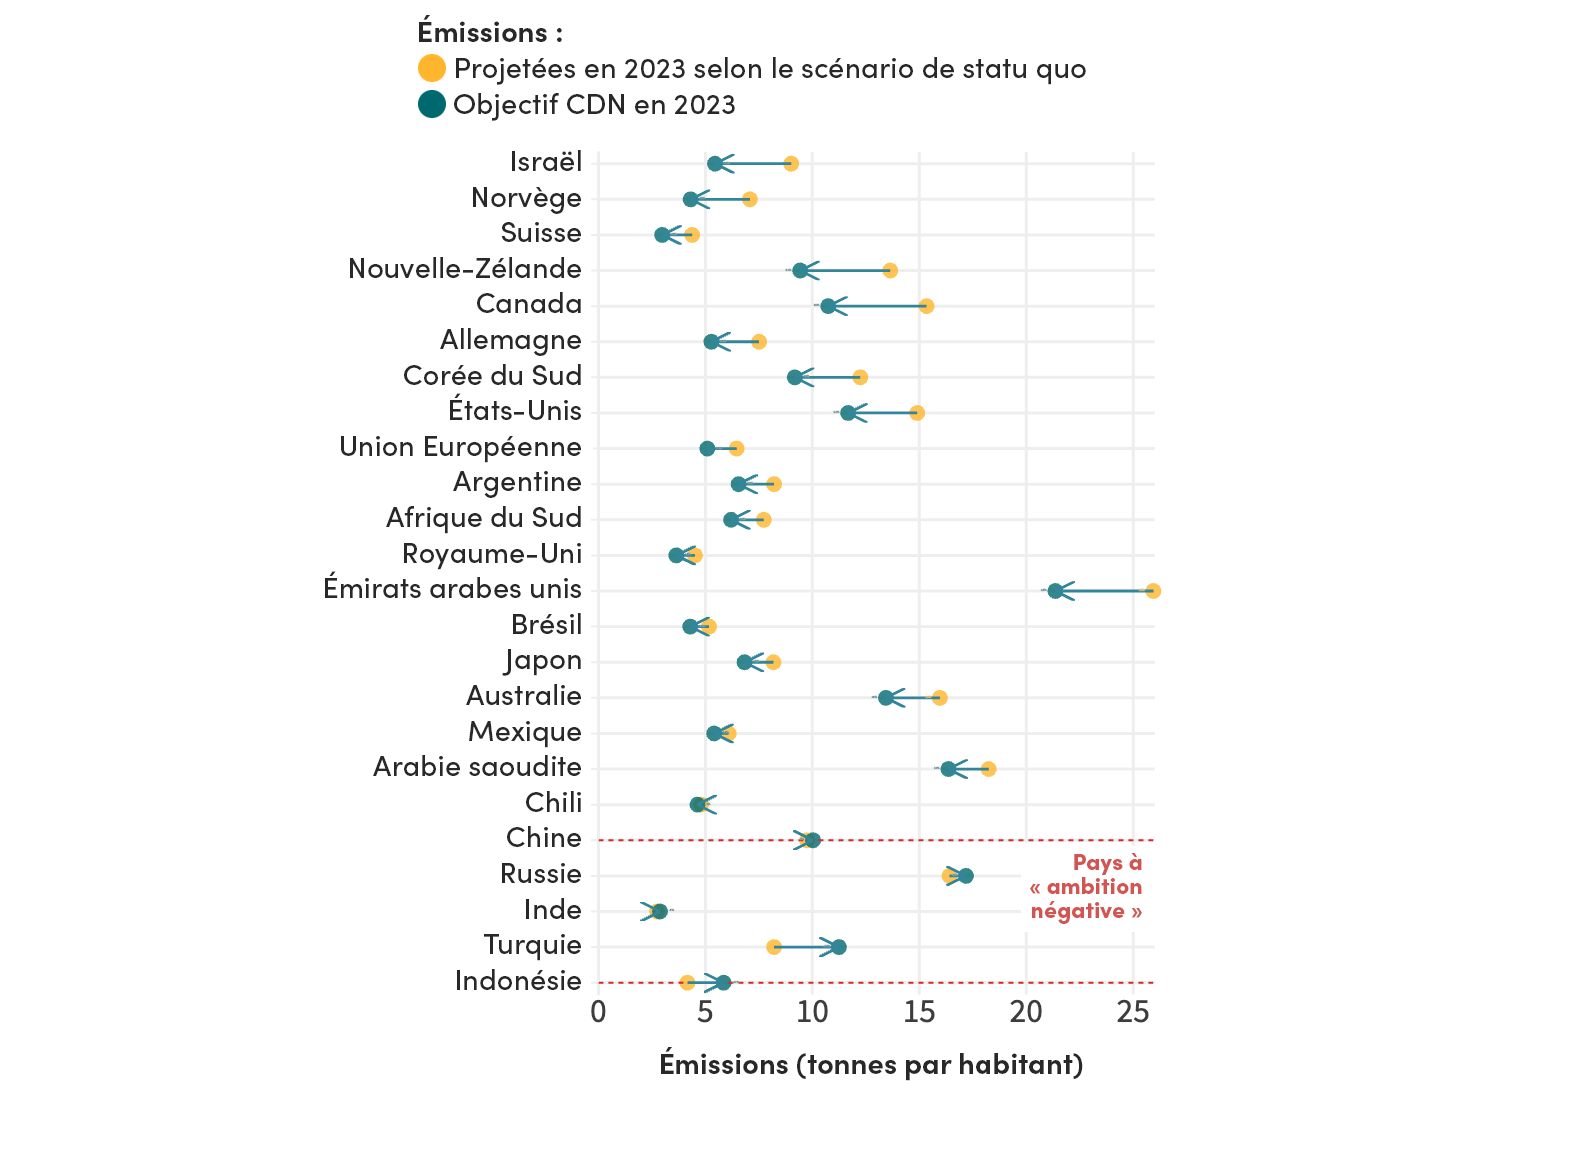
Note : classés du meilleur au pire, selon le pourcentage de réduction que représenterait l'atteinte de l'objectif CDN au-delà des projections actuelles
En outre, il est permis de douter du réalisme de certains pays « ambitieux », à l'image d’Israël et de la Norvège, dont les objectifs climatiques audacieux ne sont pas soutenus par des politiques fortes. Israël, par exemple, est l'un des neuf pays du CDI à ne pas mettre en œuvre de système de tarification du carbone, et la Norvège a le taux de production de combustibles fossiles le plus élevé de tous les pays du CDI. Ces chiffres peuvent révéler une certaine incohérence des politiques - qui consiste à demander aux pays à faible revenu d'éviter les combustibles fossiles, tout en faisant peu d’efforts pour les réduire dans les pays à revenu élevé.
3. La technologie est primordiale mais les acteurs « traditionnels » du développement sont à la traîne
La création et la diffusion des connaissances sont, à bien des égards, des aspects fondamentaux pour le développement, qu'il s'agisse des soins de santé de base qui sauvent les vies de mères et d’enfants, des fondements des économies manufacturières et basées sur les compétences, ou encore des technologies renouvelables qui visent le développement durable. Or dans le contexte de la pandémie de COVID-19, de nombreux pays se sont plaints du fait que l'accès à des nouvelles technologies vitales, telles que les vaccins, n'était pas équitable.
Cette année, la composante technologique est dominée par les Émirats arabes unis, la Corée du Sud et l’Autriche. L'Afrique du Sud se classe 6e, l’Arabie saoudite 8e et la Chine 15e, tandis que les États-Unis, souvent considérés comme étant le centre mondial de l'innovation, n’arrivent qu’en 28e position. La Suède, qui arrive 1re au classement général du CDI, se situe également dans la moitié inférieure en matière de technologie. Comment expliquer ces résultats ?
La composante technologique évalue les politiques qui soutiennent la recherche et le développement (R&D) nationaux - et donc les politiques qui permettront à long terme d’enrichir les connaissances à l’échelle mondiale. Toutefois, elle évalue surtout les politiques qui encouragent le transfert et la diffusion des technologies, en particulier auprès des pays les plus pauvres. La Corée du Sud a les dépenses de R&D les plus élevées du CDI, et de nombreux acteurs « traditionnels », tels que l'Autriche, la Norvège, la France, l’Allemagne, les Pays-Bas et leJapon, consacrent également au moins 1 % de leur RNB à la R&D.
Mais de nombreuses économies émergentes sont en tête en termes de diffusion des technologies. Les Émirats arabes unis sont le pays qui accepte le plus grand nombre d'étudiants étrangers : plus de 70 % de ses étudiants du supérieur viennent de l’étranger et, pour la plupart d'entre eux, de pays relativement plus pauvres. L'Arabie saoudite et l’Afrique du Sud sont leaders cette année dans la collaboration en matière de recherche, leurs universitaires se tournant davantage que les autres pays du CDI vers des partenaires issus de pays à faible revenu pour mener leurs recherches. La Chine et l’Indonésie, de leur côté, présentent les dispositions les plus favorables au développement en matière de droits de propriété intellectuelle dans leurs accords de libre-échange avec les pays en développement. Dans ce domaine, les pays de l'UE et les États-Unis ont une approche plus restrictive que celle énoncée dans les règles de l'Organisation mondiale du commerce. Il s’agit d'une occasion manquée pour de nombreux pays du CDI, car les échanges commerciaux et le partage des progrès technologiques conditionnent la croissance économique.
20 ans d'évaluation de l'engagement pour le développement
Il y a 20 ans, le CDI était publié pour la première fois. Depuis 2003, le panorama du développement a changé et le CDI a évolué à mesure que nous comprenions mieux ce et ceux qui étaient les principaux vecteurs de développement.
La première édition du CDI, publiée quelques années seulement après l'établissement des objectifs du Millénaire pour le développement (OMD), n'examinait que six composantes et n'évaluait que 21 pays. La figure 3 montre l'évolution de ces pays fondateurs sur l'ensemble de la période. En 2003, les Pays-Bas étaient à la première place, avec des scores élevés en matière d’aide (financement du développement) et de commerce, mais ils ont depuis chuté dans le classement. Le pays le mieux classé cette année, la Suède, occupait le 8e rang en 2003, avec des résultats médiocres en matière de sécurité et d'investissement.
Il y a vingt ans, la guerre en Irak faisait prendre conscience de l'importance de la sécurité pour le développement. L'invasion de l'Ukraine par la Russie l'année dernière a rappelé de manière brutale les effets néfastes des conflits armés, avec une flambée des prix du pétrole et des denrées alimentaires au détriment du développement. Comme au début des années 2000, la viabilité de la dette est devenue un enjeu pressant. Le fardeau de la dette de nombreux pays a en effet été alourdi par la hausse des taux d'intérêt en raison de la reprise post-pandémie, alors qu’il y a vingt ans, cette hausse était imputable à une croissance économique soutenue.
Figure 3. Classements au CDI au fil des ans pour les 21 pays d'origine
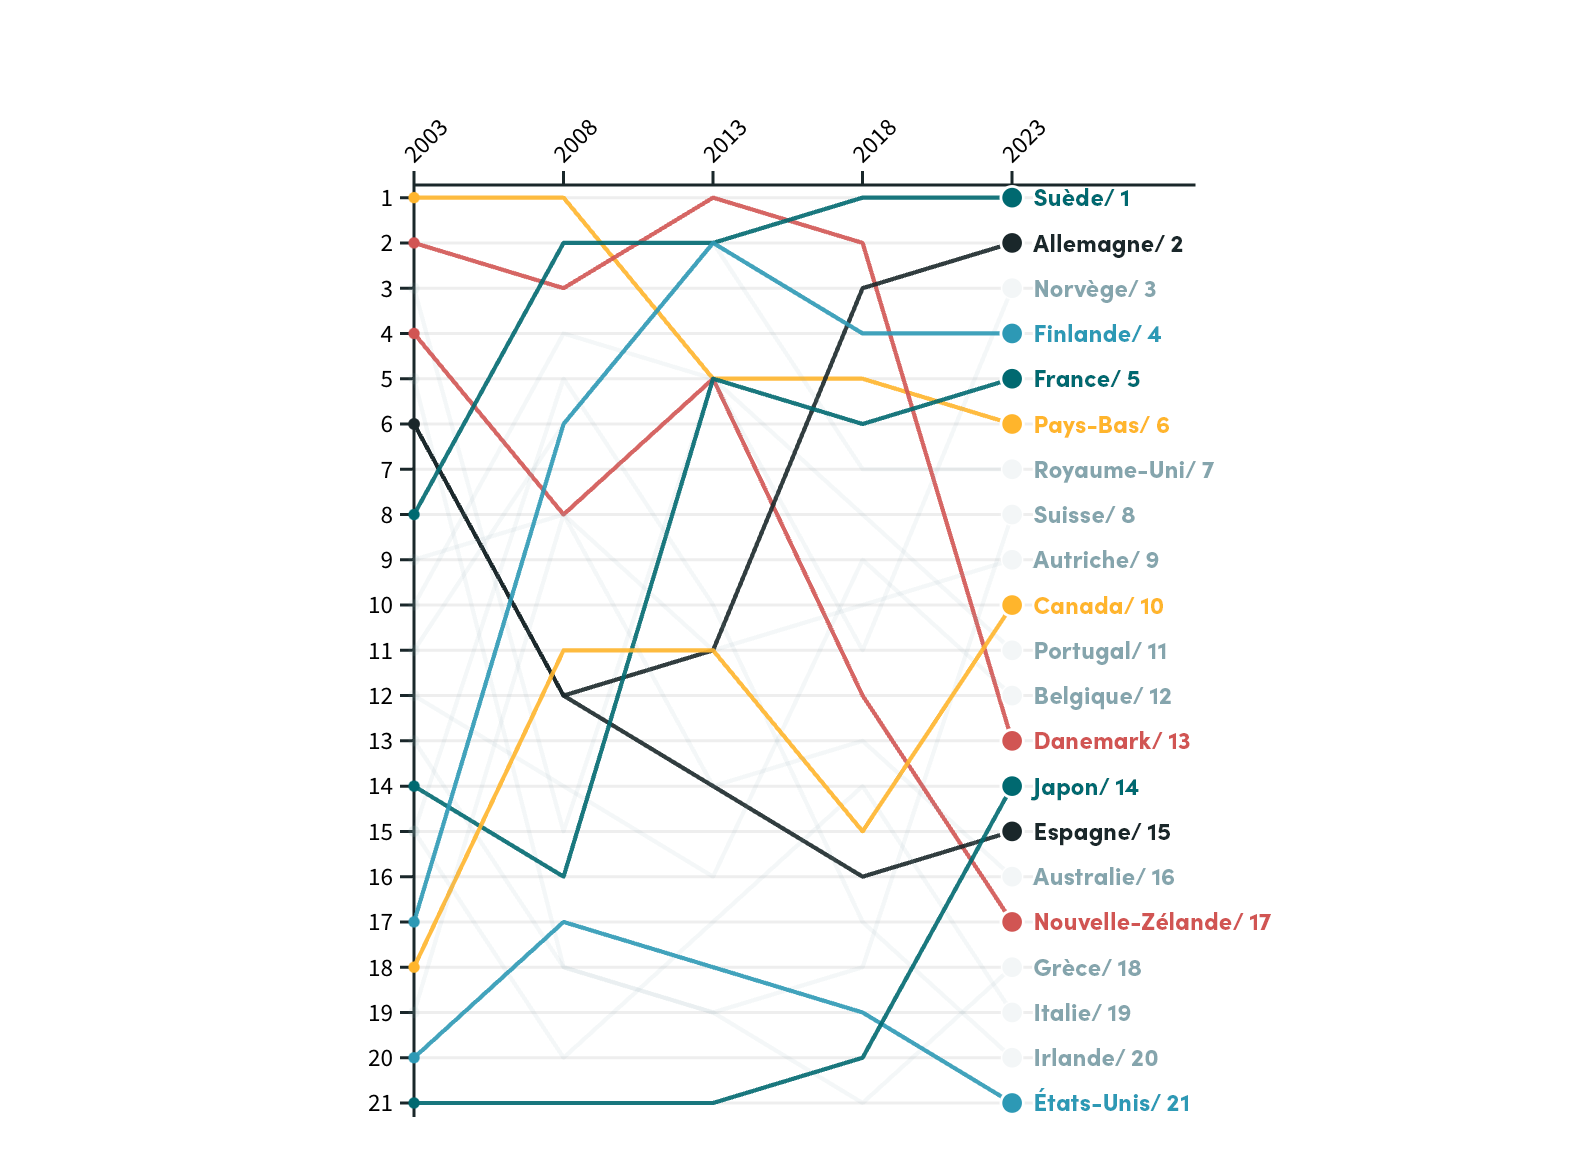
Note : classements basés sur les scores des 21 pays d'origine uniquement
Les autres évolutions notables dans le classement au cours des 20 dernières années sont celle du Japon, qui était régulièrement dernier durant la première décennie, et celles de la Finlande, la France et l'Allemagne, qui ont considérablement progressé. Le Danemark, les Pays-Bas, la Nouvelle-Zélande et l'Espagne ont relâché leur engagement. Les États-Unis ont stagné dans le quart inférieur du classement, tandis que le Canada a progressé.
L’examen d’une poignée d'indicateurs clés du CDI au cours de ces 20 années réserve quelques bonnes surprises. La migration annuelle vers les 40 pays du CDI, par exemple, a augmenté de près de 50 %, en passant de près de 4 millions à 5,9 millions par an. Les dépenses de recherche et développement sont passées de 0,66 % à 0,75 % du RNB. En ce qui concerne le commerce, 33 pays sur 40 ont abaissé la moyenne des tarifs douaniers.
En matière de financement du développement, les efforts des fournisseurs traditionnels - tels qu’identifiés par le Comité d'aide au développement (CAD) de l'OCDE - ont été marqués de 2003 à 2013, passant de 0,24 % à 0,30 % du RNB, mais le financement transfrontalier a stagné depuis. La Chine et d'autres économies à revenu intermédiaire ont néanmoins ajouté au financement total un supplément d’environ un sixième sur toute la période. Les émissions globales de gaz à effet de serre ont, certes, augmenté de 40 % mais 30 pays (pas les plus grands) ont réduit leurs émissions par habitant.
Au cours de ces deux décennies, la convergence entre les « économies émergentes » – notamment les BRICS – et les acteurs traditionnels du développement nous a incités à élargir la couverture du CDI. De plus, la transition des OMD aux ODD a traduit la volonté de mener un programme de développement plus global, ce qui a toujours été un objectif clé du CDI. Afin de refléter l'importance croissante des biens publics mondiaux, deux composantes ont été ajoutées depuis 2003 : la technologie (en 2004) et la santé (en 2021). Cependant, alors que les ODD se concentrent sur les résultats et sur tous les pays, le CDI met l’accent sur la façon dont les politiques des économies les plus puissantes peuvent faire une immense différence. Aujourd'hui, les 40 pays du CDI incluent tous les membres du G20 et représentent 88 % de l'économie mondiale, 74 % des émissions mondiales de gaz à effet de serre et 73 % du commerce mondial.
À l'approche de l'échéance de 2030 pour la réalisation des ODD, le CGD continuera d'évaluer de manière chiffrée les puissances et leurs efforts politiques pour soutenir le développement.
Concernant les rapports des pays et les résultats complets
Rendez-vous sur le site cgdev.org/cdi pour explorer le portail web interactif et découvrir l'indice de l'engagement pour le développement de votre pays. Vous trouverez plus d'informations sur le CDI, y compris le modèle de données complet et la méthodologie sur le site du projet à l'adresse cgdev.org/project/commitment-development-index.

À propos du CDI
L’Indice de l’engagement pour le développement est établi chaque année depuis 2003 par le Center for Global Development (CGD). Le CGD œuvre à réduire la pauvreté mondiale et à améliorer les conditions de vie par le biais de recherches économiques novatrices qui promeuvent de meilleures politiques et pratiques de la part des décideurs mondiaux de premier plan. Ian Mitchell dirige les activités du CDI, avec une contribution majeure de Beata Cichocka et Edward Wickstead. Le CDI 2023 s’appuie sur les travaux des éditions précédentes de Lee Robinson, Anita Käppeli, Owen Barder, David Roodman et Nancy Birdsall. Le CDI bénéficie du soutien financier du programme de développement efficace du CGD Europe, notamment les contributions des gouvernements de l’Australie, du Canada, de l’Allemagne, du Luxembourg et de la Suède. Le CDI ne reflète pas la position officielle des bailleurs de fonds. Les auteurs sont responsables de toutes les décisions méthodologiques et des informations et opinions exprimées dans le présent document.

Topics
CITATION
Mitchell, Ian, Beata Cichocka, and Edward Wickstead. 2023. Commitment to Development Index 2023. Center for Global Development.DISCLAIMER & PERMISSIONS
CGD's publications reflect the views of the authors, drawing on prior research and experience in their areas of expertise. CGD is a nonpartisan, independent organization and does not take institutional positions. You may use and disseminate CGD's publications under these conditions.