Recommended
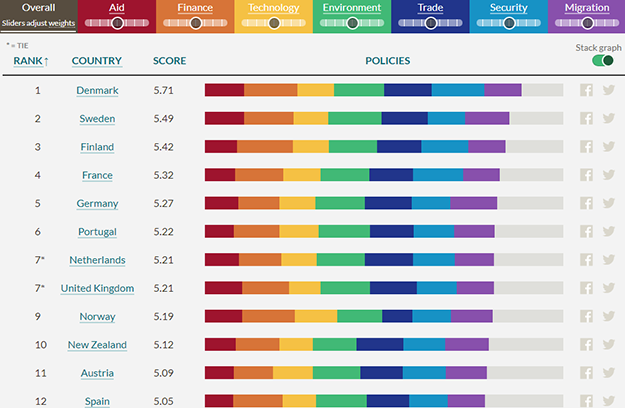

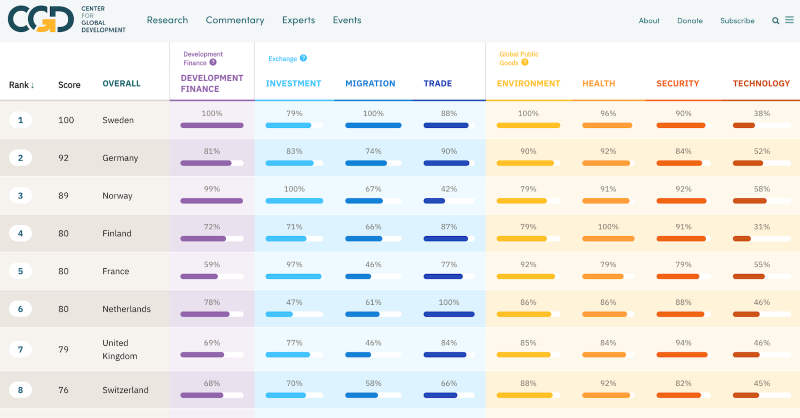
Think tanks and international organisations publish a lot of indices that rank countries or institutions by their policies. We ourselves here at CGD we have recently published the fifteenth edition of the Commitment to Development Index (CDI), which ranks 27 rich countries by how their policies affect the lives of people in poorer countries. As we embark on a review of the CDI, here we start by looking other across country-level indices to see if the CDI is still distinct.
Reviewing the CDI
Because we strive to continuously update and improve the methodology, “before the CDI launch is after the CDI launch.” Indeed, the CDI has evolved substantially over since its inception. Still, we think 15 years is a good point to step back and think about its aims and design: the world has changed since we launched the CDI in 2003: the Agenda 2030 and the SDGs replaced the MDGs; emerging countries such as China and several Arab countries have diversified the donor community and global issues such as climate change; gender and migration receive more attention—and rightly so. In the coming months and years we’ll be taking a fundamental look at the CDI, in particular: how it assesses “development;” whether it measures the most important countries; and whether there are new or alternative components and measures we should consider. We look forward to discussing these issues with you further.
As part of our early thinking, we looked at other country-level indices and the CDI’s comparative advantage—but before we look at those, let’s revisit why indices are potentially valuable.
First, why are indices generally are so popular with the public, with policymakers, and with the think tank world?
A cynic may say that indices oversimplify complex issues and make for good headlines only (cf. “On Religious Hostilities, India Ranked Just Slightly Better Than Syria: Pew Study” or “Canada Is Ranked The 2nd Best Country In The World - We just missed the #1 spot!”).
But indices truly do have distinct advantages, they can:
- Formalize and quantify the things they assess
- Holistically assess issues, rather selectively picking on a single element
- Create a race to the top and engage the media and public
- Consistently assess non-market goods—like global public goods (GPGs)
- Initiate discussions about what is important, and what can hopefully change
As one example, the US administration has criticized Germany for not spending 2 percent of GDP on defense; Germany’s shot back saying the US should first meet the UN commitment 0.7 percent of GNI on aid (the US is at 0.18 percent). Meta indices such as the CDI add up the overall amount of GPGs instead unproductively criticizing one country for falling short on one single issue.
Secondly, what other indices are out there that are similar to the CDI, and what is our competitive advantage?
To answer this we have surveyed our competitor indices. But there are so many indices that we had to restrict our assessment. Given the CDI is a meta index with subindices measuring countries policies on aid, finance, technology, environment, trade, security, and migration, we have decided to focus our survey on those (a meta-meta index if you will).
Below are the main indices that we identified as comparable to the CDI (if you can think of any indices that fit our search criteria and we’ve missed—we’d love to hear from you in the comments section below).
Country-level indices: aims, measures, and coverage
| Name of the index | Tagline / aim | Measures | Number of indicators | Country coverage |
|---|---|---|---|---|
| Commitment to Development Index | Ranks 27 of the world’s richest countries on their dedication to policies that benefit people living in poorer nations. | Seven components: aid, finance, technology, environment, trade, security, and migration | >100 indicators | 27 countries (OECD) |
| Good country index | To measure what each country on earth contributes to the common good of humanity, and what it takes away, relative to its size. | Seven Areas: Science, Technology & Knowledge; Culture; International Peace and Security; World Order; Planet and Climate; Prosperity and Equality; Health and Wellbeing | 35 indicators | 163 countries |
| Social progress index | An aggregate index of a country’s own social and environmental indicators that capture three dimensions of social progress | Basic Human Needs (nutrition, health, etc.), Foundations of Wellbeing (knowledge, environmental quality), Opportunity (rights, tolerance, advanced education, etc). | 50 indicators | 128 countries |
| Sustainable Development Goals index | Provides a report card for country performance on the historic Agenda 2030 and the SDGs. The annual report shows how leaders can deliver on their promise and it urges countries not to lose the momentum for important reforms. | set of indicators for each of the 17 SDGs | 77 indicators of which 14 variables are only available for OECD countries | 149 of the 193 UN member states |
| INFORM Index for risk management | To understand and measure the risk of humanitarian crises and disasters within a country, and how the conditions that lead to them affect sustainable development. | Hazard and exposure to natural and human made risks; Vulnerability; Lack of coping capacity | 50 indicators | 191 countries |
The Good Country Index (GCI) is perhaps closest in terms of its mission in what it is trying to measure: how much countries do for other countries (we published a more detailed blog post of the GCI from a CDI-perspective previously). This is in contrast to the SDG index, the Social Progress Index, and the INFORM index for risk management, that all measure countries based on their own development progress and performance. This point in particular is where the CDI adds value relative to the SDG index.
Rich countries in particular have the duty and the means to contribute to global development.
This explains our focus on relatively few rich countries for which policy improvements seem most tractable given that only some countries governments will be receptive to policy ideas and are inspired to perform well in international comparisons. For instance, after the poor performance of Japan on the CDI in 2006, the Japanese Ministry of Foreign Affairs issued a statement that started a constructive discussion on the methodology of the CDI.
The other thing that jumps out is that, although the CDI covers far fewer countries than the indices above that aim for virtually exclusive coverage, we do have more indicators overall. There is a clear tradeoff between higher country coverage and fewer indicators due to data availability. Even though all else being equal it would of course be ideal to measure every country’s performance, for poorer or smaller countries, data is often scare. The Sustainable Development Index doesn't have complete data for all its indicators, but only managed to have all the indicators for the OECD countries. Limited data availability severely affects how we can track the implementation of the SDGs.
Building on the CDI’s comparative advantage
In conclusion, the CDI is distinct in its focus on policy effort of developed countries' (rather than all countries) and how they affect poorer countries (including through global public goods). This contrasts with indices that assess outcomes, how countries do in terms of their own development, or only how they contribute to global public goods. Even after 15 years, the CDI’s focus is still unique—and highly relevant to the SDGs. However, the increasing importance of other development actors like China, the changing nature of development, and better data availability on global issues will lead us to review its structure over the next couple of years. We will keep you posted on our next steps and appreciate you sharing any of your ideas.
Disclaimer
CGD blog posts reflect the views of the authors, drawing on prior research and experience in their areas of expertise. CGD is a nonpartisan, independent organization and does not take institutional positions.