The formidable challenge of financing the Sustainable Development Goals has focused attention on the role of private capital in filling huge finance gaps. But for low-income countries (LICs), which receive only about 5 percent of total cross-border private capital flows to developing countries, there is little confidence that external private capital will make a significant contribution. Rather, it is assumed that the financing role of external private capital will rise as countries’ income levels rise. This is part of the logic of IDA graduation policy—with income growth, private finance is expected to be increasingly available to help offset the decline in IDA lending as countries graduate.
A few simple figures cast doubt on these assumptions and turn up a few surprises. (See the endnote for a description of the data.)
Surprise 1: It turns out that for the median LIC economy, private capital inflows relative to GDP are already an important and growing source of finance.
Surprise 2: In striking contrast, the median ratio of grants and concessional loans to GDP for LICs has plunged by half in a dozen years.
Surprise 3: There is no significant relationship between private capital inflows/GDP and country per capita income.
Figure 1 compares the median ratio of private capital inflows/GDP for LICs to median tax revenue/GDP and median net ODA/GDP. The private inflows/GDP ratio has risen to nearly half the ratio of tax revenues/GDP—hardly a marginal source of finance, especially as long-term FDI forms the bulk of the private capital inflows. The median ODA/GDP ratio has instead dropped steadily to less than half of tax revenues/GDP. Concessional finance to LICs is not just stagnating as many lament; it is collapsing as a share of LIC economies.
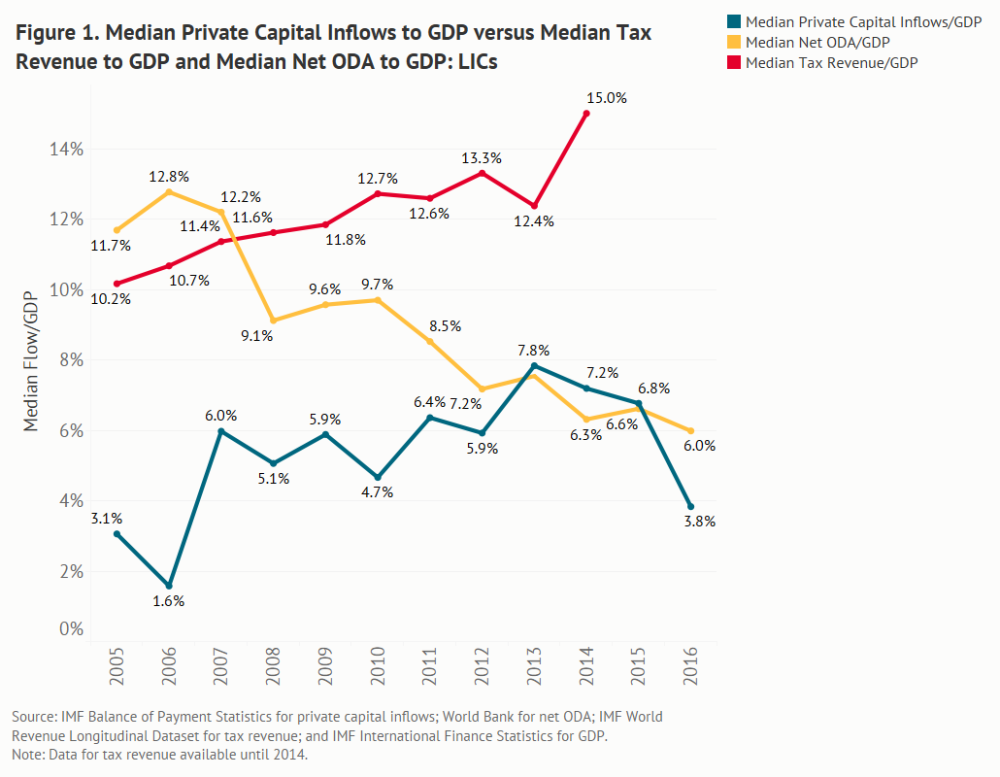
Figure 2 compares median private capital inflow/GDP ratios over time for LICs, lower-middle-income countries (LMICs), and upper-middle-income countries (UMICs). Two points are evident. First, the LIC trend after the global financial crisis is broadly upward, reaching 7–8 percent of GDP in 2013–2015 (with a dip in 2016 in non-FDI inflows as US interest rates began their rise), in contrast to the downward tendencies for LMICs and especially UMICs. Second, for this period, median LIC ratios have been generally equal to, or higher than, those for LMICs and UMICs. Earlier research indicates that the upward trend has been a long-term phenomenon. A focus on private capital inflows as a key source of finance for LICs thus seems worth the effort.
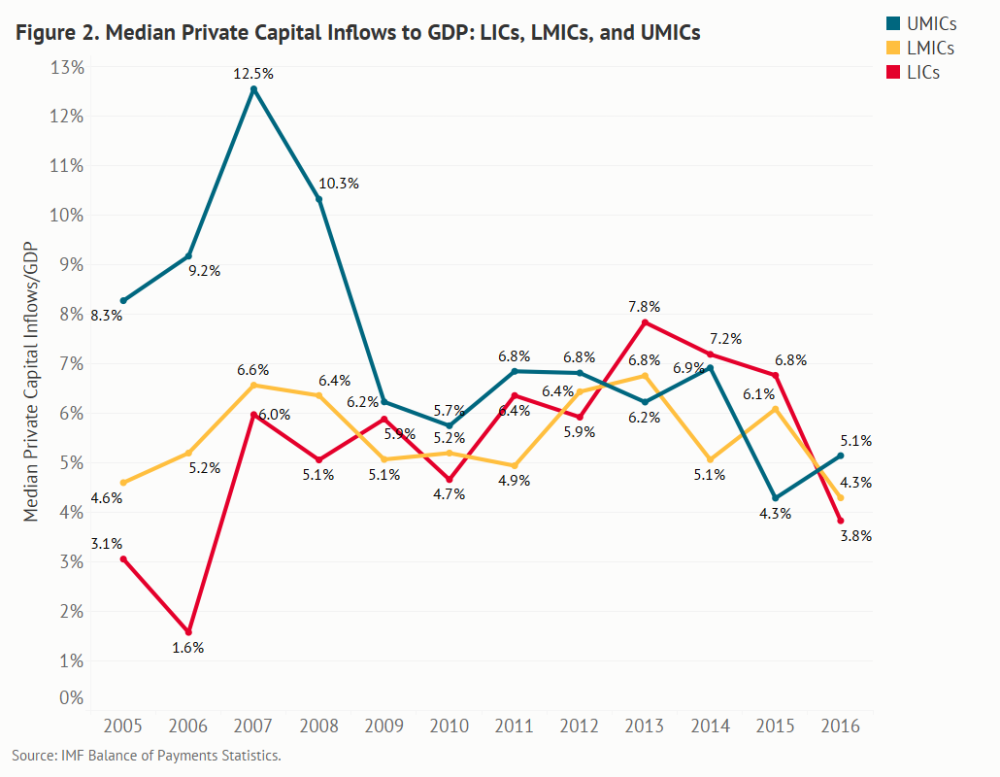
Figure 3 plots median private capital inflow/GDP ratios against median per capita GDP for a sample (where data are consistently available over time) of 94 LICs, LMICs, and UMICs, some of which are classified as IDA countries. There is no significant upward trend for IDA or non-IDA countries. We see no evidence that countries, large or small, with higher incomes tend to have larger private inflows relative to GDP. Rather it may be that domestic private capital plays a growing financing role as country income levels rise.

It would be a stretch to draw specific policy implications from these simple observations. But they do raise two important issues:
First, there is a need for updated research, post global financial crisis, into the policy and other factors that drive private capital inflows into LICs (work which we are undertaking here at CGD).
Second, IDA graduation policies should be formulated with caution. Countries with higher per capita incomes do not routinely garner larger private capital inflows relative to GDP.
Note on the data: This analysis covers 94 developing countries—20 LICs, 37 LMICs, and 37 UMICs—for the period 2005 to 2016. The sample was chosen to minimize missing observations and exclude countries with GDP < $1 billion, which tend to complicate the analysis as outliers. LICs, LMICs, and UMICs have been defined as countries that meet the respective World Bank income group definitions for half (6 years) or more of the time period. IDA countries had IDA status at any time in the last 5 years of the time period. Capital inflows are defined as the net incurrence of liabilities by residents to non-residents: increases in liabilities minus decreases. Inflows include FDI, debt and equity portfolio investment, and private lending to the public and private sectors. (Official lending has been subtracted.)
Disclaimer
CGD blog posts reflect the views of the authors, drawing on prior research and experience in their areas of expertise. CGD is a nonpartisan, independent organization and does not take institutional positions.